JHEP03(2015)088
Published for SISSA by SpringerReceived: December 23, 2014 Revised: February 6, 2015 Accepted: February 17, 2015 Published: March 17, 2015
Search for charged Higgs bosons decaying via
H
±
→ τ
±
ν
in fully hadronic final states using pp
collision data at
√
s
= 8
TeV with the ATLAS
detector
The ATLAS collaboration
E-mail:
atlas.publications@cern.ch
Abstract:
The results of a search for charged Higgs bosons decaying to a τ lepton and a
neutrino, H
±→ τ
±ν, are presented. The analysis is based on 19.5 fb
−1of proton-proton
collision data at
√
s = 8 TeV collected by the ATLAS experiment at the Large Hadron
Collider. Charged Higgs bosons are searched for in events consistent with top-quark pair
production or in associated production with a top quark, depending on the considered H
±mass. The final state is characterised by the presence of a hadronic τ decay, missing
trans-verse momentum, b-tagged jets, a hadronically decaying W boson, and the absence of any
isolated electrons or muons with high transverse momenta. The data are consistent with the
expected background from Standard Model processes. A statistical analysis leads to 95%
confidence-level upper limits on the product of branching ratios B(t → bH
±) × B(H
±→
τ
±ν), between 0.23% and 1.3% for charged Higgs boson masses in the range 80–160 GeV. It
also leads to 95% confidence-level upper limits on the production cross section times
branch-ing ratio, σ(pp → tH
±+ X) ×B(H
±→ τ
±ν), between 0.76 pb and 4.5 fb, for charged Higgs
boson masses ranging from 180 GeV to 1000 GeV. In the context of different scenarios of the
Minimal Supersymmetric Standard Model, these results exclude nearly all values of tan β
above one for charged Higgs boson masses between 80 GeV and 160 GeV, and exclude a
region of parameter space with high tan β for H
±masses between 200 GeV and 250 GeV.
Keywords:
Supersymmetry, Hadron-Hadron Scattering, Beyond Standard Model, Higgs
physics
JHEP03(2015)088
Contents
1
Introduction
1
2
Data and simulated events
3
3
Physics object selection
5
4
Event selection and background modelling
6
4.1
Event selection
6
4.2
Data-driven estimation of the backgrounds with a true τ
had7
4.3
Data-driven estimation of the multi-jet backgrounds
9
4.4
Backgrounds with electrons or muons misidentified as τ
had-vis11
4.5
τ
had-vis+E
Tmisstriggers
11
4.6
Event yields after the event selection
12
5
Systematic uncertainties
12
5.1
τ
had-vis+E
Tmisstriggers
12
5.2
Data-driven background estimation
13
5.3
Detector simulation
15
5.4
Generation of t¯
t and signal events
16
6
Statistical analysis
16
7
Results
18
8
Conclusions
22
The ATLAS collaboration
28
1
Introduction
Charged Higgs bosons (H
+, H
−) are predicted by several non-minimal Higgs scenarios,
such as two-Higgs-doublet Models (2HDM) [
1
] or models containing Higgs triplets [
2
–
6
].
As the Standard Model (SM) does not contain any elementary charged scalar particle, the
observation of a charged Higgs boson
1would clearly indicate new phenomena beyond the
SM. For instance, supersymmetric models predict the existence of charged Higgs bosons. In
a type-II 2HDM, such as the Higgs sector of the Minimal Supersymmetric Standard Model
(MSSM) [
7
–
11
], the main H
+production mode at the Large Hadron Collider (LHC) would
JHEP03(2015)088
be through top-quark decays t → bH
+, for charged Higgs boson masses (m
H+) smaller than
the top-quark mass (m
top). At the LHC, top quarks are produced predominantly through
t¯
t production. In this paper, the contribution to t → bH
+which may arise from single
top-quark production is neglected, since the signal production cross section through this
channel is very small with respect to t¯
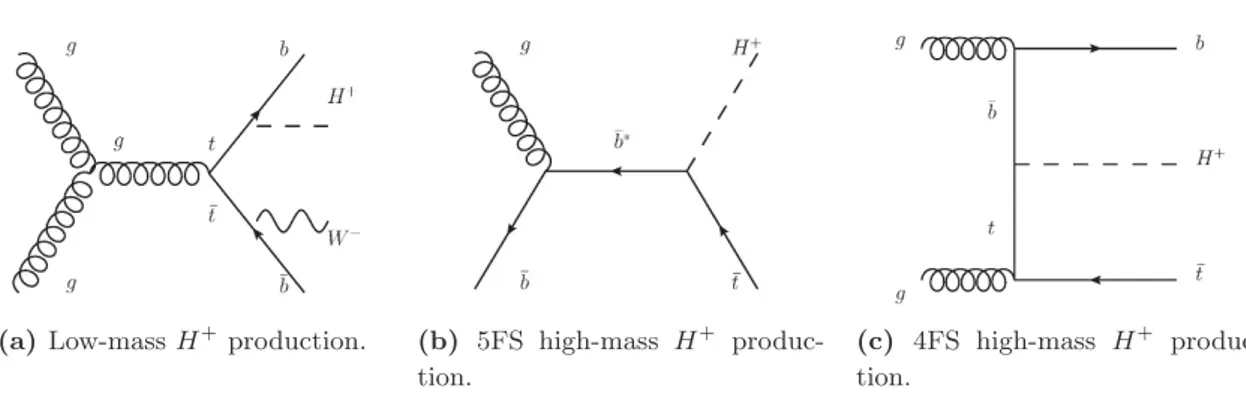
t production. A diagram illustrating the
leading-order production mechanism is shown on the left-hand side of figure
1
. For charged Higgs
boson masses larger than m
top, the main H
+source at the LHC is through associated
production with a top quark. An additional b-quark can also appear in the final state.
The leading-order production mechanisms in two different approximations are illustrated
in the centre and right-hand side diagrams of figure
1
: in the four-flavour scheme (4FS)
b-quarks are dynamically produced, whereas in the five-flavour scheme (5FS) the b-quark
is also considered as an active flavour inside the proton. Their cross sections are matched
according to ref. [
12
], and an evaluation of the two schemes can be found in ref. [
13
].
In the MSSM, the Higgs sector can be completely determined at tree level by one
of the Higgs boson masses, here taken to be m
H+, and tan β, the ratio of the vacuum
expectation values of the two Higgs doublets. For m
H+< m
top, the decay via H
+→ τ
+ν is
dominant for tan β > 2 and remains sizeable for 1 < tan β < 2. For higher m
H+, the decay
via H
+→ τ
+ν is still significant, especially for large values of tan β [
14
]. The combined
LEP lower limit for the charged Higgs boson mass is about 90 GeV [
15
]. The Tevatron
experiments placed upper limits on B(t → bH
+) in the 15–20% range for m
H+
< m
top[
16
,
17
]. In a previous search based on data taken at
√
s = 7 TeV with the ATLAS and CMS
detectors, the limits on B(t → bH
+) were lowered to the range 0.8–4% [
18
,
19
]. For all of
these results, B(H
+→ τ
+ν) = 100% was assumed.
This paper describes a search for charged Higgs bosons with masses in the ranges 80–
160 GeV and 180–1000 GeV. The region 160 GeV < m
H+< 180 GeV is not considered in
this paper, since there is currently no reliable theoretical treatment for the interference
between the different H
+production modes in this transition region [
20
]. The final state
studied is characterised by the presence of a hadronic τ decay (τ
had), missing transverse
momentum (E
Tmiss), b-quark-initiated jets, a hadronically decaying W boson, and the
ab-sence of any isolated electrons or muons with high transverse momenta. In addition to the
large branching ratio for a τ to decay hadronically, this final state contains only
neutri-nos associated with the H
+production and decay, resulting in good discriminating power
between SM and signal processes. Charged Higgs bosons are searched for in a
model-independent way, hence results are given in terms of B(t → bH
+) × B(H
+→ τ
+ν)
(low-mass search, m
H+< m
top) and σ(pp → ¯tH
++ X) × B(H
+→ τ
+ν) (high-mass search,
m
H+> m
top). These limits are then also interpreted in different MSSM scenarios. The
results are based on 19.5 fb
−1of data from pp collisions at
√
s = 8 TeV, collected in 2012
with the ATLAS detector at the LHC. The final state analysed for the low-mass search is
t¯
t → b¯bW
−H
+→ b¯b(q¯
q
′)(τ
had+ν). The final state is similar or identical for the high-mass
search, depending on whether the additional b-quark-initiated jet is seen in the detector,
gb → ¯tH
+→ (W
−¯b)H
+→ (q¯
q
′¯b)(τ
+had
ν) in the 5FS case and gg → ¯tbH
+→ (W
−
¯b)bH
+→
(q ¯
q
′¯b)b(τ
+JHEP03(2015)088
(a) Low-mass H+ production. (b) 5FS high-mass H+produc-tion.
(c) 4FS high-mass H+ produc-tion.
Figure 1. Leading-order Feynman diagrams for the dominant production modes of charged Higgs bosons at masses (a) below and (b, c) above the top-quark mass.
This paper is organised as follows. In section 2, the data and simulated samples used
in this analysis are described. In section 3, the reconstruction of physics objects in ATLAS
is discussed. The event selection and background modelling are presented in section 4.
Systematic uncertainties are discussed in section 5, and the limit-setting procedure is
de-scribed in section 6. Exclusion limits in terms of B(t → bH
+) × B(H
+→ τ
+ν) (low-mass)
and σ(pp → ¯tH
++ X) × B(H
+→ τ
+ν) (high-mass) as well as model-dependent exclusion
contours are presented in section 7.
2
Data and simulated events
The ATLAS detector [
21
] consists of an inner tracking detector with coverage in
pseudora-pidity
2up to |η| = 2.5, surrounded by a thin 2 T superconducting solenoid, a calorimeter
system extending up to |η| = 4.9 and a muon spectrometer extending up to |η| = 2.7 that
measures the deflection of muon tracks in the field of three superconducting toroid
mag-nets. A three-level trigger system is used. The first-level trigger (L1) is implemented in
hardware, using a subset of detector information to reduce the event rate to no more than
75 kHz. This is followed by two software-based trigger levels (L2 and EF), which together
further reduce the event rate to less than 1 kHz.
Only data taken with all ATLAS subsystems operational are used. Stringent detector
and data quality requirements are applied, resulting in an integrated luminosity of 19.5 fb
−1for the 2012 data-taking period. The integrated luminosity has an uncertainty of 2.8%,
measured following the methodology described in ref. [
22
]. Events are required to have a
primary vertex with at least five associated tracks, each with a transverse momentum p
Tgreater than 400 MeV. The primary vertex is defined as the reconstructed vertex with the
largest sum of squared track transverse momenta.
2ATLAS uses a right-handed coordinate system with its origin at the nominal interaction point (IP) in the centre of the detector and the z-axis along the beam pipe. The x-axis points from the IP to the centre of the LHC ring, and the y-axis points upwards. Cylindrical coordinates (r, φ) are used in the transverse plane, φ being the azimuthal angle around the z-axis. The pseudorapidity is defined in terms of the polar angle θ as η = − ln tan(θ/2).
JHEP03(2015)088
The background processes to this search include SM pair production of top quarks,
as well as the production of single top-quark, W +jets, Z/γ
∗+jets, diboson and multi-jet
events. These backgrounds are categorised based on the type of reconstructed objects
identified as the visible decay products
3of the hadronically decaying τ candidate (τ
had-vis).
The dominant backgrounds in this analysis, those containing a true τ
had, where the τ
had-visis correctly identified, or a jet misidentified as a τ
had-viscandidate, are estimated in a
data-driven way (sections
4.2
and
4.3
), while simulation samples are used to estimate the minor
background arising from events with a lepton misidentified as a τ
had-vis(1–2% of the total
background). Simulation samples are also used to develop and validate the analysis.
The modelling of SM t¯
t and single top-quark events is performed with MC@NLO [
23
,
24
], except for t-channel single top-quark production, for which AcerMC [
25
] is used. The
top-quark mass is set to 172.5 GeV and the set of parton distribution functions used is
CT10 [
26
]. For events generated with MC@NLO, the parton shower, hadronisation and
underlying event are added using HERWIG [
27
] and JIMMY [
28
]. PYTHIA6 [
29
] is used
instead for events generated with AcerMC. Inclusive cross sections are taken from the
approximate next-to-next-to-leading-order (NNLO) predictions for t¯
t production [
30
], for
single top-quark production in the t-channel and s-channel [
31
,
32
], as well as for W t
production [
33
]. Overlaps between SM W t and t¯
t final states are removed [
24
]. Single vector
boson (W and Z/γ
∗) production is simulated with up to five accompanying partons, using
ALPGEN [
34
] interfaced to HERWIG and JIMMY, and using the CTEQ6L1 [
35
] parton
distribution functions. The additional partons produced in the matrix-element part of the
event generation can be light partons or heavy quarks. In the latter case, ALPGEN is also
used to generate dedicated samples with matrix elements for the production of massive
b¯b or c¯
c pairs. Diboson events (W W , W Z and ZZ) are generated using HERWIG. The
cross sections are normalised to NNLO predictions for W -boson and Z/γ
∗production [
36
,
37
] and to next-to-leading-order (NLO) predictions for diboson production [
38
]. The SM
background samples are summarised in table
1
.
Signal samples are produced with PYTHIA 6 for 80 GeV ≤ m
H+≤ 160 GeV in m
H+intervals of 10 GeV separately for t¯
t → b¯bH
+W
−and t¯
t → b¯bH
−W
+, where the charged
Higgs bosons decay via H
+→ τ
+ν. The process t¯
t → b¯bH
+H
−gives a very small
contribu-tion to the signal region, which is negligible after the event seleccontribu-tion described in seccontribu-tion
4.1
.
The cross section for these processes depends only on the total t¯
t production cross section
and the branching ratio B(t → bH
+). For 180 GeV ≤ m
H+≤ 1000 GeV, the simulation
of the signal for top-quark associated H
+production is performed with POWHEG [
39
]
interfaced to PYTHIA 8 [
40
]. For 180 GeV ≤ m
H+≤ 200 GeV, samples are produced in
m
H+steps of 10 GeV, then in intervals of 25 GeV up to m
H+= 300 GeV and in intervals
of 50 GeV for m
H+≤ 600 GeV. Additionally, signal mass points at m
H+= 750 GeV and
m
H+= 1000 GeV are produced. The production cross section for the high-mass charged
Higgs boson is computed using the 4FS and 5FS, including theoretical uncertainties, and
combined according to ref. [
12
]. The samples are generated at NLO using the 5FS and the
narrow-width approximation for the H
+. Possible effects from the interference between
JHEP03(2015)088
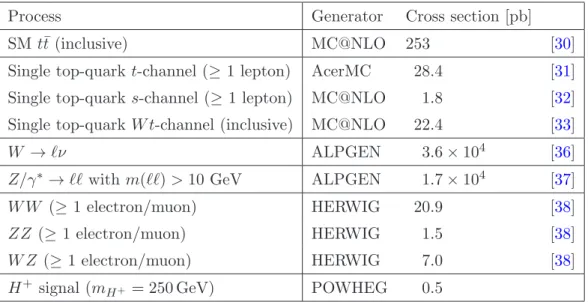
Process
Generator
Cross section [pb]
SM t¯
t (inclusive)
MC@NLO
253
[
30
]
Single top-quark t-channel (≥ 1 lepton)
AcerMC
28.4
[
31
]
Single top-quark s-channel (≥ 1 lepton) MC@NLO
1.8
[
32
]
Single top-quark W t-channel (inclusive)
MC@NLO
22.4
[
33
]
W → ℓν
ALPGEN
3.6 × 10
4[
36
]
Z/γ
∗→ ℓℓ with m(ℓℓ) > 10 GeV
ALPGEN
1.7 × 10
4[
37
]
W W (≥ 1 electron/muon)
HERWIG
20.9
[
38
]
ZZ (≥ 1 electron/muon)
HERWIG
1.5
[
38
]
W Z (≥ 1 electron/muon)
HERWIG
7.0
[
38
]
H
+signal (m
H+
= 250 GeV)
POWHEG
0.5
Table 1. Cross sections for the simulated processes and reference generators used to model them. For the high-mass H+
signal selection, the value shown is the cross section times B(H+
→ τ+ν) for the MSSM mmax
h scenario [41, 42], corresponding to mH+ = 250 GeV and tan β = 50. This
cross section includes both H+ and H− production. The low-mass signal, which is not included in the table, assumes one H+ produced per t¯t decay, so it is a fraction of the t¯t cross section. The previously published upper limit on B(t → bH+) for mH
+ = 130 GeV is 0.9% [18].
the production of a charged Higgs boson through t¯
t and top-quark associated production
are not taken into account.
The event generators are tuned to describe the ATLAS data.
In samples where
PYTHIA 6 is interfaced to AcerMC, the AUET2B [
43
] tune is used. The Perugia 2011 C
tune [
44
] is used when PYTHIA 6 is interfaced to POWHEG. For the samples generated
with HERWIG, the AUET2 [
45
] tune is used. In all samples with τ leptons, except for
those simulated with PYTHIA 8,
4TAUOLA [
46
] is used for the τ decays. PHOTOS [
47
]
is used for photon radiation from charged leptons in all samples where applicable.
To take into account the presence of multiple proton-proton interactions occurring in
the same and neighbouring bunch crossings (referred to as pile-up), simulated
minimum-bias events are added to the hard process in each generated event. Prior to the analysis,
simulated events are reweighted in order to match the distribution of the average number
of pile-up interactions in the data. All generated events are propagated through a detailed
GEANT4 simulation [
48
,
49
] of the ATLAS detector and are reconstructed with the same
algorithms as the data.
3
Physics object selection
Jets are reconstructed from energy deposits in the calorimeters, using the anti-k
talgo-rithm [
50
,
51
] with a radius parameter of R = 0.4. Jets are required to have p
T> 25 GeV
4So-called “sophisticated tau-decays” have been available in PYTHIA since version 8.150 such that the usage of TAUOLA is not necessary.
JHEP03(2015)088
and |η| < 2.5. To reduce the contribution of jets initiated by pile-up, jets with p
T< 50 GeV
and |η| < 2.4 must pass the requirement that at least half of the p
Tof the tracks associated
with the jet is contributed by tracks matched to the primary vertex [
52
]. An algorithm
identifies jets containing b-quarks by combining impact parameter information with the
ex-plicit determination of a secondary vertex [
53
], and these are referred to as b-tagged jets. A
working point corresponding to a 70% efficiency for identifying b-quark-initiated jets is used.
Candidates for identification as τ
had-visarise from jets reconstructed from energy
de-posits in calorimeters, again using the anti-k
talgorithm with a radius parameter of R = 0.4,
which have p
T> 10 GeV and one or three charged-particle tracks within a cone of size of
∆R < 0.2, where ∆R =
p(∆η)
2+ (∆φ)
2around the τ
had-vis
axis [
54
]. These candidates
are further required to have a visible transverse momentum (p
τT
) of at least 20 GeV and
to be within |η| < 2.3. The output of boosted decision tree algorithms [
55
,
56
] is used
to distinguish τ
had-visfrom jets not initiated by τ leptons, separately for τ
haddecays with
one or three charged-particle tracks. In this analysis, a point with 40% (35%) efficiency
for identification of 1(3)-prong τ
had-visis used, and this requirement is referred to as the
τ
had-visidentification. Dedicated algorithms are used to reject electrons and muons that are
incorrectly identified as τ
had-vis[
54
]. After these algorithms are applied, the backgrounds
arising from muons and electrons misidentified as τ
had-visare very small, although there is
still a sizeable background from jets misidentified as τ
had-vis.
The E
missT
is defined as the magnitude of the negative vectorial sum of transverse
momenta of muons and energy deposits in the calorimeter. It is computed using fully
calibrated and reconstructed physics objects [
57
].
The final states considered in this search contain no charged leptons, hence events
containing isolated electron or muon candidates with high transverse momenta are
re-jected. Electron candidates are reconstructed from energy deposits in the calorimeter that
are matched to tracks in the inner detector, taking losses due to bremsstrahlung into
ac-count. They are required to have a transverse energy (E
T) greater than 25 GeV and to
be within |η| < 2.47 (the transition region between the barrel and end-cap calorimeters,
1.37 < |η| < 1.52, is excluded) [
58
,
59
]. Muon candidates must pass tracking
require-ments in both the inner detector and the muon spectrometer, have p
T> 25 GeV and
|η| < 2.5 [
60
]. Additionally, electron candidates are required to pass pile-up-corrected 90%
efficient calorimeter- and track-based isolation, with ∆R cone sizes of 0.2 and 0.3,
respec-tively, while muon candidates are required to pass a relative track-based isolation of < 0.05
with a ∆R cone < 0.4 [
61
].
4
Event selection and background modelling
4.1
Event selection
The analysis uses events passing a τ
had-vis+E
Tmisstrigger. The τ
had-vistrigger is defined by
calorimeter energy in a narrow core region and an isolation region at L1, a basic combination
of tracking and calorimeter information at L2 and more sophisticated algorithms imported
from the offline reconstruction at the EF. The E
missT
trigger uses calorimeter information
JHEP03(2015)088
momentum of the τ
had-vistrigger object is 27 GeV or 29 GeV, and for the E
Tmisstrigger
the EF threshold is 40 GeV or 50 GeV. The multiple trigger thresholds are the result of
slight changes of the trigger definition during the 2012 data-taking period, for which 50%
of events had EF thresholds at 27 GeV and 50 GeV, 43% at 29 GeV and 50 GeV, and 7%
at 29 GeV and 40 GeV, for the τ
had-visand E
Tmisstriggers, respectively.
Further event filtering is performed by discarding events in which any jet with p
T>
25 GeV fails the quality cuts discussed in ref. [
62
]. This ensures that no jet is consistent with
having originated from instrumental effects or non-collision backgrounds. The following
requirements are then applied:
• at least four (three) selected jets for the low-mass (high-mass) signal selection;
• at least one of these selected jets being b-tagged at the 70%-efficient working point;
• exactly one selected τ
had-viswith p
τT> 40 GeV matched to a τ
had-vistrigger object
(trigger-matched);
• no selected electron or muon in the event;
• E
Tmiss> 65 (80) GeV for the low-mass (high-mass) signal selection;
• E
Tmiss/
q
P p
PV trkT
> 6.5 (6.0) GeV
1/2for the low-mass (high-mass) signal selection,
where
P p
PV trkT
is the sum of transverse momenta of all tracks originating from the
primary vertex. This is to reject events in which a large reconstructed E
Tmissis due
to the limited resolution of the energy measurement.
For the selected events, the transverse mass (m
T) of the τ
had-visand E
Tmissis defined as:
m
T=
q
2p
τT
E
Tmiss(1 − cos ∆φ
τ,miss),
(4.1)
where ∆φ
τ,missis the azimuthal angle between the τ
had-visand the direction of the missing
transverse momentum. This discriminating variable takes values lower than the W boson
mass for W → τν background events and less than the H
+mass for signal events, in the
absence of detector resolution effects.
A minimal requirement is placed on m
Tat 20 (40) GeV in the low-mass (high-mass)
H
+search. This requirement is motivated in section
4.2
. After the full event selection,
the signal has an acceptance of 0.30–0.60% for the low-mass range, and 1.7–5.8% for the
high-mass range, where in both cases the acceptance increases with increasing m
H+. The
acceptances are evaluated with respect to signal samples where both the τ lepton and the
associated top quark decay inclusively.
4.2
Data-driven estimation of the backgrounds with a true τ
hadAn embedding method [
63
] is used to estimate the backgrounds that contain a real τ
hadfrom a vector boson decay. The method is based on a control data sample of µ+jets events
satisfying criteria similar to those of the signal selection except for the τ
had-visrequirements
and replacing the detector signature of the muon by a simulated hadronic τ decay. The
JHEP03(2015)088
method is applied to a control region of µ+jets events, rather than e+jets, due to the clean
signature and the relative ease with which the measured muon can be removed. These new
hybrid events are then used for the background prediction. An advantage of this approach,
compared to simulation, is that with the exception of the τ
had, the estimate is extracted
from data; this includes the contributions from the underlying event and pile-up, jets,
and all sources of E
missT
except for the neutrino from the τ
haddecay. Furthermore, since
the normalisation of the background estimate is evaluated from the data, assuming lepton
universality of the W boson decay, the method does not rely on theoretical cross sections
and their uncertainties. This embedding method has been used in previous charged Higgs
boson searches [
64
] as well as in SM H → ττ [
65
,
66
] analyses.
To select the µ+jets sample from the data, the following requirements are made:
• a single-muon trigger with a p
Tthreshold of 24 GeV or 36 GeV (single-muon
trig-gers with two different p
Tthresholds are used, since the lower-threshold trigger also
requires the muon to be isolated);
• exactly one isolated muon with p
T> 25 GeV and no isolated electron with
E
T> 25 GeV;
• at least four (three) jets with p
T> 25 GeV for the low-mass (high-mass) charged
Higgs boson search, at least one of which is b-tagged;
• E
missT
> 25 (40) GeV for the low-mass (high-mass) charged Higgs boson search.
This selection is looser than the selection defined in section
4.1
in order not to bias the
sample. However, the E
missT
cut in the µ+jets sample selection removes events with very
low m
T. Thus, a cut on m
T> 20 (40) GeV is introduced in the search for low-mass
(high-mass) charged Higgs bosons to remove this bias. With this selection, there is a possible
small contamination from signal events with a leptonically decaying τ lepton. This small
contamination, which is estimated using simulation, has a much softer m
Tdistribution
than the signal with τ
had, and is observed to have a negligible impact on the evaluation
of signal strength or exclusion limits. Contamination from leptonically decaying τ leptons
from W decays is accounted for in the overall normalisation (c
τ →µin eq. (
4.3
)).
To replace a muon in the selected data, the track that is associated with the muon is
removed. The energy deposited in the calorimeters is removed by simulating a W → µν
event with the same kinematics as in the selected data event and identifying the
correspond-ing cells. Thus, the removal of energy deposits not associated with the selected muon is
minimised. The momentum of the muon in selected events is extracted and rescaled to
account for the higher τ lepton mass,
~
p
τ=
q
E
2 µ− m
2τp~p
µ· ~p
µ~
p
µ,
(4.2)
where ~
p
τis the rescaled momentum, E
µis the reconstructed energy of the muon, m
τis the τ
JHEP03(2015)088
[GeV] T m 50 100 150 200 250 Events / 20 GeV 0 200 400 600 800 1000 1200 1400 Data (embedded) Single top W/Z+jets tt Uncertainty selection + H Low−mass ATLAS -1 Ldt = 19.5 fb∫
= 8 TeV s(a) Low-mass H+ selection.
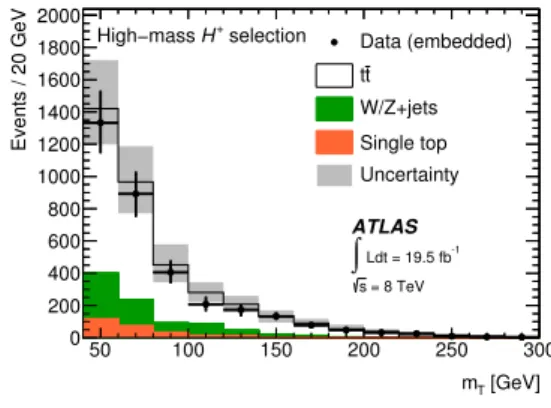
[GeV] T m 50 100 150 200 250 300 Events / 20 GeV 0 200 400 600 800 1000 1200 1400 1600 1800 2000 Data (embedded) Single top W/Z+jets tt Uncertainty selection + H High−mass ATLAS -1 Ldt = 19.5 fb
∫
= 8 TeV s (b) High-mass H+ selection.Figure 2. Comparison of the mTdistributions for events with a true τhadfor the (a) low-mass and (b) high-mass charged Higgs boson search, as predicted by the embedding method and simulation. Combined statistical and systematic uncertainties (as described in section 5) for the embedded sample are shown as error bars, and all systematic uncertainties applicable to simulation are shown as hatched bands.
is further processed by TAUOLA to produce the hadronic τ decay and account for the τ
polarisation as well as for final-state radiation. The τ lepton decay products are propagated
through the full detector simulation and reconstruction. Events referred to as containing
a true τ
hadare those with a genuine τ
hadas expected from the embedding method.
The shape of the m
Tdistributions for backgrounds with a true τ
hadis taken from the
distribution obtained with the embedded events, after applying the corresponding signal
selection. The normalisation is then derived from the number of embedded events:
N
τ= N
embedded· (1 − c
τ →µ)
ǫ
τ +EmissT −trigger
ǫ
µ−ID,trigger× B(τ → hadrons + ν),
(4.3)
where N
τis the estimated number of events with a true τ
had, N
embeddedis the number of
embedded events in the signal region, c
τ →µis the fraction of events in which the selected
muon is a decay product of a τ lepton (taken from simulation, about 4%), ǫ
τ +EmissT −trigger
is the τ
had-vis+E
Tmisstrigger efficiency (as a function of p
τTand E
Tmiss, derived from data,
see section
4.5
), ǫ
µ−ID,triggeris the muon trigger and identification efficiency (as a function
of p
Tand η, derived from data) and B(τ → hadrons + ν) is the branching ratio of the τ
lepton decays to hadrons.
The m
Tdistributions for selected events with a true τ
had, as obtained with the
em-bedding method, are shown in figure
2
and compared to simulation. Embedded data and
simulation agree well and are within uncertainties. The combined systematic and statistical
uncertainties on the embedded prediction and simulation are compared directly in figure
2
,
where the reduction provided by the use of the embedding method is shown.
4.3
Data-driven estimation of the multi-jet backgrounds
For the data-driven estimation of the backgrounds with a jet misidentified as a τ
had-visJHEP03(2015)088
criteria. The tight sample contains a larger fraction of events with a real τ
had-vis, which are
required to pass the tight τ
had-visidentification selection described in the object selection,
in addition to the trigger matching required in the event selection of section
4.1
. The loose
sample, which contains a larger fraction of events with a misidentified τ
had-vis, is obtained
by removing the τ
had-visidentification requirement that was applied in the tight sample.
By construction, the tight data sample is a subset of the loose data sample.
The loose sample consists of N
rand N
mevents with, respectively, a real or misidentified
τ
had-vis. It is also composed of N
Levents with a τ
had-vispassing a loose but not tight
selection, and N
Tevents in which the τ
had-visfulfils the tight selection. Using the efficiencies
p
rand p
m, respectively, for a real or misidentified loose τ
had-vissatisfying the tight criteria,
the following relation can be established:
N
TN
L!
=
p
rp
m(1 − p
r) (1 − p
m)
!
×
N
rN
m!
.
(4.4)
In turn, inverting the 2 × 2 matrix above, the number of events in which the
misiden-tified τ
had-vispasses the tight selection can be written as:
N
mT= p
mN
m=
p
mp
rp
r− p
mN
L+
p
m(p
r− 1)
p
r− p
mN
T.
(4.5)
The final values of p
rand p
mare parameterised in terms of the number of charged-particle
tracks in the core cone (∆R ≤ 0.2) and the number of charged-particle tracks in the hollow
isolation cone (0.2 < ∆R < 0.4) around the τ
had-visaxis [
54
], as well as the p
Tand |η| of
the τ
had-vis. Correlations between the variables used for parameterisation are found to have
a negligible effect on the results of the method.
The probability p
ris determined using true τ
had-visin simulated t¯
t events in the
sig-nal region. The probability p
mis measured in a W +jets control region in data. Events
in this control region are triggered by a combined trigger requiring an electron with
E
T> 18 GeV or a muon with p
T> 15 GeV in addition to a τ
had-vis. In both cases,
the τ
had-vistrigger object has a p
Tthreshold of 20 GeV. The control region must have
ex-actly one trigger-matched reconstructed electron or muon, in addition to a trigger-matched,
reconstructed, loose τ
had-vis. The control region is also required to have zero b-tagged jets
and m
T(e/µ, E
missT) > 50 GeV (using eq. (
4.1
), with the τ
had-visreplaced by the electron
or muon). The contamination from correctly reconstructed τ
had-vis(7%) and electrons or
muons mis-reconstructed as τ
had-vis(5%) is subtracted using simulation. Signal processes
contribute negligibly to this region (< 0.1%).
Having computed the identification and misidentification efficiencies p
rand p
m, every
event in the loose sample is given a weight w as follows, in order to estimate the background
with a misidentified τ
had-visin the tight sample:
• for an event with a loose but not tight τ
had-vis, w
L=
p
mp
rp
r− p
m;
• for an event with a tight τ
had-vis, w
T=
p
m(p
r− 1)
p
r− p
mJHEP03(2015)088
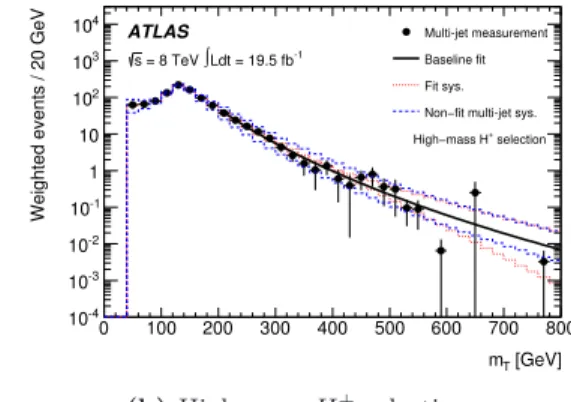
[GeV]
T
m 0 100 200 300 400 500 600 700 800
Weighted events / 20 GeV
-4 10 -3 10 -2 10 -1 10 1 10 2 10 3 10 4 10 Multi-jet measurement Baseline fit Fit sys. Non−fit multi-jet sys.
-1 Ldt = 19.5 fb ∫ = 8 TeV s selection + Low−mass H ATLAS
(a) Low-mass H+ selection.
[GeV]
T
m 0 100 200 300 400 500 600 700 800
Weighted events / 20 GeV
-4 10 -3 10 -2 10 -1 10 1 10 2 10 3 10 4 10 Multi-jet measurement Baseline fit Fit sys. Non−fit multi-jet sys.
-1 Ldt = 19.5 fb ∫ = 8 TeV s selection + High−mass H ATLAS (b) High-mass H+ selection.
Figure 3. The multi-jet background predictions from data-driven methods for the (a) low-mass and (b) high-mass H+ event selections, with the results of fits using the power-log function, are shown in the solid line. The dotted lines show the systematic uncertainty from the choice of the fit function. The dashed lines show the total combined fits from the sources of systematic uncertainty listed in table4.
Events with jets misidentified as τ
had-visare a major background in the high-m
Tregion
(> 300 GeV low-mass and > 400 GeV high-mass), but this region has less than one expected
event per 20 GeV bin. This limitation is circumvented by fitting the m
Tdistribution using
a power-log function in the mass range 200–800 GeV. The power-log function is defined by
the following formula:
f (x) = x
a+b ln(x),
(4.6)
where a and b are fitted constants. The resulting m
Tdistribution after considering each
systematic uncertainty is fitted separately. An additional systematic uncertainty is added
for the choice of fit function, by symmetrising the difference between the baseline fit and
an alternative fit using an exponential function. The exponential is chosen to probe the
effect on the expected yield in the poor statistics tail region, since it also describes the
multi-jet background well in the region with many events. Figure
3
shows the fits obtained
in the nominal case, for the systematic uncertainty due to the chosen fit function, and for
all other systematic uncertainties related to this background estimation (see section
5.2
).
4.4
Backgrounds with electrons or muons misidentified as τ
had-visBackgrounds that arise from events where an electron or muon is misidentified as τ
had-visare
heavily suppressed by dedicated veto algorithms, so that these events only contribute at the
level of 1–2% to the total background. These backgrounds are estimated from simulated
events, and they include contributions from t¯
t, single top-quark, diboson, W +jets and
Z+jets processes. Leptons from in-flight decays in multi-jet events are accounted for in
the multi-jet background estimate.
4.5
τ
had-vis+E
Tmisstriggers
The analysis presented in this paper relies on τ
had-vis+E
Tmisstriggers. To correct for any
dif-ference between the trigger efficiencies observed in simulation and those observed in data,
JHEP03(2015)088
p
τT- and E
Tmiss-dependent correction factors are derived, whose evaluation is limited by
sta-tistical uncertainties. To increase the sample size, the τ
had-visand E
Tmisstrigger efficiencies
are determined separately and residual effects due to correlations are taken into account as
systematic uncertainties. To measure the efficiencies, a tag-and-probe method is used in a
control region enriched with t¯
t events with a µ+τ
hadselection using a muon trigger with a p
Tthreshold of 24 GeV or 36 GeV. The trigger efficiencies are fitted separately for events with
a τ
had-visthat has one or three charged-particle tracks. The p
τT(E
Tmiss) trigger efficiencies
are fitted in the range of 20–100 (20–500) GeV. The ratios of the fitted functions for data
and simulation are then applied to the simulated samples as continuous correction factors.
Since no trigger information is available in the embedded sample, trigger efficiencies are
applied to that sample. The efficiencies for the τ
had-vistrigger derived as described above
need to be corrected for misidentified τ
had-vis. The fraction of events with a misidentified
τ
had-visis substantial in the µ + τ
hadsample used for the tag-and-probe method, leading to
a lower efficiency than in a sample with only events that have a true τ
had-vis. Since only
events with a true τ
had-visare present in the embedded sample, the efficiencies determined
from data are corrected by the ratio of the simulated efficiency for true τ
had-visto the
simulated efficiency for the µ + τ
hadsample.
4.6
Event yields after the event selection
The expected numbers of background events and the results from data, together with an
ex-pectation from signal contributions in the low-mass and high-mass H
+selections, are shown
in table
2
. For the low-mass H
+search, the signal contribution is shown for a cross section
corresponding to B(t → bH
+) × B(H
+→ τν) = 0.9%, and for the high-mass H
+search a
possible signal contribution in the m
maxhscenario of the MSSM with tan β = 50 is shown.
The number of events with a true τ
hadis derived from the number of embedded
events and does not depend on the theoretical cross section of the t¯
t → b¯bW
+W
−process.
However, this analysis does rely on the theoretical inclusive t¯
t production cross section
σ
t¯t= 253
+13−15pb [
30
] for the estimation of the small background with electrons or muons
misidentified as τ
had-vis.
5
Systematic uncertainties
5.1
τ
had-vis+E
missT
triggers
Systematic uncertainties on the measurement of the τ
had-vis+E
Tmisstrigger efficiencies arise
from multiple sources: the selection of the muon in the µ+τ
hadsample, the number of
misidentified τ
had-vis, the choice of fitting function, slightly varying trigger requirements
during the data-taking period, a residual correlation between the τ
had-visand E
missTtriggers,
and the effect of the τ
had-visenergy correction on the trigger efficiency. The dominant
systematic uncertainty, which arises from misidentified τ
had-visin the t¯
t → µτ
had+ X
control region, is evaluated by measuring the trigger correction factors after varying the
expected misidentified τ
had-visyield by its uncertainty. These uncertainties are relevant
for background events with leptons misidentified as τ
had-visas well as true τ
hadand signal
JHEP03(2015)088
Sample
Low-mass H
+selection
High-mass H
+selection
True τ
had(embedding method)
2800 ± 60 ± 500
3400 ± 60 ± 400
Misidentified jet → τ
had-vis490 ± 9 ± 80
990 ± 15 ± 160
Misidentified e → τ
had-vis15 ± 3 ±
6
20 ± 2 ±
9
Misidentified µ → τ
had-vis18 ± 3 ±
8
37 ± 5 ±
8
All SM backgrounds
3300 ± 60 ± 500
4400 ± 70 ± 500
Data
3244
4474
H
+(m
H+= 130 GeV)
230 ± 10 ± 40
H
+(m
H+= 250 GeV)
58 ± 1 ±
9
Table 2. Expected event yields after all selection criteria and comparison with 19.5 fb−1 of data. The values shown for the signal correspond to the previously published upper limit on B(t → bH+) × B(H+ → τν) = 0.9% [18] for the low-mass signal point and tan β = 50 in the MSSM mmax
h scenario for the high-mass signal point. The predicted yield for the low-mass signal selection assumes a t¯t cross section of 253 pb. Both the statistical and systematic uncertainties (section5) are shown, in this order.
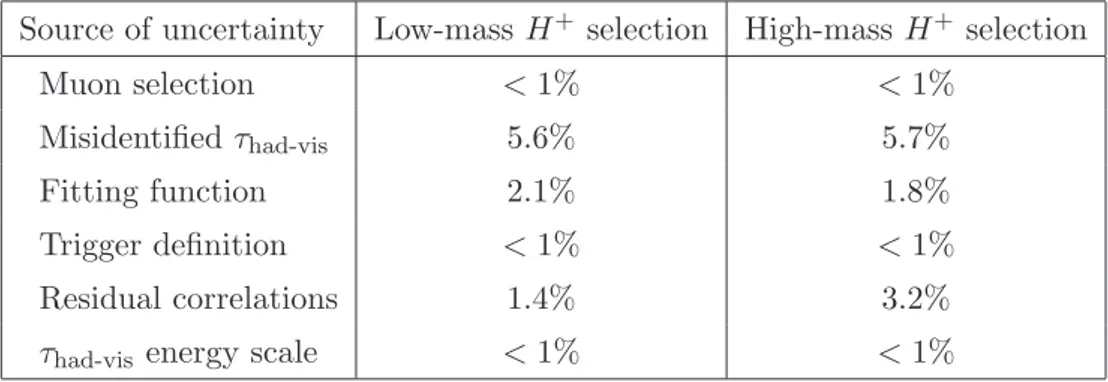
Source of uncertainty
Low-mass H
+selection
High-mass H
+selection
Muon selection
< 1%
< 1%
Misidentified τ
had-vis5.6%
5.7%
Fitting function
2.1%
1.8%
Trigger definition
< 1%
< 1%
Residual correlations
1.4%
3.2%
τ
had-visenergy scale
< 1%
< 1%
Table 3. Effect of systematic uncertainties on the combined trigger efficiencies for a low-mass (mH+= 130 GeV) and high-mass (mH+ = 250 GeV) signal sample.
events. The effects on a low-mass and a high-mass signal sample are summarised in table
3
and the effect on background events with true τ
hadis shown in table
4
. The trigger
correction factors used to account for differences between the efficiencies in simulation and
data are shown in figure
4
.
5.2
Data-driven background estimation
The systematic uncertainties arising from the data-driven methods used to estimate the
various backgrounds are summarised in table
4
.
The systematic uncertainties affecting the estimation of the backgrounds with true
τ
had, discussed in section
4.2
, consist of the potential bias introduced by the embedding
method itself (embedding parameters, evaluated by varying the amount of energy that is
subtracted when removing calorimeter deposits of the muon in the original event),
uncer-tainties from the trigger efficiency measurement as discussed in section
5.1
, uncertainties
JHEP03(2015)088
[GeV] τ T p 30 40 50 60 70 80 90 100trigger correction factor
τ T p 0.7 0.8 0.9 1 1.1 1.2 1.3 τ 1-track Total stat. error Total error
(No res. corr.)
ATLAS ATLAS -1 Ldt = 19.5 fb
∫
= 8 TeV s(a) 1-track τhad-vis, τhad-vistrigger.
[GeV]
τ T
p
30 40 50 60 70 80 90 100
trigger correction factor
τ T p 0.4 0.5 0.6 0.7 0.8 0.9 1 1.1 1.2 1.3 τ 3-track Total stat. error Total error (No res. corr.)
ATLAS ATLAS -1 Ldt = 19.5 fb
∫
= 8 TeV s(b) 3-track τhad-vis, τhad-vistrigger.
[GeV]
miss T
E
100 150 200 250 300
trigger correction factor
miss T E 0.7 0.75 0.8 0.85 0.9 0.95 1 1.05 1.1 τ 1-track Total stat. error Total error (No res. corr.)
ATLAS ATLAS -1 Ldt = 19.5 fb
∫
= 8 TeV s(c) 1-track τhad-vis, EmissT trigger.
[GeV]
miss T
E
100 150 200 250 300
trigger correction factor
miss T E 0.7 0.75 0.8 0.85 0.9 0.95 1 1.05 1.1 1.15 1.2 τ 3-track Total stat. error Total error (No res. corr.)
ATLAS ATLAS -1 Ldt = 19.5 fb
∫
= 8 TeV s(d) 3-track τhad-vis, ETmisstrigger.
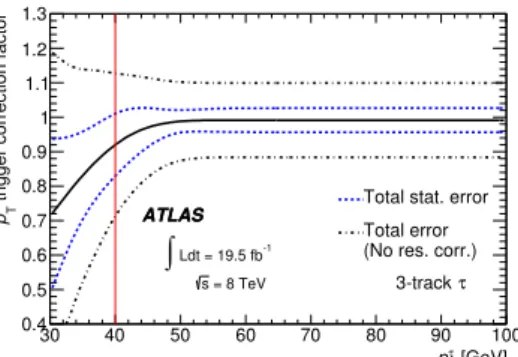
Figure 4. Inclusive τhad-visand Emiss
T trigger correction factors obtained from the ratio of functions fitted to data and simulation for τhad-viswith (a, c) one and (b, d) three charged tracks are shown at the top and bottom, respectively. The vertical line on the τhad-vis trigger correction factor plots indicates the lowest pτ
T threshold used in the analysis. The vertical line on the ETmiss trigger correction factor plots shows the lower boundary used in the high-mass charged Higgs boson search. The total statistical uncertainty is indicated with the dotted line and the systematic uncertainty is added in quadrature to the statistical error (dashed-dotted line). For τhad-vistrigger efficiencies, the total systematic uncertainty is shown, while for the Emiss
T trigger efficiency, the systematic uncertainty related to residual correlations between τhad-vis and Emiss
T is not included, since the effect is evaluated separately for several signal mass ranges and background samples.
due to a possible contamination from multi-jet events (evaluated by varying the muon
iso-lation requirements), uncertainties associated with the simulated τ
had(τ
had-visenergy scale
and identification efficiency) and uncertainties on the normalisation. The latter are
dom-inated by the statistical uncertainty of the selected control sample and the τ
had-vis+E
Tmisstrigger efficiency uncertainties.
For the estimation of backgrounds with jets misidentified as τ
had-vis, discussed in
sec-tion
4.3
, the dominant systematic uncertainties on the misidentification probability are the
statistical uncertainty due to the control sample size and uncertainties due to the difference
in the jet composition (gluon- or quark-initiated) between the control and signal regions.
The uncertainty arising from differences in jet composition is evaluated from the difference
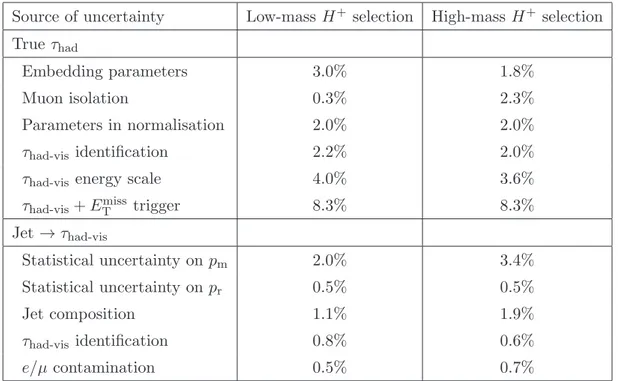
JHEP03(2015)088
Source of uncertainty
Low-mass H
+selection
High-mass H
+selection
True τ
hadEmbedding parameters
3.0%
1.8%
Muon isolation
0.3%
2.3%
Parameters in normalisation
2.0%
2.0%
τ
had-visidentification
2.2%
2.0%
τ
had-visenergy scale
4.0%
3.6%
τ
had-vis+ E
Tmisstrigger
8.3%
8.3%
Jet → τ
had-visStatistical uncertainty on p
m2.0%
3.4%
Statistical uncertainty on p
r0.5%
0.5%
Jet composition
1.1%
1.9%
τ
had-visidentification
0.8%
0.6%
e/µ contamination
0.5%
0.7%
Table 4. Dominant systematic uncertainties on the data-driven background estimates. The shift in event yield is given relative to the total background.
enriched in events with gluon-initiated jets. This control region differs from the signal
region only by inverting the b-tag and E
Tmissrequirements. Other uncertainties are due to
the statistical uncertainty on p
r, the effect of the uncertainty in the simulated true τ
had-visidentification efficiency on the measurement of p
rand p
m, and the effect of the simulated
electron veto efficiency for true electrons on the measurement of p
m.
5.3
Detector simulation
Systematic uncertainties originating from the simulation of pile-up and object
reconstruc-tion are considered for signal events and background events with leptons misidentified as
τ
had-vis. This background is roughly 1% of the final background in both the low-mass and
high-mass searches, so the systematic uncertainties have little effect on the final results.
Uncertainties related to the τ
had-visenergy scale and identification efficiency are also
taken into account. The uncertainty on the identification is in the range 2−3% for τ
had-viswith one charged track and 3−5% for τ
had-viswith three charged tracks. It has been
measured in data using a tag-and-probe method [
54
]. The τ
had-visenergy scale is measured
with a precision of 2−4% [
67
]. It is determined by fitting the reconstructed visible mass
of Z → ττ events in data. Uncertainties related to jet or b-tagged jet energy scale, energy
resolution, flavour identification and calibration, and the effects of pile-up interactions are
also taken into account [
68
,
69
], as well as uncertainties related to the reconstruction of
E
Tmiss[
70
].
The impact of most sources of systematic uncertainty is assessed by re-applying the
selection cuts for each analysis after varying a particular parameter by its ±1 standard
JHEP03(2015)088
deviation uncertainty. The dominant instrumental systematic uncertainties include the jet
energy scale, the τ
had-visenergy scale, and τ
had-visidentification. All instrumental
system-atic uncertainties are taken into account for the reconstruction of E
missT
.
These uncertainties affect all simulated samples, i.e. the signal and the background
contribution with leptons misidentified as τ
had-vis. Since the τ
hadin the embedded samples
are simulated, all τ
had-related uncertainties are relevant for the background with true τ
hadas well.
5.4
Generation of t¯
t
and signal events
In order to estimate the systematic uncertainties arising from the t¯
t and low-mass signal
generation, as well as from the parton shower model, the acceptance is computed for t¯
t
events produced with MC@NLO interfaced to HERWIG/JIMMY and POWHEG
inter-faced to PYTHIA 8. Also, an uncertainty on the theoretical cross section, including both
the factorisation/renormalisation scale and parton distribution function uncertainties, is
taken into account for t¯
t backgrounds with a lepton misidentified as a τ
had-visand low-mass
signal samples. The estimate of the small background with electrons or muons
misiden-tified as τ
had-visrelies additionally on the theoretical inclusive t¯
t production cross section
σ
t¯t= 253
+13−15pb [
30
].
The generator modelling uncertainties for the high-mass signal samples are estimated
from a comparison between events produced with MC@NLO interfaced to HERWIG++ [
71
]
and POWHEG interfaced to PYTHIA 8.
The systematic uncertainties originating from initial- and final-state parton radiation,
which modify the jet production rate, are computed for t¯
t backgrounds and applied to
low-mass signal events by using t¯
t samples generated with AcerMC interfaced to PYTHIA 6,
where initial- and final-state radiation parameters are set to a range of values not excluded
by the experimental data [
72
]. The largest relative differences with respect to the reference
sample, after full event selections, are used as systematic uncertainties. For high-mass
signal samples, this uncertainty is evaluated by varying factorisation/renormalisation scale
parameters in the production of signal samples (QCD scale). The uncertainty due to
the choice of parton distribution function has a negligible impact for both background
and signal, and is not included. An additional uncertainty, arising from the difference
in acceptance between 4FS and 5FS H
+production is evaluated using dedicated signal
samples that are generated at leading order with MadGraph [
73
] interfaced with PYTHIA 8,
although the nominal signal samples are generated at NLO. The systematic uncertainties
arising from the modelling of the t¯
t and signal event generation and the parton shower, as
well as from the initial- and final-state radiation, are summarised in table
5
.
All of these uncertainties, except for H
+production, affect only signal and background
events where leptons are misidentified as τ
had-vis.
6
Statistical analysis
In order to test the compatibility of the data with background-only and signal+background
hypotheses, a profile log-likelihood ratio [
74
] is used with m
Tas the discriminating
vari-JHEP03(2015)088
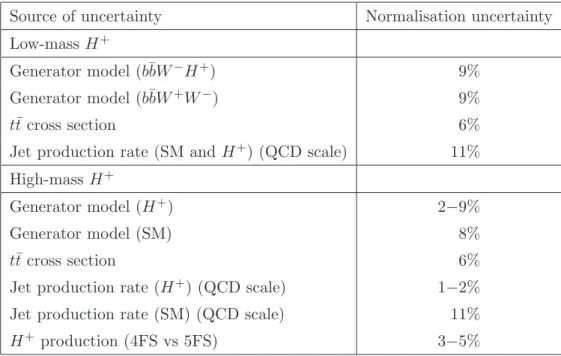
Source of uncertainty
Normalisation uncertainty
Low-mass H
+Generator model (b¯bW
−H
+)
9%
Generator model (b¯bW
+W
−)
9%
t¯
t cross section
6%
Jet production rate (SM and H
+) (QCD scale)
11%
High-mass H
+Generator model (H
+)
2−9%
Generator model (SM)
8%
t¯
t cross section
6%
Jet production rate (H
+) (QCD scale)
1−2%
Jet production rate (SM) (QCD scale)
11%
H
+production (4FS vs 5FS)
3−5%
Table 5. Systematic uncertainties arising from t¯t and signal generator modelling, and from the jet production rate. The uncertainties are shown for the t¯t background and the charged Higgs boson signal, for the low-mass and high-mass charged Higgs boson selections separately. The systematic uncertainty of the H+ yield due to QCD scale and 4FS vs 5FS production was evaluated at masses of 200, 400, and 600 GeV. For all other systematic variations of the H+yield, all mass points were considered.
able. The statistical analysis is based on a binned likelihood function for these
distribu-tions. Systematic uncertainties in shape and normalisation, discussed in section
5
, are
incorporated via nuisance parameters fully correlated amongst the different backgrounds,
and the one-sided profile likelihood ratio, ˜
q
µ, is used as a test statistic. The parameter of
interest, the signal-strength µ, is either B(t → bH
+) × B(H
+→ τ
+ν) (low-mass search) or
σ(pp → ¯tH
++ X) × B(H
+→ τ
+ν) (high-mass search). Expected limits are derived using
the asymptotic approximation [
75
].
The nuisance parameters are simultaneously fitted by means of a negative log-likelihood
minimisation in both low-mass and high-mass regions in order to ensure that they are well
estimated. This is shown in figure
5
for the nuisance parameters that have the largest
impact on the fitted µ, denoted ˆ
µ. The black dots indicate how a given nuisance parameter
deviates from expectation, while the black error bars indicate how its post-fit uncertainty
compares with its nominal uncertainty. In both the low-mass and high-mass searches, the
black dots and error bars indicate respectively that none of the nuisance parameters deviate
by more than one standard deviation and that their uncertainties are not underestimated.
The blue hatched box shows the deviations of the fitted signal-strength parameter after
changing a specific nuisance parameter upwards or downwards by its post-fit uncertainty.
The results in figure
5
indicate the relative impact of the systematic uncertainties in
the statistical analysis of the low-mass and high-mass searches. For the low-mass search,
JHEP03(2015)088
-2 -1 0 1 2 jet composition Multi-jet fit of tail Multi-jet parameters Embedding ) had-vis 3 track τ ( m stat. uncer. p Multi-jet ) had-vis 1 track τ ( m stat. uncer. p Multi-jet identification had-vis τ had-vis τ mis-ID Trigger muon isolation Embedding energy scale had-vis τ residual correlations Trigger tot µ ∆ / µ ∆ -0.4 -0.2 0 0.2 0.4 θ ∆ )/ 0 θ - θ ( -2 -1 0 1 2 Pull µ Post−fit Impact on ATLAS = 8 TeV s -1 Ldt = 19.5 fb ∫ =130 GeV H+ m(a) Low-mass H+ selection.
-2 -1.5 -1 -0.5 0 0.5 1 1.5 data statistics Trigger fitting function Trigger generator model Theory energy scale had-vis τ muon isolation Embedding fit of tail Multi-jet identification had-vis τ ) had-vis 3 track τ ( m stat. uncer. p Multi-jet ) had-vis 1 track τ ( m stat. uncer. p Multi-jet jet composition Multi-jet tot µ ∆ / µ ∆ -1 -0.5 0 0.5 1 θ ∆ )/ 0 θ - θ ( -2 -1 0 1 2 Pull µ Post−fit Impact on ATLAS = 8 TeV s -1 Ldt = 19.5 fb ∫ =250 GeV H+ m (b) High-mass H+selection.
Figure 5. Impact of systematic uncertainties on the final observed limits for (a) mH+ = 130 GeV
and (b) mH+ = 250 GeV. The systematic uncertainties are ordered (top to bottom) by decreasing
impact on the fitted signal strength parameter. The dots, which refer to the bottom horizontal axis, show how each fitted nuisance parameter, ˆθ, deviates from its nominal value, θ0, in terms of standard deviations with respect to its nominal uncertainty, ∆θ. The solid lines indicate the post-fit uncertainties of each nuisance parameter, also relative to their nominal values. The hatched band, referring to the top horizontal axis, shows the deviations of the fitted signal-strength parameter after changing a specific nuisance parameter upwards or downwards by its post-fit uncertainty (∆ˆµ) as a fraction of the total uncertainty of the fitted signal-strength parameter (∆ˆµtot).
the most important systematic uncertainties are those related to the measurement of the
trigger efficiency and to the simulation of the detector response to τ
had-vis. Since the
low-mass search is dominated by the presence of backgrounds with a true τ
had, this is consistent
with expectations. For the high-mass search, the most important systematic uncertainties
are due to jets misidentified as τ
had-vis, including both the yield and m
Tdistribution of
such events, and the next dominant effect is from the true τ
had-visbackground.
7
Results
In figure
6
, the m
Tdistribution after the final fit is shown. No significant deviation of the
data from the SM prediction is observed. For the low-mass charged Higgs boson search,
exclusion limits are set on the branching ratio B(t → bH
+) × B(H
+→ τ
+ν). For the
JHEP03(2015)088
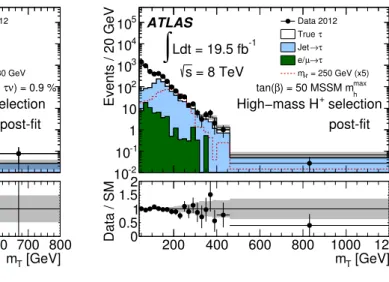
[GeV] T m Events / 20 GeV -2 10 -1 10 1 10 2 10 3 10 4 10 5 10 Data 2012 τ True τ → Jet τ → µ e/ = 130 GeV + H m ATLAS -1 Ldt = 19.5 fb∫
= 8 TeV s selection + Low-mass H ) = 0.9 % ν τ → + B(H × ) + bH → B(t post-fit [GeV] T m 100 200 300 400 500 600 700 800 Data / SM 00.5 1 1.52(a) Low-mass H+ selection.
[GeV] T m Events / 20 GeV -2 10 -1 10 1 10 2 10 3 10 4 10 5 10 Data 2012 τ True τ → Jet τ → µ e/ = 250 GeV (x5) + H m ATLAS -1 Ldt = 19.5 fb
∫
= 8 TeV s selection + High−mass H max h ) = 50 MSSM m β tan( post-fit [GeV] T m 200 400 600 800 1000 1200 Data / SM0.50 1 1.52 (b) High-mass H+ selection.Figure 6. Distributions of mT after all selection criteria. The hatched area shows the total post-fit uncertainty for the SM backgrounds. For the (a) low-mass selection, bins are 20 GeV wide up to mT = 320 GeV, then 320–540 GeV and > 540 GeV. For the (b) high-mass selection, bins are 20 GeV wide up to mT = 400 GeV, then 400–460 GeV and > 460 GeV. All bins are normalised to a 20 GeV bin width. For the low-mass search (a), a possible signal contribution with mH+ = 130 GeV, and B(t → bH+) × B(H+→ τ+ν) = 0.9% is overlaid on top of the SM
contributions. For the high-mass search (b), a possible signal contribution with mH+ = 250 GeV
and tan β = 50 in the mmax
h scenario of the MSSM, where the corresponding cross section [77] is scaled up by a factor of five, is overlaid on the SM contributions.
are to be understood as applying to the total production cross section times branching
ratio of H
+and H
−combined. Using the binned log-likelihood described in section
6
, all
exclusion limits are set by rejecting the signal hypothesis at the 95% confidence level (CL)
using the CL
sprocedure [
76
]. These limits are based on the asymptotic distribution of
the test statistic [
75
]. The exclusion limits are shown in figure
7a
for the low-mass search
and in figure
7b
for the high-mass search. Expected and observed limits agree well and
are within the uncertainties over the whole investigated mass range. The limits are in the
range between 1.3% and 0.23% for the low-mass search. For the high-mass search, they
range from 0.76 pb to 4.5 fb in the mass range 180 GeV ≤ m
H+≤ 1000 GeV.
The limits on B(t → bH
+) × B(H
+→ τ
+ν) for the low-mass search and on σ(pp →
¯
tH
++ X) × B(H
+→ τ
+ν) for the high-mass search are also interpreted in the context
of different scenarios of the MSSM [
42
]. In the m
maxhscenario, the mass of the light
CP-even Higgs boson h (m
h) is maximised. Interpreting the Higgs boson discovered at the
LHC as the h, only a small region of the m
H+− tan β parameter space in this scenario
is compatible with the observation. The m
mod+hand m
mod−hscenarios are modifications of
the m
maxh
scenario. The discovered Higgs boson is interpreted as the h as well but the
requirement that m
hbe maximal is dropped. This is done by reducing the amount of
mixing in the top squark sector compared to the m
maxh