JHEP03(2016)127
Published for SISSA by SpringerReceived: December 14, 2015 Revised: February 1, 2016 Accepted: February 2, 2016 Published: March 17, 2016
Search for charged Higgs bosons in the H
±
→ tb
decay channel in pp collisions at
√
s = 8 TeV using
the ATLAS detector
The ATLAS collaboration
E-mail:
atlas.publications@cern.ch
Abstract:
Charged Higgs bosons heavier than the top quark and decaying via H
±→
tb are searched for in proton-proton collisions measured with the ATLAS experiment at
√
s = 8 TeV corresponding to an integrated luminosity of 20.3 fb
−1. The production of a
charged Higgs boson in association with a top quark, gb → tH
±, is explored in the mass
range 200 to 600 GeV using multi-jet final states with one electron or muon. In order to
separate the signal from the Standard Model background, analysis techniques combining
several kinematic variables are employed. An excess of events above the
background-only hypothesis is observed across a wide mass range, amounting to up to 2.4 standard
deviations. Upper limits are set on the gb → tH
±production cross section times the
branching fraction BR(H
±→ tb). Additionally, the complementary s-channel production,
→ H
±, is investigated through a reinterpretation of W
0→ tb searches in ATLAS. Final
states with one electron or muon are relevant for H
±masses from 0.4 to 2.0 TeV, whereas
the all-hadronic final state covers the range 1.5 to 3.0 TeV. In these search channels, no
significant excesses from the predictions of the Standard Model are observed, and upper
limits are placed on the qq
0→ H
±production cross section times the branching fraction
BR(H
±→ tb).
Keywords: Hadron-Hadron scattering, Higgs physics
JHEP03(2016)127
Contents
1
Introduction
1
2
Data and simulated events
3
2.1
ATLAS detector and data sample
3
2.2
Background and signal modelling
3
3
Object reconstruction and identification
6
4
Search for a charged Higgs boson in association with a top quark
8
4.1
Event selection and categorisation
8
4.2
Analysis strategy
8
4.3
Systematic uncertainties
10
4.4
Results
13
5
Search for a charged Higgs boson produced in the s-channel
18
5.1
Lepton+jets final state
18
5.2
All-hadronic final state
19
5.3
Results and interpretations
21
6
Conclusions
22
The ATLAS collaboration
31
1
Introduction
The discovery of a neutral scalar particle H at the Large Hadron Collider (LHC) in
2012 [
1
,
2
], with a measured mass of 125.09 ± 0.21(stat.) ± 0.11(syst.) GeV [
3
], raises the
question of whether this new particle is the Higgs boson of the Standard Model (SM) or one
physical state of an extended Higgs sector. The observation of a heavy charged scalar
par-ticle would clearly indicate physics beyond the SM. Charged Higgs bosons
1are predicted
by several non-minimal Higgs scenarios, such as two-Higgs-doublet Models (2HDM) [
4
] and
models containing Higgs triplets [
5
–
9
].
The production mechanisms and decay modes of a charged Higgs boson depend on
its mass, m
H+. For light charged Higgs bosons (m
H+. m
top, where m
topis the
top-quark mass), the primary production mechanism is through the decay of a top top-quark,
t → bH
+. For m
H+
> m
top, the dominant H
+production mode at the LHC is expected
to be in association with a top quark, as illustrated by the left-hand and central plots
1In the following, charged Higgs bosons are denoted H+, with the charge-conjugate H−always implied. Similarly, generic quark symbols are used for q and ¯q.
JHEP03(2016)127
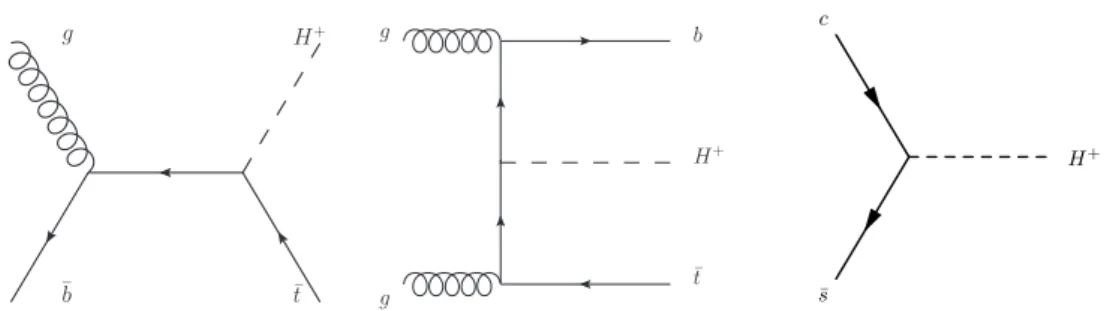
H+ g ¯b ¯t g g b H+ ¯ t ¯ s c H+Figure 1. Leading-order Feynman diagrams for the production of a charged Higgs boson with a mass mH+ > mtop, in association with a top quark (left in the 5FS, and centre in the 4FS) and in
the s-channel (right).
of figure
1
. When calculating the corresponding cross section in a four-flavour scheme
(4FS), quarks are dynamically produced, whereas in a five-flavour scheme (5FS), the
b-quark is also considered as an active flavour inside the proton. The 4FS and 5FS cross
sections are averaged according to ref. [
10
]. In the 2HDM, the production and decay of the
charged Higgs boson also depend on the parameter tan β, defined as the ratio of the vacuum
expectation values of the two Higgs doublets, and the mixing angle α between the CP-even
Higgs bosons. For m
H+> m
topand in the case of cos(β − α) ≈ 0, the dominant decay
is H
+→ tb, with a substantial contribution from H
+→ τ ν for large values of tan β [
11
].
A complementary H
+production mode, shown in the right-hand plot of figure
1
, is the
s-channel process, qq
0→ H
+.
The LEP experiments placed upper limits on the production of H
+in the mass range
of 40–100 GeV [
12
], and the Tevatron experiments set upper limits on BR(t → bH
+) for
m
H+in the range 80–150 GeV [
13
,
14
]. The D0 experiment also searched for a charged
Higgs boson with a mass in the range 180–300 GeV using the H
+→ tb decay channel [
15
].
Light charged Higgs bosons have been searched for in the τ ν decay mode at the LHC by
CMS (2 fb
−1,
√
s = 7 TeV [
16
]) and ATLAS (4.7 fb
−1,
√
s = 7 TeV [
17
,
18
]). Searches for
charged Higgs bosons were also performed in proton-proton (pp) collisions at
√
s = 8 TeV,
by ATLAS using the τ ν decay mode [
19
] and by CMS using final states originating from
both the τ ν and tb decay modes [
20
]. CMS set an upper limit of 2.0–0.13 pb on the
production cross section times branching fraction for H
+→ tb in the mass range 180–
600 GeV. Vector-boson-fusion H
+production was also searched for by ATLAS using the
W Z final state [
21
]. No evidence for a charged Higgs boson was found in any of these
searches.
This paper describes searches for charged Higgs bosons decaying into tb. In the H
+mass range of 200–600 GeV, the production mode in association with a top quark is
stud-ied. The 5FS process is generated. Cross sections averaging 4FS and 5FS are used for
model-dependent predictions. The search is based on selecting two top quarks, with their
decays producing one charged lepton (electron or muon), and at least one additional jet
containing a b-flavoured hadron. In the complementary s-channel production mode, H
+masses between 0.4 and 2.0 TeV are explored in a final state containing one charged lepton
and jets (referred to as lepton+jets in the following), while the all-hadronic final state is
JHEP03(2016)127
used for very high H
+masses, 1.5 to 3.0 TeV, with a jet substructure technique to
re-construct the top-quark decay products in one single large-radius jet. The two s-channel
analyses are reinterpretations of recent searches for W
0→ tb in ATLAS [
22
,
23
]. Based
on dedicated simulations of the H
+→ tb signal and a reinterpretation of the data, upper
limits are derived for the s-channel production of a charged scalar particle decaying to tb.
The paper is organised as follows. Section
2
describes briefly the ATLAS detector,
then summarises the data and the samples of simulated events used for the analyses.
Section
3
describes the reconstruction of objects in ATLAS. Section
4
presents the event
selection and analysis strategy of the search for H
+→ tb produced in association with
a top quark. Systematic uncertainties are also discussed, before exclusion limits in terms
of cross section times branching fraction are presented, together with their interpretation
in benchmark scenarios of the Minimal Supersymmetric Standard Model (MSSM) [
24
–
28
].
The reinterpretations of W
0→ tb analyses as searches for the production of H
+→ tb in the
s-channel, including a discussion of the H
+signal shapes and uncertainties, are presented
in section
5
. Finally, a summary is given in section
6
.
2
Data and simulated events
2.1
ATLAS detector and data sample
The ATLAS detector [
29
] consists of an inner tracking system with coverage in
pseudora-pidity
2up to |η| = 2.5, surrounded by a thin 2 T superconducting solenoid, a calorimeter
system extending up to |η| = 4.9 and a muon spectrometer extending up to |η| = 2.7
that measures the deflection of muon tracks in the field of three superconducting toroid
magnets. A three-level trigger system is used to select events of interest. The first-level
trigger (L1) is implemented in hardware, using a subset of detector information to reduce
the event rate to no more than 75 kHz. This is followed by two software-based trigger levels
(L2 and EF), which together further reduce the event rate to less than 400 Hz.
Stringent data-quality requirements are applied, resulting in an integrated luminosity
of 20.3 fb
−1for the 2012 data-taking period. The integrated luminosity has an uncertainty
of 2.8%, measured following the methodology described in ref. [
30
]. Events are required to
have a primary vertex with at least five associated tracks, each with a transverse momentum
p
Tgreater than 400 MeV. If an event has more than one reconstructed vertex satisfying
these criteria, the primary vertex is defined as the reconstructed vertex with the largest
sum of squared track transverse momenta.
2.2
Background and signal modelling
The background processes for the searches in this paper include SM pair production of top
quarks (with additional jets, or in association with a vector boson V = W, Z or the SM
2
ATLAS uses a right-handed coordinate system with its origin at the nominal interaction point (IP) in the centre of the detector and the z-axis along the beam pipe. The x-axis points from the IP to the centre of the LHC ring, and the y-axis points upwards. Cylindrical coordinates (r, φ) are used in the transverse plane, φ being the azimuthal angle around the z-axis. The pseudorapidity is defined in terms of the polar angle θ as η = − ln tan(θ/2).
JHEP03(2016)127
Higgs boson), as well as the production of single-top-quark, W +jets, Z/γ
∗+jets, diboson
(W W/W Z/ZZ) and multi-jet events. The dominant background is the production of t¯
t
pairs with additional jets in the final state.
In the analyses with an electron or a muon in the final state, all backgrounds are taken
from simulation, except for the multi-jet events. These mostly contribute via the presence
of a non-prompt electron or muon, e.g. from a semileptonic b- or c-flavoured hadron decay,
or through the misidentification of a jet. The normalisation of the multi-jet events and
the shape of the relevant distributions are determined with a data-driven technique known
as the matrix method [
31
]. In the search for H
+→ tb in the s-channel production mode
with an all-hadronic final state, all backgrounds are estimated using a data-driven method
based on a combined fit to the data under the SM background plus H
+signal hypothesis.
The modelling of t¯
t events is performed with Powheg-Box v2.0 [
32
,
33
], using the
CT10 [
34
,
35
] parton distribution function (PDF) set. It is interfaced to Pythia v6.425 [
36
],
with the Perugia P2011C [
37
] set of tuned parameters (tune) for the underlying event.
The t¯
t cross section at 8 TeV is σ
t¯t= 253
+13−15
pb for a top-quark mass of 172.5 GeV. It
is calculated at next-to-next-to-leading order (NNLO) in QCD including resummation of
next-to-next-to-leading logarithmic (NNLL) soft gluon terms with Top++ v2.0 [
38
–
44
].
In the search for H
+production in association with a top quark, simulated t¯
t events
are classified according to their flavour content at parton level, using the same methodology
as in ref. [
45
]. Events are labelled as t¯
t+b¯b if they contain at least one particle jet that is
matched to a b-flavoured hadron not originating from the decay of the t¯
t system. Events
where at least one particle jet is matched to a c-flavoured hadron, and not already labelled
as t¯
t+b¯b, are labelled as t¯
t+c¯
c. Events labelled as either t¯
t+b¯b or t¯
t+c¯
c are generically
referred to as t¯
t+heavy-flavour (HF) events. The remaining events, including those with
no additional jets, are labelled as t¯
t+light-flavour (LF). In the following, a sequential
reweighting is applied at the generator level for all t¯
t+LF and t¯
t+c¯
c events produced with
Powheg+Pythia. Two correction factors are used, based on the values of the transverse
momenta of the top quark and the t¯
t system, taking the correlation between these two
parameters into account. This reweighting procedure was originally implemented in order
to match simulation to data in the measurement of top-quark-pair differential cross sections
at
√
s = 7 TeV [
46
]. It was verified that this procedure is also reasonable at
√
s = 8 TeV.
The t¯
t+b¯b component is reweighted to match the NLO theory calculation provided within
Sherpa with the OpenLoops framework [
47
,
48
]. For this reweighting, the same settings
as in ref. [
45
] are used in this paper. The reweighting is performed at the generator level
using several kinematic variables such as the transverse momenta of the top quark, the t¯
t
system and the dijet system not coming from the top-quark decay, as well as the distance
3∆R
jjbetween these two jets. For systematic studies, an alternative t¯
t+jets sample is
generated with the Madgraph5 v1.5.11 LO generator [
49
], using the CT10 PDF set and
interfaced to Pythia v6.425 for parton shower and fragmentation.
Samples of t¯
tV events are generated using Madgraph5 v1.3.33, with the CTEQ6L1 [
50
]
PDF, interfaced to Pythia v6.425 for the showering and hadronisation, with the AUET2B
3∆R =p(∆η)2+ (∆φ)2, where ∆η is the difference in pseudorapidity of the two objects in question, and ∆φ is the difference between their azimuthal angles.
JHEP03(2016)127
underlying-event tune [
51
]. They are normalised to the next-to-leading-order (NLO) cross
section [
52
,
53
].
Single-top-quark production in the s- and W t-channels are simulated with
Powheg-Box v2.0, using the CT10 PDF, interfaced to Pythia v6.425 with the underlying-event
tune P2011C. The same procedure is used for the single-top-quark production in the
t-channel, except in the search for qq
0→ H
+→ tb in the lepton+jets final state, where the
leading-order (LO) generator AcerMC v3.8 [
54
] with the CTEQ6L1 PDF, interfaced to
Pythia v6.425 with the underlying-event tune P2011C, is used instead. Overlaps between
the t¯
t and W t final states are handled using inclusive diagram removal [
55
]. The
single-top-quark samples are normalised to the approximate NNLO theoretical cross sections [
56
–
58
]
using the MSTW2008 NNLO [
59
–
61
] PDF.
Samples of W/Z+jets events are generated using the Alpgen v2.14 [
62
] generator, with
the CTEQ6L1 PDF, interfaced to Pythia v6.425 with the underlying-event tune P2011C.
The W +jets events are generated with up to five additional partons, separately for the
W +LF, W b¯b+jets, W c¯
c+jets and W c+jets processes. Similarly, the Z+jets background is
generated with up to five additional partons separated in different flavours. The samples
of W/Z+jets events are normalised to the inclusive NNLO theoretical cross sections [
63
].
Finally, the W/Z+jets events are reweighted to account for differences in the W/Z p
Tspectrum between data and simulation [
64
].
In the searches for H
+→ tb with a lepton+jets final state, diboson events are generated
with the requirement of having at least one boson decaying leptonically. Alpgen v2.14 is
used, with the CTEQ6L1 PDF, and it is interfaced to Herwig v6.520 [
65
] for showering
and hadronisation, together with Jimmy v4.31 [
66
] for the underlying event, using the
AUET2 tune [
67
]. The diboson backgrounds are normalised to the production cross sections
calculated at NLO [
68
].
The production of the SM Higgs boson in association with a top-quark pair (t¯
tH) is
modelled using NLO matrix elements obtained from the HELAC-Oneloop package [
69
].
Powheg-Box is used as an interface to shower simulation programs. The samples created
using this approach are referred to as PowHel samples [
70
]. They are inclusive in Higgs
boson decays and are produced for a Higgs boson mass of 125 GeV, using the CT10 PDF,
and interfaced to Pythia v8.1 [
71
] with the AU2 underlying-event tune [
72
]. As in the
generation of t¯
t background events, the top-quark mass is set to 172.5 GeV. The t¯
tH cross
section and the decay branching fractions of the Higgs boson are taken from the (N)NLO
theoretical calculations collected in ref. [
73
].
In the search for H
+produced in association with a top quark, signal samples are
generated with Powheg-Box, using the CT10 PDF, interfaced to Pythia v8.1 with the
AU2 underlying-event tune. For the m
H+range of 200–300 GeV, the samples are produced
in steps of 25 GeV, then in intervals of 50 GeV up to 600 GeV. The samples are generated
at NLO using the 5FS and with a zero width for H
+.
In the search for H
+in the s-channel, signal events are generated using Madgraph5
v1.5.12, with the CTEQ6L1 PDF, interfaced to Pythia v8.1 with the AU2
underlying-event tune, for both the lepton+jets and all-hadronic final states. In the former (latter)
JHEP03(2016)127
and 3.0 TeV). A narrow-width approximation is used for both final states. This is justified
as the experimental resolution is much larger than the H
+natural width.
In all background simulations, Tauola v1.20 [
74
] is used for the τ decays and
Pho-tos v2.15 [
75
] is employed for photon radiation from charged leptons. For the signal
simulations, Photos++ v3.51 [
76
] is used. All signal and background events are overlaid
with additional minimum-bias events generated using Pythia v8.1 with the MSTW2008
LO PDF and the AUET2 underlying-event tune, in order to simulate the effect of multiple
pp collisions per bunch crossing (pile-up). Finally, all background samples and all-hadronic
signal samples are processed through a simulation [
77
] of the detector geometry and
re-sponse using Geant4 [
78
]. The signal samples with leptons in the final state are passed
through a fast simulation of the calorimeter response [
79
]. All samples from simulation are
processed through the same reconstruction software as the data.
3
Object reconstruction and identification
The main objects used for the searches reported in this paper are electrons, muons, jets
(possibly identified as originating from b-quarks), and missing transverse momentum. A
brief summary of the main reconstruction and identification criteria used for each of these
objects is given below.
Electron candidates [
80
] are reconstructed from energy deposits (clusters) in the
elec-tromagnetic calorimeter which are associated with a reconstructed track in the inner
de-tector system. Their transverse energy, E
T= E
clus/cosh(η
track), is computed using the
electromagnetic cluster energy E
clusand the direction of the electron track η
track, and is
required to exceed 25 GeV. The pseudorapidity range for the electromagnetic cluster covers
the fiducial volume of the detector, |η| < 2.47 (the transition region between the barrel and
end-cap calorimeters, 1.37 < |η| < 1.52, is excluded). The longitudinal impact parameter
|z
0| of the electron track relative to the primary vertex must be smaller than 2 mm. In
or-der to reduce the contamination from misidentified hadrons, electrons from heavy-flavour
decays and photon conversions, the electron candidates are also required to satisfy E
T-and η-dependent calorimeter (-and tracker) isolation requirements imposed in a cone with
a fixed size ∆R = 0.2 (0.3) around the electron position.
Muon candidates are reconstructed from track segments in the muon spectrometer, and
matched with tracks found in the inner detector system [
81
]. The final muon candidates
are refitted using the complete track information from both detector systems, and they are
required to satisfy p
T> 25 GeV, |η| < 2.5 and |z
0| < 2 mm. Furthermore, muons must
fulfil a p
T-dependent track-based isolation requirement that has good performance under
high pile-up conditions and/or when the muon is close to a jet. For that purpose, the scalar
sum of the track p
Tin a cone of a variable size, defined by ∆R = 10 GeV/p
T, around the
muon position (while excluding the muon track itself) must be less than 5% of the muon
transverse momentum.
Jets are reconstructed from topological energy clusters [
82
] in the calorimeters, using
the anti-k
talgorithm [
83
,
84
]. Two radius parameters are used, R = 0.4 (’small-radius
recon-JHEP03(2016)127
structing high-p
Ttop quarks as single objects in the search for H
+→ tb produced in the
s-channel and decaying into an all-hadronic final state, as described below. When no jet
type is specified, small-radius jets are implied. Small- and large-radius jets are calibrated
using energy- and η-dependent correction factors derived from simulation and with residual
corrections from in situ measurements [
85
]. Only small-radius jets that have p
T> 25 GeV
and |η| < 2.5 are considered in this paper. Jets originating from pile-up interactions are
suppressed by requiring that at least 50% of the scalar sum of the p
Tof the associated
tracks is due to tracks originating from the primary vertex [
86
]. This is referred to as the
jet vertex fraction (JVF) and is only applied to jets with p
T< 50 GeV and |η| < 2.4.
Jets are identified as originating from the hadronisation of a b-quark (b-tagged) via
an algorithm that uses multivariate techniques to combine information from the impact
parameters of displaced tracks with topological properties of secondary and tertiary decay
vertices reconstructed within the jet [
87
]. The nominal working point used here is chosen
to correspond to a 70% efficiency to tag a b-quark jet, with a light-jet mistag rate of 1%
and a c-jet mistag rate of 20%, as determined with b-tagged jets with p
T> 20 GeV and
|η| < 2.5 in simulated t¯
t events. The tagging efficiencies from simulation are corrected
based on the results of flavour-tagging calibrations performed with the data [
88
].
In the search for H
+→ tb produced in the s-channel and decaying into an all-hadronic
final state (section
5.2
), hadronically decaying high-p
Ttop quarks are reconstructed as
single objects through ’top-tagging’. Large-radius jets are used as input to the top-tagger.
In order to minimise the effects of pile-up [
89
], the large-radius jets are trimmed [
90
].
The trimming is performed by reclustering the large-radius jet using the inclusive k
tal-gorithm [
91
] with a jet radius parameter R = 0.3, and by removing soft subjets with a
p
Tsmaller than 5% of the original jet p
T. Trimmed large-radius jets are required to have
p
T> 350 GeV and |η| < 2.0. Large-radius jets are top-tagged if they have a substructure
compatible with a three-prong decay. The top-tagger used in the search of section
5.2
was
developed for the search for W
0→ tb in ATLAS [
23
]. It uses the k
tsplitting scale [
91
]
√
d
12and the N -subjettiness [
92
,
93
] variables τ
21and τ
32. The k
talgorithm clusters the
hardest objects last, which means that a two-body decay (such as t → bW ) typically gets a
larger value of
√
d
12than light jets. The τ
ijdistribution peaks closer to 0 for i-subjet-like
jets and closer to 1 for j-subjet-like jets. The top-tagged jet is required to pass the cuts
√
d
12> 40 GeV, τ
32< 0.65, and 0.4 < τ
21< 0.9, as in the search for W
0→ tb [
23
].
When several selected objects overlap geometrically, the following procedures are
ap-plied. In the searches with a lepton+jets final state, muons are rejected if found to be
∆R < 0.4 from any jet with nominal p
T, η and JVF selections. In order to avoid
double-counting of electrons as jets, the closest jet to an electron is then removed if lying ∆R < 0.2
from an electron. Finally, electrons are rejected if found to be ∆R < 0.4 from any
remain-ing jet with nominal p
T, η and JVF selections. In the search for s-channel production of
H
+→ tb in the all-hadronic final state, large-radius jets are required to be separated by
∆R > 2.0 from the small-radius b-tagged jets used to reconstruct the invariant mass of
H
+candidates. Events with electrons (muons) fulfilling E
T
> 30 GeV (p
T> 30 GeV) are
vetoed in this particular search channel.
The magnitude E
missT
of the missing transverse momentum is reconstructed from the
un-JHEP03(2016)127
matched topological clusters and tracks (collected in a so-called soft term). The E
missT
is
further refined by using object-level corrections for the identified electrons, muons and jets,
and the effects of pile-up in the soft term are mitigated [
94
].
4
Search for a charged Higgs boson in association with a top quark
4.1
Event selection and categorisation
In this section, the search for a charged Higgs boson produced in association with a top
quark, gb → tH
+with H
+→ tb, is described. In the events selected for this analysis,
the top quarks both decay via t → W b, where one W boson decays hadronically and the
other decays into an electron or a muon, either directly or through a τ -lepton decay, and
the corresponding neutrino(s). The signal event signature is therefore characterised by the
presence of exactly one high-p
Tcharged lepton (electron or muon) and five or more jets,
at least three of them being b-tagged.
Events collected using either an isolated or non-isolated single-lepton trigger are
consid-ered. Isolated triggers have a threshold of 24 GeV on p
Tfor muons and on E
Tfor electrons,
while non-isolated triggers have higher thresholds at 36 GeV (muons) and 60 GeV
(elec-trons). The isolated triggers have a loss of efficiency at high p
Tor E
T, which is recovered
by the triggers with higher thresholds. Events accepted by the trigger are then required
to have exactly one identified electron or muon, and at least four jets, of which at least
two must be identified as b-tagged jets. The selected lepton is required to match, with
∆R < 0.15, a lepton reconstructed by the trigger.
At this stage, the samples contain mostly t¯
t events. The selected events are further
categorised into different regions, depending on the number of jets and b-tagged jets. The
categories are inclusive in the lepton flavour. In the following, a given category with m jets,
of which n are b-tagged, is referred to as mj(nb). A total of five independent categories
are considered: four control regions (CR) with little sensitivity to signal, 4j(2b), 5j(2b),
≥6j(2b), 4j(≥3b), and one signal-rich region (SR), ≥5j(≥3b). The CR are used to control
the backgrounds and to constrain systematic uncertainties (section
4.3
). For each category,
the expected event yields of all processes and the number of events observed in the data
are given in table
1
. The dominant background process in every category is t¯
t+LF. In
the signal-rich region, contributions from t¯
t+HF are also sizeable. In all categories except
≥6j(2b), the data exceed the SM prediction, but they are consistent within the large
uncertainties on the background. In table
2
, the expected amount of signal is listed for a
few points of the m
mod−hbenchmark scenario of the MSSM [
95
]. The theoretical predictions
are taken from refs. [
11
,
96
–
98
].
4.2
Analysis strategy
In order to separate the H
+signal from the SM background, and to constrain the large
uncertainties on the background, different discriminants are used depending on the event
category, and are then combined in a binned maximum-likelihood fit. In the four CR,
the discriminating variable is the scalar sum of the p
Tof the selected jets (H
Thad) and
JHEP03(2016)127
Process 4j(2b) 5j(2b) ≥6j(2b) 4j(≥3b) ≥5j(≥3b) t¯t+LF 80 300 ± 9900 38 700 ± 7400 19 300 ± 5300 6300 ± 1000 5600 ± 1600 t¯t+c¯c 5200 ± 2900 4500 ± 2600 3800 ± 2300 740 ± 410 1800 ± 1000 t¯t+b¯b 1720 ± 940 1550 ± 830 1390 ± 820 660 ± 370 2300 ± 1200 t¯tH 33.7 ± 4.6 44.6 ± 5.4 68.9 ± 9.1 15.5 ± 2.5 87 ± 11 t¯tV 128 ± 40 151 ± 47 189 ± 59 17.6 ± 5.7 85 ± 27 Single-top 5020 ± 770 1970 ± 420 880 ± 270 360 ± 83 330 ± 110 W +jets 3400 ± 1700 1270 ± 720 640 ± 400 190 ± 100 170 ± 100 Z+jets 1330 ± 670 400 ± 220 150 ± 95 53 ± 31 49 ± 39 V V 232 ± 69 108 ± 41 52 ± 25 10.7 ± 3.6 13.7 ± 6.0 Multi-jets 2160 ± 870 670 ± 260 330 ± 150 160 ± 67 150 ± 100 Total bkg 100 000 ± 11 000 49 300 ± 8600 27 100 ± 6600 8500 ± 1300 10 600 ± 2500 Data 102 462 51 421 26 948 9102 11 945Table 1. Expected event yields of the SM background processes and observed data in the five categories. The first four columns show the event yields in the CR, the last column shows the event yields in the SR. The uncertainties include statistical and systematic components (systematic uncertainties are discussed in section4.3).
mH+ [GeV] tan β 4j(2b) 5j(2b) ≥6j(2b) 4j(≥3b) ≥5j(≥3b) 200 0.5 2580 ± 420 1670 ± 190 1050 ± 300 730 ± 190 1750 ± 200 0.7 1290 ± 210 834 ± 93 520 ± 150 366 ± 95 880 ± 100 0.9 760 ± 120 493 ± 55 309 ± 88 216 ± 56 518 ± 59 400 0.5 397 ± 69 406 ± 44 390 ± 100 211 ± 56 756 ± 76 0.7 200 ± 35 204 ± 22 197 ± 51 106 ± 28 380 ± 38 0.9 119 ± 21 121 ± 13 117 ± 31 63 ± 17 226 ± 23 600 0.5 71 ± 14 85 ± 12 107 ± 29 36 ± 11 183 ± 23 0.7 34.7 ± 6.9 41.5 ± 5.6 52 ± 14 17.4 ± 5.3 89 ± 11 0.9 19.8 ± 3.9 23.7 ± 3.2 29.8 ± 8.1 10.0 ± 3.0 50.9 ± 6.5 Table 2. Number of expected signal events in the five categories for a few representative points of the mmod−h scenario of the MSSM. The last column shows the event yields in the SR. The expected uncertainties contain statistical and systematic components (systematic uncertainties are discussed in section4.3). Uncertainties on the cross sections and branching fractions for the mmod−h scenario
are not included.
in the SR, the output of a boosted decision tree (BDT) is used. The Toolkit for
Multi-variate Data Analysis (TMVA) [
99
] is used for the training and evaluation of the BDT
responses. The BDT is trained to specifically discriminate the H
+signal from the t¯
t+b¯b
background process. This method reduces correlations and anti-correlations between the
signal normalisation and the parameters connected to the dominant systematic
uncertain-ties, in particular for H
+masses below 350 GeV, where those correlations are sizeable. The
largest correlation at low mass is that between the t¯
t+b¯b cross section and the signal
nor-malisation, which is −50% at 200 GeV. Consequently, this specific BDT is more sensitive
than a BDT trained against the sum of all backgrounds when uncertainties are included.
JHEP03(2016)127
The variables entering the BDT training are:
• the scalar sum of the p
Tof all selected jets (H
Thad),
• the p
Tof the leading jet,
• the invariant mass of the two b-tagged jets that are closest in ∆R,
• the second Fox-Wolfram moment [
100
], calculated from the selected jets,
• the average ∆R between all pairs of b-tagged jets in the event.
Many other kinematic and event shape variables were tested before this set of variables
was selected. The variables listed above provide the best separation between signal and
background across all mass hypotheses. The BDT training is performed independently
for each H
+mass hypothesis, and only for events in the SR. The BDT input variables
were validated in the CR by comparing their distributions in the data and simulation, and
they were further validated by evaluating the BDT responses in the four CR for every
mass point. The data and expected SM backgrounds were found to be compatible at all
times. The statistical analysis was performed after the selection and the BDT training
were finalised.
The pre-fit distributions of H
hadT
in the four control regions are displayed in figure
2
.
Good agreement between data and the SM expectation is found, given the large
uncertain-ties. The pre-fit BDT output distributions for two mass hypotheses are shown in figure
3
.
In the SR, the data exceed the expected background, but they are consistent given the large
uncertainties. The discrimination between signal and background significantly improves for
larger signal masses.
4.3
Systematic uncertainties
Several sources of systematic uncertainty, affecting the normalisation of signal and
back-ground processes or the shape of their distributions, are considered. The individual sources
of systematic uncertainty are assumed to be uncorrelated, but correlations of a given
sys-tematic effect are maintained across categories and processes, when applicable. All
vari-ations, except those from uncertainties on the theoretical cross section, are symmetrised
with respect to the nominal value. The uncertainties arising from the reconstructed objects
and the background modelling, in particular the t¯
t background modelling, receive the same
treatment as in ref. [
45
].
The following uncertainties on the reconstructed objects are considered. The
system-atic uncertainties associated with the electron or muon selection arise from the trigger,
reconstruction and identification efficiency, isolation criteria, as well as from the
momen-tum scale and resolution [
80
,
81
]. In total, the systematic uncertainties associated with
electrons (muons) include five (six) components. The systematic uncertainties associated
with the jet selection arise from the jet energy scale (JES), the JVF requirement, the jet
energy resolution and the jet reconstruction efficiency. Among these, the JES uncertainty
has the largest impact on the search. It is derived by combining information from test-beam
JHEP03(2016)127
Events / 50 GeV 0 5000 10000 15000 20000 25000 30000 Data +LF t t c +c t t b +b t t Other bkg Total unc. xBR=1 pb σ 300 GeV + H 300 GeV shape + H 500 GeV shape + H -1 =8 TeV, 20.3 fb s (tb) + tH → gb 4j(2b) ATLAS Pre-fit [GeV] had T H 0 200 400 600 800 1000 1200 Data/Bkg 0.6 0.8 1 1.2 1.4 Events / 50 GeV 0 2000 4000 6000 8000 10000 12000 14000 Data +LF t t c +c t t b +b t t Other bkg Total unc. xBR=1 pb σ 300 GeV + H 300 GeV shape + H 500 GeV shape + H -1 =8 TeV, 20.3 fb s (tb) + tH → gb 5j(2b) ATLAS Pre-fit [GeV] had T H 0 200 400 600 800 1000 1200 Data/Bkg 0.6 0.8 1 1.2 1.4 (a) (b) Events / 50 GeV 0 1000 2000 3000 4000 5000 xBR=1 pb σ 300 GeV + H 300 GeV shape + H 500 GeV shape + H 300 GeV shape + H 500 GeV shape + H Data tt+LF c +c t t tt+bbOther bkg Total unc.
-1 =8 TeV, 20.3 fb s (tb) + tH → gb 6j(2b) ≥ ATLAS Pre-fit [GeV] had T H 0 200 400 600 800 1000 1200 Data/Bkg 0.6 0.8 1 1.2 1.4 Events / 50 GeV 0 500 1000 1500 2000 2500 3000 Data +LF t t c +c t t b +b t t Other bkg Total unc. xBR=1 pb σ 300 GeV + H 300 GeV shape + H 500 GeV shape + H -1 =8 TeV, 20.3 fb s (tb) + tH → gb 3b) ≥ 4j( ATLAS Pre-fit [GeV] had T H 0 200 400 600 800 1000 1200 Data/Bkg 0.6 0.8 1 1.2 1.4 (c) (d)
Figure 2. Pre-fit distributions of the scalar sum of the pT of all selected jets, HThad, for the
four control regions: (a) 4j(2b), (b) 5j(2b), (c) ≥6j(2b), (d) 4j(≥3b). Each background process is normalised according to its cross section. A signal with mH+= 300 GeV, normalised to a production
cross section times branching fraction for H+ → tb (σ×BR) of 1 pb, is shown in pink, stacked on top
of the background. Two signal shapes are shown superimposed as dashed lines normalised to the data. The last bin includes the overflow. The hatched bands show the pre-fit uncertainties, which are dominated by systematic uncertainties (discussed in section4.3). The lower panels display the ratio of the data to the total predicted background.
data, LHC collision data and simulation [
85
]. The JES uncertainty is split into 22
uncorre-lated sources, which can have different jet p
T- and η-dependencies. Six (four) independent
sources of systematic uncertainty affecting the b(c)-tagging efficiency are considered [
88
].
An additional uncertainty is assigned due to the extrapolation of the measurement of the
b-tagging efficiency to the high-p
Tregion. Twelve uncertainties are considered for the
light-jet mistagging rate, with dependencies on the jet p
Tand η.
The uncertainty on the inclusive t¯
t production cross section is +5%/−6% [
38
–
44
].
JHEP03(2016)127
Events / 0.067 0 200 400 600 800 1000 1200 1400 1600 =300 GeV + H m shape + H xBR=1 pb σ + H Data +LF t t c +c t t b +b t t Other bkg Total unc. -1 =8 TeV, 20.3 fb s (tb) + tH → gb ≥5j(≥3b) ATLAS Pre-fit BDT output -1 -0.8 -0.6 -0.4 -0.2 0 0.2 0.4 0.6 0.8 1 Data/Bkg 0.6 0.8 1 1.2 1.4 Events / 0.1 0 500 1000 1500 2000 2500 =500 GeV + H m shape + H xBR=1 pb σ + H Data tt+LF c +c t t tt+bbOther bkg Total unc.
-1 =8 TeV, 20.3 fb s (tb) + tH → gb ≥5j(≥3b) ATLAS Pre-fit BDT output -1 -0.8 -0.6 -0.4 -0.2 0 0.2 0.4 0.6 0.8 1 Data/Bkg 0.6 0.8 1 1.2 1.4 (a) (b)
Figure 3. Pre-fit distributions of the BDT output in the signal-rich region trained for two signal mass hypotheses: (a) 300 GeV and (b) 500 GeV. Each background process is normalised according to its cross section. A signal, normalised to a production cross section times branching fraction for H+ → tb (σ × BR) of 1 pb, is shown in pink, stacked on top of the background. The signal
shape is shown superimposed as dashed line normalised to the data. The hatched bands show the pre-fit uncertainties, which are dominated by systematic uncertainties (discussed in section 4.3). The lower panels display the ratio of the data to the total predicted background.
PDF and α
Suncertainties were calculated using the PDF4LHC prescription [
101
] with the
MSTW2008 68% CL NNLO, CT10 NNLO and NNPDF2.3 NNLO [
102
] PDF sets, added
in quadrature to the scale uncertainty. Systematic uncertainties due to the choice of
par-ton shower and hadronisation models are derived by comparing t¯
t events produced with
Powheg-Box interfaced to either Pythia or Herwig. Nine uncertainties associated with
the experimental measurement of the p
Tof the top quark and the t¯
t system are considered
as separate sources of systematic uncertainty in the reweighting procedure [
46
]. Two
ad-ditional uncorrelated uncertainties are assigned specifically to t¯
t+c¯
c events, consisting of
the full difference between applying and not applying the p
Treweighting procedure for the
top quark and the t¯
t system, respectively. A conservative systematic uncertainty of 50% is
applied to t¯
t+b¯b events to account for differences between the cross sections obtained with
Powheg+Pythia and the NLO prediction based on Sherpa with OpenLoops [
47
,
48
].
In the absence of an NLO prediction for t¯
t+c¯
c, the same uncertainty of 50% is applied
to this component of the t¯
t background. Four additional systematic uncertainties are
considered for the t¯
t+c¯
c background, derived from the simultaneous variation of
factori-sation and renormalifactori-sation scales, threshold of the parton-jet matching scheme [
103
], and
c-quark mass variations in the simulation of t¯
t events with Madgraph+Pythia, as well
as the difference between simulations of the t¯
t+c¯
c process with Madgraph+Pythia and
Powheg+Pythia. For the t¯
t+b¯b background, eight additional systematic uncertainties
JHEP03(2016)127
from the choice of PDF in the NLO prediction from Sherpa with OpenLoops and two
from the uncertainties on multi-parton interaction and final-state radiation, which are not
present in Sherpa with OpenLoops.
An uncertainty of +5%/−4% is assumed for the cross section of single-top-quark
pro-duction [
56
,
57
], corresponding to the weighted average of the theoretical uncertainties on
the s-, t- and W t-channel production modes. One additional systematic uncertainty is
considered to account for different ways of handling the interference between t¯
t and W t
events [
55
]. For t¯
tV , an uncertainty of 30% on the cross section is assumed [
52
,
53
] and an
additional uncertainty arises from variations in the amount of radiation. The uncertainty
on the t¯
tH cross section is +8.9%/−12% [
11
]. The uncertainties on the V +jets and diboson
backgrounds are 48% and 25%, respectively [
63
,
68
]. For events with 5 (≥6 jets), one (two)
additional uncertainties of 24% are added in quadrature to account for the extrapolation to
higher jet multiplicities. In addition, the full difference between applying and not applying
the p
Treweighting for the vector boson is taken as a systematic uncertainty. Uncertainties
on the estimate of the multi-jet background come from the limited number of events in
the data, especially at high jet and b-tagged jet multiplicities, from the uncertainties on
the measured lepton misidentification rates (assumed to be 50%, but uncorrelated between
events with an electron or muon), as well as from the subtraction of simulated events with
a prompt lepton when estimating the misidentification rates.
Three sources of systematic uncertainty are considered when modelling H
+→ tb
events. Uncertainties arising from the choice of PDF are estimated using samples generated
with MC@NLO v4.6 [
104
] interfaced to Herwig++ v2.5.2 [
105
], by taking the envelope
of the MSTW2008 68% CL NLO, CT10 NLO and NNPDF2.3 NLO PDF sets, and by
nor-malising to the nominal cross section [
101
]. The uncertainties observed across the charged
Higgs boson mass range are of the order of 5–10% and increase slightly with the H
+mass.
This systematic uncertainty affects both shape and normalisation. Uncertainties from the
choice of the event generator are estimated from a comparison of the signal acceptances
between events produced using either Powheg or Madgraph5 aMC@NLO v2.1.1 [
106
],
both interfaced to Pythia v8.1, with a charged Higgs boson mass of 400 GeV. In the SR,
this uncertainty is found to be about 1%, while it increases to as much as 20% in the CR. It
is applied to all signal mass points as a normalisation-only systematic uncertainty.
Uncer-tainties originating from initial- and final-state parton radiation, which can modify the jet
production rate, are evaluated by varying factorisation/renormalisation scale parameters
in the production of signal samples. This systematic uncertainty is found to be below 2%
in all five event categories.
4.4
Results
A binned maximum likelihood fit to the data is performed simultaneously in the five event
categories, and each mass hypothesis is tested separately. The inputs to the simultaneous fit
are the distributions of H
hadT
in the four CR, and the BDT output histograms in the SR. The
procedures for quantifying how well the data agree with the background-only hypothesis
and for determining exclusion limits are based on the profile likelihood ratio test [
107
].
JHEP03(2016)127
Source of uncertainty
Fractional uncertainty [%]
m
H+= 300 GeV
m
H+= 500 GeV
t¯
t modelling
31
33
Jets
21
9.5
Flavour tagging
19
24
Other background modelling
9.6
12
Signal modelling
8.0
3.5
Lepton
1.2
0
Luminosity
1.1
0.4
Statistics
8.9
18
Table 3. Percentage of the total uncertainty on the signal strength that is induced from various sys-tematic uncertainties. The values are obtained after fits to the background-plus-signal hypothesis. The largest contribution to the total uncertainty comes from the t¯t modelling.
branching fraction BR(H
+→ tb), also referred to as the signal strength. All systematic
uncertainties, either from theoretical or experimental sources, are implemented as nuisance
parameters with log-normal constraint terms. There are about 100 nuisance parameters
considered in the fit, the number varying slightly across the range of mass hypotheses.
The largest uncertainties for any tested mass point are those arising from the modelling of
the t¯
t processes. For m
H+< 350 GeV, the uncertainty on the t¯
t+b¯b cross section has the
largest impact on the result. For higher mass hypotheses, the uncertainties on the shape
of the distributions for t¯
t+b¯b from the reweighting to the NLO prediction are dominant.
The fractional contributions of various sources of uncertainty to the total uncertainty on
the parameter of interest are presented in table
3
, for two hypothesised H
+masses. The
uncertainties decrease for higher mass hypotheses because of the larger signal acceptance
and the improved separation between signal and background. The pulls of the nuisance
parameters after profiling to the data are almost all within ±1σ and never exceed ±1.5σ
for all tested mass hypotheses. The pulls that are larger than ±1σ in at least one of the
tested mass hypotheses are those associated with uncertainties on the t¯
t+HF cross sections,
on the parton shower modelling of the t¯
t+c¯
c process, and on the t¯
t+b¯b NLO modelling,
derived from variations of the functional form of the renormalisation scale .
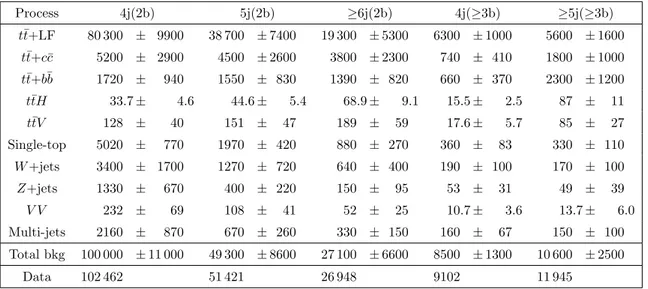
The post-fit distributions of the H
hadT
variable in the four CR for the fit under the
background-only hypothesis are shown in figure
4
, whereas the background-only post-fit
distributions of the BDT output in the SR are presented in figure
5
. The background
com-ponent of a fit under the background-plus-signal hypothesis is overlayed. The post-fit event
yields for the fit under the background-plus-signal hypothesis for m
H+= 300 GeV are given
in table
4
. The fit prefers a positive signal strength for all tested mass hypotheses, except
at 600 GeV. The post-fit event yields for the t¯
t+HF process are higher in background-only
fits than those obtained in fits where the signal hypothesis is included.
The modified frequentist method (CLs) [
108
] and asymptotic formulae [
109
] are used
to calculate upper limits on σ(gb → tH
+) × BR(H
+→ tb). The 95% confidence level (CL)
JHEP03(2016)127
Process 4j(2b) 5j(2b) ≥6j(2b) 4j(≥3b) ≥5j(≥3b) t¯t+LF 83 600 ± 1900 41 800 ± 1400 21 000 ± 1000 6750 ± 270 6650 ± 390 t¯t+c¯c 3200 ± 1700 2600 ± 1400 2100 ± 1200 490 ± 230 1260 ± 570 t¯t+b¯b 1500 ± 530 1300 ± 440 1050 ± 450 600 ± 210 2040 ± 550 t¯tH 34.6 ± 3.8 44.6 ± 4.9 66.7 ± 7.8 16.2 ± 1.9 87 ± 10 t¯tV 132 ± 39 153 ± 46 186 ± 57 18.5 ± 5.4 87 ± 26 Single-top 5030 ± 530 1970 ± 270 860 ± 170 386 ± 55 342 ± 70 W +jets 4500 ± 1100 1660 ± 470 750 ± 270 250 ± 62 220 ± 69 Z+jets 1330 ± 560 370 ± 190 137 ± 80 56 ± 23 36 ± 27 V V 223 ± 63 103 ± 39 47 ± 23 10.4 ± 3.1 15.0 ± 5.3 Multi-jets 2230 ± 590 690 ± 180 330 ± 100 160 ± 46 208 ± 88 Total bkg 101 800 ± 2200 50 700 ± 1600 26 600 ± 1100 8730 ± 330 10 950 ± 490 H+ 700 ± 310 600 ± 260 430 ± 190 370 ± 160 990 ± 440 Data 102 462 51 421 26 948 9102 11 945Table 4. Event yields of SM backgrounds, signal and data in all categories, after the fit to the data under the background-plus-signal hypothesis with a signal mass of 300 GeV. The last column shows the event yields in the SR. The uncertainties take into account correlations and constraints of the nuisance parameters.
between 200 and 300 GeV, and in 50 GeV steps up to 600 GeV. At 250 GeV, the local p
0-value for the observation to be in agreement with the background-only hypothesis reaches
its smallest value of 0.9% (corresponding to 2.4 standard deviations). At m
H+values of
300 and 450 GeV, the excess of the data with respect to the background-only hypothesis
corresponds to 2.3 standard deviations.
For comparison, the expected upper limit is computed with a signal injected at m
H+=
300 GeV, with a production cross section times branching fraction of 1.65 pb, corresponding
to the best-fit value of the signal strength at this mass point. This results in an excess that
is more localised at the injected mass value, i.e. extends less to lower and higher masses
than the trend seen in the observed upper limit, as shown in figure
6
. The H
+signal is
generated with a zero width. The experimental mass resolution ranges from approximately
30 GeV (for m
H+= 200 GeV) up to 100 GeV (for m
H+= 600 GeV) and is 50 GeV for the
mass hypothesis of 300 GeV. A systematic background mismodelling is considerably more
likely to give rise to the observed excess than a hypothesised signal at a specific mass. The
cross sections of the t¯
t+HF backgrounds and the shape of the t¯
t+b¯b component have large
uncertainties which are correlated with the signal normalisation. Together with the pre-fit
excess of data compared to the SM prediction (table
1
), this can result in a post-fit excess
over a wide H
+mass range. The fits were repeated using two alternative, less sensitive,
discriminants in the SR: (a) a BDT trained against the sum of all backgrounds or (b) the
variable H
hadT
. Similar excesses were observed with these two alternative methods. The
tested mass points are correlated with each other, since no mass-dependent event selections
are applied in the analysis and the dataset is the same regardless of the hypothesised
JHEP03(2016)127
Events / 50 GeV 0 5000 10000 15000 20000 25000 30000 Data tt+LF c +c t t tt+bb Other bkg Total unc.-1 =8 TeV, 20.3 fb s (tb) + tH → gb 4j(2b) ATLAS
Post bkg-only fit
in sig+bkg fit Total bkg shape 300 GeV + H [GeV] had T H 0 200 400 600 800 1000 1200 Data/Bkg 0.8 0.9 1 1.1 1.2 Events / 50 GeV 0 2000 4000 6000 8000 10000 12000 Data tt+LF c +c t t tt+bb Other bkg Total unc.
-1 =8 TeV, 20.3 fb s (tb) + tH → gb 5j(2b) ATLAS
Post bkg-only fit
in sig+bkg fit Total bkg shape 300 GeV + H [GeV] had T H 0 200 400 600 800 1000 1200 Data/Bkg 0.8 0.9 1 1.1 1.2 (a) (b) Events / 50 GeV 0 1000 2000 3000 4000 5000 Data tt+LF c +c t t tt+bb Other bkg Total unc.
-1 =8 TeV, 20.3 fb s (tb) + tH → gb 6j(2b) ≥ ATLAS
Post bkg-only fit
in sig+bkg fit Total bkg shape 300 GeV + H [GeV] had T H 0 200 400 600 800 1000 1200 Data/Bkg 0.8 0.9 1 1.1 1.2 Events / 50 GeV 0 500 1000 1500 2000 2500 3000 Data tt+LF c +c t t tt+bb Other bkg Total unc.
-1 =8 TeV, 20.3 fb s (tb) + tH → gb 3b) ≥ 4j( ATLAS
Post bkg-only fit
in sig+bkg fit Total bkg shape 300 GeV + H [GeV] had T H 0 200 400 600 800 1000 1200 Data/Bkg 0.8 0.9 1 1.1 1.2 (c) (d)
Figure 4. Distributions of Hhad
T after the fit to the data under the background-only hypothesis
in the four control regions: (a) 4j(2b), (b) 5j(2b), (c) ≥6j(2b), (d) 4j(≥3b). Each background is normalised according to its post-fit cross section. The signal shape is shown as a superimposed dashed blue line normalised to the data. The last bin includes the overflow. The hatched bands show the post-fit uncertainties taking into account the constraints and correlations of the nuisance parameters. The lower panels display the ratio of the data to the total predicted background. In addition, the solid red line shows the total background after an unconditional fit under the background-plus-signal hypothesis with a signal mass of 300 GeV.
The limits in figure
6
are presented together with the signal prediction in the m
mod−hbenchmark scenario of the MSSM [
95
]. Model points with 0.5 . tan β . 0.6 and tan β ≈ 0.5
are excluded in the H
+mass ranges of 200–300 GeV and 350–400 GeV, respectively,
4while
the expected limits in the mass range of 200–400 GeV reach tan β = 0.7. The m
mod−hscenario is chosen as a reference model, but similar exclusions are obtained in other relevant
scenarios of the MSSM [
95
], i.e. m
mod+h, m
max−uph, tau-phobic, light stau and light stop. It
has been verified that the width predicted by these models does not have a notable impact
on the exclusions.
JHEP03(2016)127
Events / 0.067 0 200 400 600 800 1000 1200 1400 1600 Data +LF t t c +c t t b +b t t Other bkg Total unc. -1 =8 TeV, 20.3 fb s (tb) + tH → gb ≥5j(≥3b) ATLASPost bkg-only fit
in sig+bkg fit Total bkg shape 300 GeV + H BDT output -1 -0.8 -0.6 -0.4 -0.2 0 0.2 0.4 0.6 0.8 1 Data/Bkg 0.8 0.9 1 1.1 1.2 Events / 0.1 0 500 1000 1500 2000 2500 Data tt+LF c +c t t tt+bb
Other bkg Total unc.
-1 =8 TeV, 20.3 fb s (tb) + tH → gb ≥5j(≥3b)
ATLAS Post bkg-only fit
in sig+bkg fit Total bkg shape 500 GeV + H BDT output -1 -0.8 -0.6 -0.4 -0.2 0 0.2 0.4 0.6 0.8 1 Data/Bkg 0.8 0.9 1 1.1 1.2
(a)
(b)
Figure 5. Distributions of the BDT output in the signal-rich region after the fit to the data under the background-only hypothesis. The BDT was trained for two signal mass hypotheses: (a) 300 GeV and (b) 500 GeV. Each background is normalised according to its post-fit cross section. The signal shape is shown as a superimposed dashed blue line normalised to the data. The hatched bands show the post-fit uncertainties taking into account the constraints and correlations of the nuisance parameters. The lower panels display the ratio of the data to the total predicted background. In addition, the solid red line shows the total background after an unconditional fit under the background-plus-signal hypothesis with a signal mass of (a) 300 GeV and (b) 500 GeV.
[GeV] + H m 200 250 300 350 400 450 500 550 600 tb) [pb] → + )xBR(H + tH → (gb σ -1 10 1 10 Observed limit (CLs) Expected limit (CLs) σ 1 ± σ 2 ± xBR=1.65 pb σ =300 GeV, + H m
Exp. limit with injected signal
=0.5 β tan mod-h xBR m σ =0.7 β tan mod-h xBR m σ =0.9 β tan mod-h xBR m σ ATLAS -1 =8 TeV, 20.3 fb s (tb) + tH → gb
Figure 6. Expected and observed limits for the production of H+→ tb in association with a top
quark, as well as bands for 68% (in green) and 95% (in yellow) confidence intervals. The red dash-dotted line shows the expected limit obtained in the case where a simulated signal is injected at mH+= 300 GeV, with a production cross section times branching fraction of 1.65 pb (corresponding
to the best-fit signal strength at that mass hypothesis), yielding a deviation from the expectation that extends less to higher and lower mass values than the observed upper limit. Theory predictions are shown for three representative values of tan β in the mmod− benchmark scenario of the MSSM.
JHEP03(2016)127
5
Search for a charged Higgs boson produced in the s-channel
In this section, two searches for qq
0→ W
0→ tb recently published by ATLAS [
22
,
23
]
are reinterpreted as searches for the s-channel production
5of charged Higgs bosons, i.e.
→ H
+→ tb, based on final states with one charged lepton (electron or muon) and jets,
or hadronic jets only.
5.1
Lepton+jets final state
In the search for H
+→ tb → (`νb)b produced in the s-channel, where the charged lepton
` is an electron or muon (from a prompt W -boson decay or a leptonic τ decay), only
events collected using a single-electron or single-muon trigger are considered, with the
same combination of thresholds as in section
4.1
. Exactly one charged lepton is required,
which must match, with ∆R < 0.15, a lepton reconstructed by the trigger. The electron
or muon is then required to have E
Tor p
Tgreater than 30 GeV. The selected events
must then have two or three jets, with exactly two of them b-tagged. In addition, the
E
missT
must exceed 35 GeV, and the sum E
Tmiss+ m
T, where m
Tis the transverse mass
6of
the W boson, is required to be greater than 60 GeV in order to reduce the contribution
from the multi-jet background. Assuming that the missing transverse momentum arises
solely from the neutrino in the W -boson decay, its transverse momentum is given by the
x-and y-components of the E
missT
vector, while the unmeasured z-component of the neutrino
momentum p
νz
is inferred by imposing the W -boson mass constraint on the lepton-neutrino
system. This leads to a quadratic equation for p
νz
. In the case of two real solutions, the
one with the smaller p
νz
is chosen. If the solutions are complex, a real estimate of the p
νzis obtained by a kinematic fit that rescales the neutrino momentum components p
νx
and
p
νy
such that the imaginary term vanishes. The corrected missing transverse momentum of
the neutrino is kept as close as possible to the measured E
missT
[
110
].
Having determined the four-momentum of the leptonically decaying W boson, the top
quark is then reconstructed. The b-tagged jet for which the invariant mass of the W b
system is closest to m
topis assumed to originate from the top-quark decay, the other
b-tagged jet being in turn assigned to the H
+decay. The selected events are then classified
into one signal-rich and one signal-depleted region, separately for events with two or three
jets. The signal-rich region is the subset of the sample with two b-tagged jets and an
invariant mass m
tb> 330 GeV. The signal-depleted region is the complementary subset,
with two b-tagged jets and m
tb< 330 GeV.
The shape and normalisation of the multi-jet background with a misidentified lepton
are determined with the matrix method [
31
]. All other backgrounds are taken from
simu-lation. For W +jets events, the sample composition in the signal-rich and signal-depleted
regions with two b-tagged jets are similar, hence an overall renormalisation of the W +jets
background, based on the event yield measured in the signal-depleted region, is applied
to the events with two jets. In the events with three jets, the contribution of the W +jets
5
While the process generated is qq0→ H+
, the most commonly occuring reaction is cs → H+. 6The transverse mass is defined as m
T=p2p`TETmiss(1 − cos ∆φ`,miss), where ∆φ`,missis the azimuthal separation between the reconstructed lepton and the missing momentum in the transverse plane.
JHEP03(2016)127
BDT Output -1 -0.8 -0.6 -0.4 -0.2 0 0.2 0.4 0.6 0.8 1 Fraction of events / 0.05 0 0.05 0.1 0.15 0.2 0.25 0.3 0.35 Background (0.8 TeV) + H (1.2 TeV) + H (1.6 TeV) + H ATLAS Simulation -1 = 8 TeV, 20.3 fb s 2 jets 2 b-tags (tb), l+jets + H → qq’ BDT Output -1 -0.8 -0.6 -0.4 -0.2 0 0.2 0.4 0.6 0.8 1 Fraction of events / 0.05 0 0.05 0.1 0.15 0.2 0.25 0.3 0.35 Background (0.8 TeV) + H (1.2 TeV) + H (1.6 TeV) + H ATLAS Simulation -1 = 8 TeV, 20.3 fb s 3 jets 2 b-tags (tb), l+jets + H → qq’ (a) (b)Figure 7. Expected BDT output distribution for the SM backgrounds and for three H+ signal
samples (with masses of 0.8, 1.2 and 1.6 TeV), obtained in the signal-rich regions with (a) 2 jets and 2 b-tags and (b) 3 jets and 2 b-tags. All distributions are averaged over events with an electron or a muon in the final state, and they are normalised to unity.