Scientific Press International Limited
Dam Safety and Οvertopping
Nasrat Adamo1, Nadhir Al-Ansari2, Varoujan Sissakian3, Jan Laue4 and Sven Knutsson5
Abstract
Overtopping is one of the most serious modes of failures for all dams causing great numbers of human fatalities and material damages. Statistics show that overtopping failures are the highest, especially for embankment dams. The main reason for this is the erroneous prediction of the inflow design discharge, which has resulted from lack of realistic flow data and imperfect hydrological procedures. Failure in most cases occurs when the inflow exceeds the spillway design capacity, but to a lesser extent from the buildup of very high wave setup and runs up. This has led to active efforts in upgrading dams for such occurrences, by either upgrading spillways, adding auxiliary spillways, increasing freeboard by either heightening the dams or the parapet walls on the crest. Advancement in predicting the safe inflow discharges are also made by adopting such procedures as the calculation of the Probable maximum flood based on predicting the Maximum Probable Precipitation or using statistical methods by treating long records of available flow data. Recently, another challenge has come up facing dam owners and builders who are represented by the climate change impacts on the hydrological cycle; this has put a new responsibility to the governments to issue new regulations and plans to mitigate these impacts reducing failure possibilities and improve dam safety against overtopping.
Keywords: Overtopping, Inflow Design Discharge, Spillway Design Discharge,
Wave Set Up, Wave Run Up, Probable Maximum Discharge, Probable Maximum Precipitation, Climate Change.
1 Consultant Dam Engineer, Sweden.
2 Lulea University of Technology, Lulea, Sweden.
3 Lecturer, University of Kurdistan Hewler, and Private Consultant Geologist, Erbil. 4 Lulea University of Technology, Lulea, Sweden.
5 Lulea University of Technology, Lulea, Sweden.
Article Info: Received: June 9, 2020. Revised: June 18, 2020.
1. Historical Overview
Overtopping of a concrete, masonry or an embankment dam is the flow of water over their crest leading in the majority of cases to failure. In many events, during the long world history of dams; overtopping has been one of the major modes of failure. Most failures were caused by floods, which had exceeded the spillway capacity as a result of insufficient knowledge of the hydrological conditions of the region leading to incorrect assessment of the proper inflow design discharge. Many other overtopping failures, however, have resulted from a variety of reasons; such as failures of gates to operate properly as a result of total or partial jamming due to mechanical or electrical problems or operational errors on the part of the operators, jamming of the outlet structures by excessive quantities of floating debris reducing the discharge capacity of the outlet, landslide in the upstream reservoirs (artificial or natural) causing a surge wave over the dam crest. Excessive settlement and loss of freeboard after earthquakes have contributed in some cases to overtopping failures while in some other events the action of very strong waves resulting from violent storms caused overtopping failures due to abrasive process causing the failure of insufficiently lined upstream faces of dams. Moreover, human failings may have been behind some failures due to not observing the rule curves and
operation instruction due to insufficient expertise on the part of the operators. According to statistics related to overtopping failures in the USA which have
resulted from inadequate spillway design, debris blockage of spillways, or settlement of the dam crest account for approximately 34% of all U.S.A. dam failures, while the Association of Dam Safety Officials (ASDSO) data base shows that failure cases due to overtopping in the USA for the period 2010- 2017 exceeded by far all the other failure mechanisms, as shown in Figure 1.
These failures have caused considerable damages and loss of life in the communities
living in the downstream unaware of the danger to which they were subjected. Records indicate that only eight of the documented failures due to overtopping
killed 8000 people during the period (1889-1951), while other statistics show a figure of human fatalities of almost 180,000 during the period (1951-2018) due to hydrological reasons mainly causing overtopping; out of these 171,000 people were drowned in the catastrophic failure of Banqiao and Shimantan cascade of dams in China in domino action in 1975 due to overtopping.
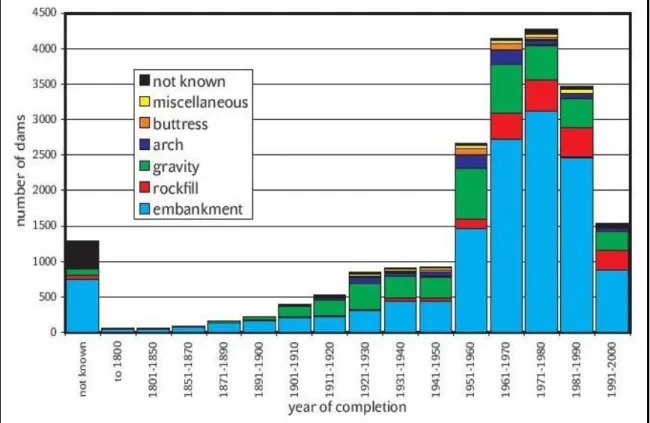
The high rate of fatalities due to hydrological reasons reflects that, even with improved hydrological methods and measurements, failures have continued to happen as a direct result of the high growth rate in dam construction and the sharp increase in their number during the last decades of the last century. To illustrate this point, Figure 2 gives the number of dams constructed in the world (by decades) up to the year 2000 according to their type, and Figure 3 indicates the number of dams constructed per given decade up to the year 2000 depending on dam height (hd). The source of these data is World Dam Register (ICOLD); in both cases not including dam failures in China and Russia [2].
Figure 2 : Number of dams constructed in the world by decades and with reference to dam type, according to the World Dam Register (ICOLD)
On a worldwide scale, floods have been the main cause of dam failures and of 90 per cent of the related fatalities. Most fatalities resulted from failures of 20 to 30m high dams, and few have resulted from thousands of failures of dams lower than 15m [3].
Figure 3: Number of dams constructed per given decade depending on dam
height hd, according to World Dam Register (ICOLD) (not including dams in China and Russia) [2].
2. Definition of Terms
• Overtopping According to Collins English Dictionary overtopping is: “The rising of water over
the top of a barrier. In the context of dams; Dam overtopping means: water passing over the top of the dam which may lead to its failure unless it is designed for such an even. This condition arises when the passage provided to pass the flood (spillway and outlet works) are unable to discharge the coming inflow. Dams can be overtopped with a continuous flow when the Maximum Water Level of the reservoir exceeds the dam crest. For overtopping by waves, the water surface elevation approaches but does not exceed the crest level, but waves driven by wind produce waves run-up which overtop the top of the dam. The wave action can form an “equivalent” discharge per liner foot of the structure and can lead to the erosion and potential failure of the structure. Waves are influenced by wind speed, wind direction, bathymetry, open water distance, and embankment slopes.
• Inflow Design Flood Inflow Design Flood (IDF) is the flood defined by the flow hydrograph entering the
reservoir which is used to design and/or modify a specific dam and its appurtenant works. Particularly for sizing the spillway and outlet works, and for evaluating
maximum storage of the reservoir, height of the dam and appurtenant works.
• Spillway Design Flood. Spillway Design Flood (SDF) is defined by the flow hydrograph leaving the
reservoir that is used to design and/or modify a specific dam and its appurtenant works (also referred to as the outflow hydrograph) the (SDF) is estimated by routing the appropriate (IDF) through the dam’s spillway, outlet works, and attendant surcharge storage.
• Deterministic Approach
Deterministic approach as used in hydrology is the use of relationships in which the outcomes are precisely determined through known correlations between states and events, without any room for random variation. In this approach, a certain magnitude of a flood will always be the same for the same storm and for same catchment conditions.
• Probabilistic Approach
Probabilistic approach in hydrology enables variation and uncertainty to be quantified, mainly by using frequency distributions instead of fixed values in risk assessment. A frequency distribution describes the range of possible values (e.g. for floods), and shows the probability of exceedance of certain value.
• Probable Maximum Flood (PMF)
It is the flood that may be expected from the most severe combination of critical meteorological and hydrological conditions that are reasonably possible in the drainage basin, and it is computed by using the Maximum Probable Storm, i.e. Probable Maximum Precipitation. Calculation of the probable maximum flood falls within the deterministic approach procedures.
• Probable Maximum Precipitation (PMP)
Theoretically, it is the greatest depth of precipitation for a given duration that is physically possible over a given size storm area at a particular geographical location during a certain time of the year. Calculation of the probably maximum precipitation falls within the deterministic approach procedures.
3. Detailed causes of dams’ failures by overtopping
Overtopping leading to dam failures may occur due to variety of reasons as already mentioned; these which can be detailed as follows:
a. Inflow design discharge exceeds the capacity for which the spillway (together with other outlets if any) was designed and its capacity might have been underestimated in these cases. It has been noticed from reviewing dam failure cases due to overtopping that many of the older dams had failed as a result of the spillway being sized for floods that no longer represent the actual hydrological conditions. It is necessary; therefore, to carry out new evaluation of the older dams’ safety by checking the inflow design discharge using updated hydrological data, and if the spillway capacity proves to be insufficient, this has to be rectified by either remodeling the spillway itself, add an auxiliary spillway
or increase the height of the dam. In some cases, a combination of one or more of these solutions may prove more practical and cost effective.
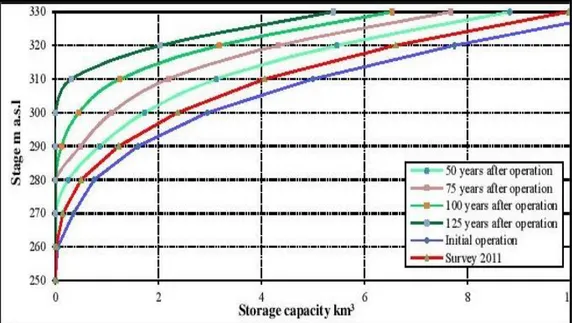
b. Change of hydraulic conditions during the reservoir life time can have pronounced impact on the operation of the spillway leading to danger of overtopping by reducing the discharge capacity of the spillway from the previously calculated design discharge. Spillway discharge curves used in passing the floods during operation are often based on idealized discharge curves obtained from hydraulic modeling, and so it may be advisable; therefore, to check these curves immediately after commissioning and more than once during operation of the dam. Another factor which has its impact on the routing of floods is the possible changes that occurred in the flow conditions of approach due to natural or artificial changed throughout the life of the dam. New conditions which can arise that are less than the ideal assumed ones during design that may reduce the discharge of the spillway from what was originally stipulated. Moreover, sedimentation of the reservoir normally alters the stage-volume curve used in the flood routing equations to arrive at the size of the reservoir and the corresponding spillway design discharge during the design stage. These again warrants the revision and alteration of the operation rules for higher safety of operation. A good example of such change is illustrated in Figure 4 which shows the stage-volume curve of Mosul dam reservoir in 2011 after 25 years of operation (in red) as compared to the original curve (in blue). The red curve was obtained by an actual bathymetric survey, and it shows a considerable change. More expected changes are calculated for future periods (50yr, 75yr, 100yr and 125 yr) as shown in the other curves [4].
Figure 4: Storage- Discharge curve variation with time of Mosul Dam Reservoir.
c. During high floods spillway discharge capacity may be reduced due to malfunctioning of the spillway gates even at incoming flood, which is less than the inflow design discharge. A notable example of such an event is the overtopping and failure of Gibson`s dam in the USA when overtopping occurred during a rainstorm in Montana on June 6-8 1964. The spillway radial gates were not fully opened at the duration of the storm; two gates were completely open, but two more gates were partially open and the last two gates were completely closed. The controls of these gates were inaccessible to the operators during the storm; so overtopping of three feet of water over the parapet for twenty hours caused the collapse of this concrete dam [5]. More on this can be found in reference [6].
d. Overtopping and the consequent dam failure may result from a miss-operation of the spillway gates due to human negligence. The failure of the 24 meter high Dibis earth fill dam on the Lower Zab River in Iraq on the first of March 1984 can be mentioned as an example. In this event, the dam was left completely intendant and the operators had left the site during the night leaving no replacement to operate the spillway radial gates in case of emergency. These gates were partially open when the flood occurred, and high flow release from the upstream Dokan Dam combined with very high runoff from a severe rain storm on the intermediate catchment caused the overtopping and erosion of the earth fill embankment. The fuse-plug that should have worked in such rare occurrences did not erode due to complete short sight of the authorities who had constructed a concrete slab for passing a road on the crest and had laid also large diameter water supply pipe along it making the operation of the fuse plug impossible. Unofficial sources put the number of fatalities at nine.
e. Potential blocking of spillway entrance by reservoir debris may lead to catastrophic results. If the full capacity of the spillway is not available, dam overtopping can occur under more frequent floods. Some watersheds produce large amounts of debris during rainstorms. Sturdy log booms may be able to capture the debris before it reaches the spillway, but if not, the debris may clog the spillway openings. If a spillway is gated, and the gates are being operated under orifice conditions or if the bottom of the raised gate is less than 5 feet above the flow surface, then the spillway openings will be further restricted, compounding the potential for debris blockage.
f. It is interesting to note that overtopping can happen also from the combination of the still water level (SWL) and wind setup exceeding the crest of the dam. For over-wash, wind setup and wave run-up intermittently may combine to produce water level exceeding the crest of the dam. Typically, however, a significant surface area upstream (fetch) is required to allow wind to develop waves that would be directed towards the embankment and overtop it, Figure 5, [7].
Figure 5: Definition of terms for wind action [6].
g. Other overtopping failures may be caused by landslides into the reservoir which cause a sudden surge in the upstream water level and formation of wave passing over the crest as it happened in the Vajont dam catastrophe in Italy. This dam was completed in 1959, but the landslide into the reservoir caused the overtopping of this concrete dam on the 9th of October 1963. Paradoxically, the
dam did not fail but the flood wave caused the death of almost 2000 people. Earthquakes could also trigger landslides or may cause excessive settlement of the dam and loss of freeboard leading to overtopping.
4. Dams failure mechanism during overtopping
The Mechanism of failure caused by overtopping differs between earth fill dams and concrete dams. For earth fill dams, there are two ways for overtopping failure to be initiated. The first is when the flow over the crest of the dam continues as the reservoir water level exceeds the elevation of the dam crest, and second is the persistent over-wash from waves even if the water surface stays below the crest elevation. In such case the over-wash has to continue for enough time to erode the material of the crest and initiate the washing away of the dam body.
From past similar failures, it was noticeable that most embankment dams and levees would not withstand sustained overtopping of a foot to two feet or more without a high probability of failure. The depth and duration of overtopping are therefore, the main factors leading to failure. The embankment crest protection materials and the downstream protection materials contribute to the rate of erosion that leads in the end to failure.
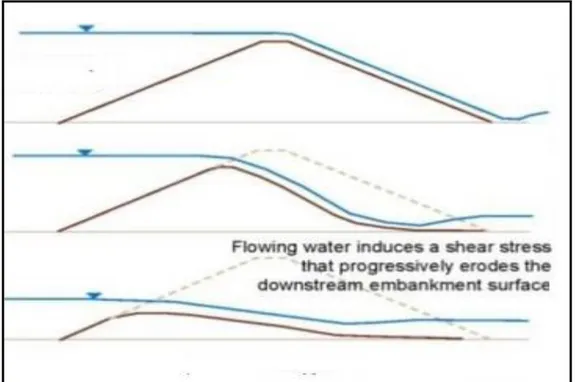
The development of this process is initiated by a flood which causes the reservoir level to rise above the crest, then the slope protection is removed after reaching its critical shear stress and therefore, erosion of the body of the dam itself would begin by the erosion of the embankment. First along the top of the downstream slope of a cohesionless embankment, or at the downstream end of the crest of a cohesive embankment and headcut forms, as soil particles continue to be washed the headcut advances to the upstream end of the crest (and can deepen and widen at the same time) and eventually the embankment crest is lowered, and breach occurs leading to washing away the dam, refer Figure 6 and Figure 7 [7].
Figure 6: Stages of failure of earth fill dam due to overtopping. (Cohesionless material) [7].
Figure7: Stages of failure of earth fill dam due to overtopping. (Cohesive material) [IV2].
In most cases, concrete dams can withstand certain level of overtopping more than what earth fill dam can do. This is due to the resistance offered by the dam material itself, but their vulnerability to failure may be due to scouring of their foundation rock at the downstream. The rock material and the condition of jointing and fracturing of the rock mass, their magnitude and spacing and bedding orientation are all factors which can enhance the erodibility of bed material in the vicinity of the dam foundation. In sustained conditions of overtopping, the depth of scour increases and could even scour the foundation leading to the collapse of the dam. The lowering of the Tailwater level as erosion downstream continuous enhances the scouring process leading to the mentioned conditions [5]. The dam usually collapses almost instantaneously, and a positive direct flood wave (shock wave) is formed. This wave distinguishes itself by a steep front advancing forwards as a result of the so-called “flood-gate effect”. Then, a backward negative wave spreading in the reservoir against the flow direction originates at the reservoir level of the broken dam. Maximum breach discharge practically occurs at the beginning of the failure with the maximum difference of water levels on the upstream and downstream sides of the dam [9]. The breach may be instantaneous, and its length can be about five times the dam height. As the reservoir level, which corresponding to the failure, may not be well known, alarms are less efficient in cases of concrete dams than for embankment dams, and old dams require great care, as the risk of fatalities is high [3].
5. Inflow Design Flood and Dams Safety
One of the most common causes of dam failures is the inability to safely pass flood flows. The most common potential failure modes associated with hydrologic conditions include overtopping erosion, erosion of spillways, internal erosion (seepage and piping) at high reservoir levels, and overstressing the structural components of the dam. Selection of the inflow designs flood (IDF) which is compatible with the required standard of safety requirements, therefore, is of utmost importance.
Inflows Design Flood (IDF), as already defined, is the flood used to design and/or modify a specific dam and its appurtenant works; particularly for sizing the spillway and outlet works, and for determining surcharge storage and height of dam requirements, in another word it is the largest flood that a given dam is designed to pass safely whether during construction or throughout its service life. It is, therefore, the largest flood that is selected for the design or for safety evaluation of the dam. In selecting the inflow design flood (IDF), engineers had used a variety of methods to select this flood discharge using available hydrological data, and at the same time having in mind the size of dam and reservoir and their outlook towards safety requirements plus available financial resources. The used methods varied from the use of deterministic approach such as the use of rational formulae, which were widely used in early times and still being used in some countries and another
popular approach, which is based on the unit hydrograph. In the rational method, the peak runoff rate is a function of the average rainfall rate
during the time of concentration such that and rainfall intensity is constant during rainfall, and is established in the relationship between the peak discharge and the design rainfall of the same frequency in the form of:
Q = kCIA where,
k – Conversion factor equal to 1.008 (SI) or .00278 (metric) C – Dimensionless runoff coefficient.
i – Rainfall intensity (in/hr, mm/hr). A – Catchment area (acres, ha, km2).
In using the unit hydrograph method, the design storm for the project is applied to determine the corresponding flood hydrograph. More often the Probable Maximum Flood is also utilized as another variation of these deterministic methods. When a sufficiently long flow series of discharges is available, the probabilistic approach is resorted to where frequency analysis is carried out to determine the floods of various frequencies or probabilities. For important projects, the results of various approaches are compared or combined together to obtain the design flood.
In examining the procedures followed so far, both the probabilistic and the deterministic criteria have been widely used. Probabilistic criteria are based on either floods or rainfall events, which have specified probabilities or return periods (such as the 1% annual chance exceedance flood), while the Deterministic criteria
are based, among the other methods mentioned above, on estimates of the Probable Maximum Flood (PMF) from estimation of the Probable Maximum Perspiration (PMP) over the specified region.
More often, the use of composite criteria had been also done by prescribing an Inflow Design Flood from an equation that includes both a frequency event and some fraction of the Probable Maximum Event e.g. (50% Probable Maximum Flood + 100 year flood) or other combinations. Such combinations, however, are not favored by the United States Federal Emergency Management Agency (FEMA) on the ground that such guidelines are not linked to the hazards presented by these dams and the degree of risks they pose to life and material and environmental losses. Furthermore, FEMA recommends that the hazard potential classification system be used as the basis for IDF selection guidelines, and, that the use of any classification system based on the size (height or storage volume) of a dam for IDF selection shall be discontinued. The hazard classification system which is specified by FEMA is illustrated by Table 1 [10
].
Table 1: Recommended Dam Classification System Based on Hazard Potential [10].
Economic Loss, Environmental Loss, and/or Disruption of lifeline
Facilities Loss of Human Life
Hazard Potential Classification
Yes (but not necessary for this classification)
Probable (one or more expected) High
Yes None Expected
Significant
Low (generally limited to the Owner)
None Expected Low
The use of FEMA classification system shown in Table 1 is based on the understanding that the failure of any dam, no matter how small, could represent a danger to downstream life and property. It is therefore, necessary that this classification be used as the basis for the inflow design flood selection, and that the use of any classification system based on the size (height or storage volume) of a dam for IDF selection is discontinued. Following this, Table 2 is recommended for use for the selection of IDF [11].
1) Incremental consequence analysis or risk-informed decision making may be used to evaluate the potential for selecting an IDF lower than the prescribed standard. An IDF less than the 0.2% annual chance exceedance flood (500-year flood) is not recommended.
2) Incremental consequence analysis or risk-informed decision making studies may be used to evaluate the potential for selecting an IDF lower than the prescribed standard. An IDF less than the 1% annual chance exceedance flood (100-year flood) is not recommended [11].
Whatever, the method used to arrive at the inflow design discharges the importance and reliability of hydrological data obtained from historical records should be tested for uniformity, reasonableness and reliability by means of theoretical computation and by comparative techniques against available data of precipitation and runoff records of neighbouring drainage area. If little or no historical records are available, data on which design can be based may be obtained from correlation with hydrologic and meteorologic records from neighbouring drainage areas. However, care must be exercised in determining relationships and conversion factors. The resulting values should be checked in the field by runoff measurements, comparison with marks left from floods, etc.
Table 2: FEMA’s recommendation for the selection of IDF.
Hazard Potential Classification
Definition of Hazard Potential
Classification Inflow Design Flood (IDF)
High
Probable loss of life due to dam failure or misoperation (economic loss, environmental damage, or disruption of lifeline facilities may also be probable, but are not necessary for this
classification)
PMF1
Significant
No probable loss of human life but can cause economic loss, environmental damage, or disruption of lifeline facilities due to dam failure or misoperation
0.1% Annual Chance Exceedance Flood (1000- year Flood)2
Low
No probable loss of human life and low economic and/or environmental losses due to dam failure or misoperation
1% Annual Chance Exceedance Flood (100- year Flood or a smaller Flood justified by rationale)
From the view point of preventing overtopping of any dam; the capacity of gated spillways should be sufficient to discharge the full inflow design flood (IDF) without taking into account the damping effect resulting from flood routing through the reservoir, and in determining or checking the spillway capacity no discharge from other outlet facilities should be taken into consideration. A reduction of the spillway design discharge may be permitted if:
1) Using higher criteria of safety against failure from overtopping than required by current design practice and technology or prevalent design standards.
2) Permanent availability of reserve storage capacity of the reservoir, between the normal and the maximum reservoir. The availability of the reserve
storage capacity must be combined with highly reliable operating
procedures that assure the opening of the spillway gates in accordance with the predetermined flood routing program. When establishing this program, the risk of repetition of major floods at short intervals should be taken into account.
3) The existence of an additional fuse plug spillway; the rupture of which would not increase the downstream flood beyond an acceptable level. 4) A permanent low downstream risk level that should at no time includes
any additional risk to human life in inhabited areas due to failure of the dam. In case of an increase of the downstream risk level, the spillway capacity must be re-evaluated and enlarged if necessary.
5) Other favorable circumstances that permit exemption from the above mentioned requirements, such as the existence of regulation put by the responsible government agency, as in taking into account the higher resistance against erosion of concrete dams as compared to earth dams; or the combination of a gated with an overflow spillways [12].
As outlined in (2) above, this point emphasizes the importance and necessity of reliable and intelligent operational procedures to alleviate the overtopping risk, even if all design requirements are satisfied. Moreover, the risk to life is taken up clearly in these recommendations. The upgrading of the spillway or the dam as a whole to safe guard against overtopping and the consequential loss of life and extensive property damage is clearly stipulated in point (4) above.
6. Overtopping Dam Failures; Some Examples
The possibility of overtopping of a dam, from hydrologic and hydraulic points of view, is governed by two important design factors; which are: 1) The selection of the Inflow Design Discharge (IDF), and 2) The selection of the Spillway Design discharge (SDF).
During the nineteenth century, or even before that, the flood inflow design flood discharge (IDF), required for the design of the early dams was entirely done by arbitrary methods, based on some empirical techniques, use of high water marks left by previous high floods and engineering judgment. This meant, the high possibility of overtopping of dams that were not built to meet unanticipated higher floods than those which they were designed for. One example of such dams in the United States is the Mill River Dam which failed on May 16, 1874, killing 139 people during a heavy storm when the reservoir was already full [13].
The second example of such catastrophe is the failure of the South Fork Dam which occurred on May 31, 1889, which had resulted from overtopping during a large storm event killing 2200 people creating what was known then as the “Johnstown Flood” [14].
Another classical case of dam failure due to miscalculating the inflow design flood and the inadequacy of spillway was the failure of the Walnut Grove Dam. In
February 1890, a combination of three days of heavy rain plus snow melts runoff filled the reservoir behind the South Fork Dam and threatened its collapse. The dam's biggest fault probably was an inadequate emergency spillway meant to keep the dam from being topped. The fate of the dam was sealed when the owner had scrapped one spillway plan in favor of a cheaper one right next to the dam which proved to be far too small. The reservoir filled up during a heavy rainfall storm on March 14-17, 1889. A minor enlargement of the spillway had been ordered in December 1889, but the hydraulic engineer confirmed that the spillway was still too small. For six hours, water topped the 400-foot length of the dam eroding the unprotected side. Workmen tried to widen the spillway in the midst of the driving rain, but it was too late. In the aftermath of the failure, 4 billion gallons of water poured into a canyon above Wickenburg and killed approximately 100-150 people, although no one will really ever know how many people drowned, [15].
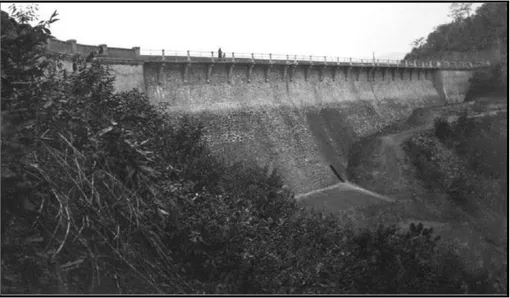
On the continent, similar failures did occur, one example was the Sella Zerbino secondary dam on the Orba River in Italy. This dam was completed in 1935, and it was a straight concrete gravity dam which had a height of 46 feet and a crest length of 360 feet, Figure 8. This dam was a secondary saddle dam which together with the Bric Zerbino main dam formed the Orteglieto reservoir with a total storage of 14,600 acre- ft (18 million m3). Depending on the discharge capacity of the main
gated chute spillway and a pressure valved outlet of the main Bric Zerbino Dam no spillway was provided for the Sella Zerbino secondary dam. On the 13th of August 1935, the dam failed after several hours of very heavy rain, which had generated inflow discharge of about 100,000 cfs far exceeding the combined outflow discharge capacity of the main dam which was only 31,000 cfs that was based on very limited rainfall data, which may have corresponded to only 20 year discharge.
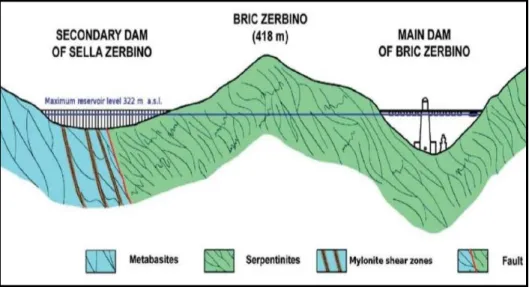
The apparent mode of failure was overtopping, resulting in erosion of the rock at the toe of the dam, in turn causing, sliding and overturning failure. As further evidence of the low quality of the geologic formation, little remained of the secondary dam and its foundation after failure, and geologic investigations after the failure indicated that while the main dam was found on compact serpentinites, the secondary dam was found on highly- jointed schistose rock with intense foliation and slaty cleavage, which many experts concluded were inadequate for dam foundation Figure 9.
Figure 9: Geological section developed After the Dam failure.
The total losses suffered from this failure were at least 111 fatalities, destruction of a hydroelectric plant about 2 miles downstream, destruction of about 90 houses and 4 bridges and leaving a large impact on the downstream farming area which extended for 30 miles in the downstream basin [16], [17]. Overtopping failures of dams due to intensive unexpected rainstorms and resulting floods continued to happen in spite of the advances achieved in hydrological and meteorological sciences. One of the such major catastrophes associated with such an event occurred on the 11th of August 1979 when Machhu Dam II in Juagrat State in India failed. The dam was located on River Machhu near the town of Morbi and it was completed in August 1972. The dam had a storage capacity of 1.1 × 10⁸m3 and a height of 22.56m above the river bed, 164.5m of crest length of overflow section, and a total of 3742m of crest length for the earth dam. The spillway capacity provided was 5663m³/s [18].
As a result of a heavy monsoon storm which had started on August 10, 1979 the flow began to increase down to the Machhu River, first hitting Machhu Dam I and then turning to Machhu Dam II. As the storm intensified, operators at Machhu Dam II began to open the gates to keep the water from rising above maximum levels. By 1:30 AM, all the gates were opened fully except for three gates that were not
properly functioning. Despite the nonoperational gates, the dam was passing 196,000cfs, very close to its full capacity of 200,000. It wasn’t enough, and the water continued to rise. It was early afternoon on August 11, 1979 when water overtopped the earthen embankment on both sides of the masonry spillway leading to the failure of Machhu Dam II. Approximately 90,000 acre-feet of water joined the already heavy flow from the river and rushed into the small town of Lilapar completely inundating it but luckily the population had already been warned and evacuated. Other towns and communities such as Morbi and Vajepar were not so lucky, and the death toll rose dramatically. No one knew for sure how many lives were lost, but estimates ranged from 1,800 to as high as 25,000. Part of the reason the number varied so much was that large mass graves were burned to keep diseases from spreading before proper records or any identification could be completed [19] Examination of rainfall data of past 80 years of stations in and around Machhu basin
revealed: 1) There have been instances when stations in this region received their
respective mean annual rainfall just in a single day;
2) Maximum 1-day rainfall at these stations varied from 180 to 510mm and 2-day from 330 to 680mm and,
3) PMP of 1-day duration worked out to be of the order of 450-1060mm. During the period 10-12 August 1979, Machhu basin up to Machhu Dam II received about 4 times the normal basin rainfall for August. Depth-duration analysis of past rainstorms over this basin revealed that the July 1894 rainstorm gave maximum rain depths for durations of 1 and 2 days while the 10-12 August 1979 rainstorm gave maximum rain depths for 3-day duration. Depth-area-duration analysis of the past severe rainstorms of this region has shown that, by and large, the 1927 rainstorm was the most severe and the rain depths measured in this storm were much higher than the rainstorm of 10-12 August 1979. Apparently, the large volume of water generated during the rainstorm of August 1979 was mainly due to the favorable antecedent basin conditions of moderate to heavy rainfall during the 10 days before the dam failure [20].
A review summary of failed dams in Gujarat State indicated the mistakes committed by civil engineers (!) in the estimation of the Spillway Design Flood (SDF) as given in the following Table (3):
Table 3: Design Floods, Observed, Highest Floods and Revised Spillways Floods for Some Projects, Gujarat, India.
Revised Spillway Flood (Cumecs) Highest Observed Flood (cumecs) Spillway Design Flood As Per Project Report (cumecs) Total Catchment Area (sq. km) River Valley Projects in Gujarat 21662.00 14150.00 11213.00 5486.00 Dharoi 18123.00 11950.00 6654.00 2862.00 Dantwada 5947.00 9340.00 3313.00 735.00 Machhu- 1 20925.00 16307.00 5663.00 1928.00 Machhu- II 12854.00 12900.00 11100.00 1813.00 Damanganga
The above table shows the extent of error in the calculated Spillway Design Discharge and the required discharge leading to overtopping failure, which is the direct result of the inability to predict the safe discharge from available meteorological data [21].
Although dam engineering and hydrological science have improved over the past sixty or seventy years and the understanding of the risks and liabilities associated with the storage of water have increased also, most of this science and understanding are intuitive, comprehensible and accepted by dam owners and designers, but some of it remains not being so and is more mysterious, such as the size of potential extreme rainfall events and the resulting flooding that follows. Often combined effect of a series of storms moving over the same area, dumping heavy rain over several days can cause rainfall totals similar to a single extreme rainfall. Meteorologists refer to this as “storm training”.
It is such “storm training” events that dam designers must, in their designs, guard against and not only against overtopping failures by floods exceeding what is expected from a single extreme rainstorm [22].
Figure 10 shows radar echoes of a series of thunderstorms following the same path one after the other which can cause flash floods.
Figure 10: Example of training echoes of a series of thunderstorms.
7. Overtopping threat and Dams Upgrading
Rehabilitation of dams is required to counter various deficiencies, which develop with time, and also to correct inadequacies on account of revisions of various standards/guidelines.
Deficiencies that are caused primarily by the ageing of a dam include degradation caused by weathering, wear and tear of equipment, damage from natural events, including floods, earthquakes or landslides, and damage from vandalism and war… etc.
Reviewing dams’ safety, especially for older dam, includes among other things the review of the design criteria, assumptions and studies made during the planning and design stage such as those for the inflow design flood and spillway design flood. The question of safety against overtopping stems from spillway adequacy, which is derived from the fact that new methods of analysis and new hydrometeorological data may indicate the use of a larger spillway design flood than the one used in the original design.
As hydrological data records accumulate and new methods are developed for flood discharge estimation and as higher requirements from the society regarding safety issues are expected, a large number of existing dams are in need for safety review,
which may require, among other things, spillway rehabilitation, to improve their flood discharge capacity.
The importance of such a review is supported by many failures of dams caused by unrealistic estimation of these floods and the under sizing of the spillways and outlet structures which have led to overtopping of these dams. Governments and dams’ owners, under the new safety regulations and legislations, are therefore, giving the upgrading of their dams a new look for better safety standards.
One way of increasing dam safety against overtopping, is to raise the dam itself and increase the reservoir volume to improve flood control operations, while a second option may be to modify the outlet works, especially the spillway. Adding another spillway may also be considered in other cases. Brief accounts of some examples of dam upgrading are given hereunder.
7.1 The Katsurazawa Dam- Japan;
Constructed in the upper reaches of the Ikushunbetsu River was completed in 1957. The height of the dam is currently being raised by 11.9m to improve its flood control capacity, irrigation and other functions. It will be reopened as the New Katsurazawa dam. The dam is 63.6m high and 334.3m long concrete gravity dam. Raising the dam crest was under way during 2018, and Figure 11 shows the dam during this stage of construction clearly indicating the extra height being added, while Figure 12 shows the dam after completing the raising operations [23], [24].
Figure 12: New Katsurazawa Dam during heightening operation in 2018 [24]. 7.2 Kasabori Dam-Japan;
On the other hand, is a concrete gravity dam completed in 1964 to serve flood control, fresh water supply and hydroelectric power generation. The height of the dam is 74.5m and has a crest length of 225.5m, and the reservoir’s capacity is 15,4 million m3. This dam has already been raised by 4m to be 78.5m high to improve
its performance and increase its safety, Figure 13 and Figure 14 show this dam after increasing its height [23], [25], [26].
Figure 14: Kasabori Dam before heightening [25]. 7.3 Clarrie Hall Dam-NSW
This example is from New South Wales, which is the 45m high Clarrie Hall rockfill dam completed in the early 1980s. This dam was planned and designed in compliance with the engineering standard of the day. Since the dam was constructed, however, the ability to predict rainfall and understand extreme weather patterns have improved. The revision of the dam safety according to the new requirements of the NSW Dam Safety Committee showed that, although the dam’s spillway can pass safely floods many times greater than the largest flood on record, it will, however, not be able to do the same in extreme rainfall events, even that the probability of such events may be very small. The upgrading works, which were to be completed in 2018, consisted of widening and extending the entrance of the existing spillway chute, constructing a parapet wall across the dam crest to increase freeboard and prevent water from flowing over the dam in an extreme flood event and enable the water to be released safely through the spillway, refer Figure 15 [27].
Figure 15: Clarrie Hall Dam (Left) aerial view showing spillway and embankment; (Right) spillway upgrading work.
7.4 Gloriettes Dam-France
This dam was built in the French Pyrenees Mountains, which is 40 m high concrete arch structure, Figure 16 and Figure 17. The dam was completed in 1951 and it had then a flood discharge system consisting of four over-flow sluices on the dam crest at elevation 1667m. Its capacity was 70m3/s at a maximum operating water level at elevation 1667.8m. As hydrological data records increased and new methods for flood discharge estimation were developed it became necessary to increase the spillway capacity to meet the new standards of dam safety with respect to the risks to society. A new design discharge flood with 1000 year return period and peak discharge of 150m3/s was defined. To compensate for the deficit of 80m3/s, a
complementary new spillway on the right bank was to be constructed. For this purpose, a labyrinth weir, known as the Piano Key Weir (PKW) was selected. For the design of the chute of this new spillway, a solution was adopted after carrying out hydraulic modeling and it consisted of two stepped reaches and an intermediate stilling basin allowing 120° change of direction in order to accommodate the whole chute in the narrow gorge downstream [28].
Figure 16: Gloriettes Dam upstream view.
Figure 17: Gloriettes Dam downstream view showing location of the new Piano Key Weir spillway.
7.5 Nagayasuguchi dam-Japan
This is a concrete gravity dam which was completed in 1955 to serve power generation and flood control in Tokushima prefect in Japan. The dam has a dam crest of 200m length, height of 85.5m and a reservoir volume of 54,278,000m3. The spillway was enlarged to increase its discharge capacity by adding two additional new bays with crest gates, as shown in Figure 18 [23].
Figure 18: Nagayasuguchi dam before and after upgrading [23]. 7.6 Höljes Dam- Sweden
This dam is an embankment dam serving power generation with hydraulic head of 88 m and a spillway on the right side. The dam was constructed on the Klarälven River in the south of Sweden and commissioned in 1962. In that era, dam safety was not a subject of state regulatory surveillance; there were no national directives that governed the dam design, construction, and supervision. The responsibility rested totally with the dam developer. The design flood of a dam was often finalized by multiplying the highest historical flood with a safety factor. For some small or even medium dams, the frequency analysis method was used, in which the 1000-year flood obtained through extrapolation, was treated as the design flood. The spillways were sized according to the dam-safety guidelines that were current at the time of construction, and the hydrological methods previously used to determine the design floods were inaccurate [29].
Based on the new flood determination criteria recommended by the revised dam-safety guidelines, many existing dams are found to have higher design floods than constructed for. The recent revision of the flood criteria was made in 2015. Among other dams the Höljes Dam spillway design capacity was increased to accommodate the increased revised discharge. The final solution is a new 17m wide spillway opening with an upward-going radial gate. The abandoned timber flume located to the right of the existing openings was removed to give place to the new gate, the width of the spillway channel downstream was doubled, and the stilling basin was also enlarged. These works were completed in 2016. Figure 19 shows the dam’s spillway before and after rehabilitation [29].
Figure 19: Höljes dam spillway: (Left) Original layout with two gated openings and a timber flume (Right) After refurbishment, with a 17m new
gated opening added adjacent to the existing ones
.
7.7 Usk Dam-UK
This is a 31m high, 480m long embankment dam with a clay core, which was constructed in 1955. The dam impounds a reservoir of 12.3Mm3 capacity and located in Beacons National Park in South Wales. The reservoir is fed by both direct and indirect catchments and thereafter supplies raw water to Portis and Bryngwyn Water Treatment Works. In 2009, following completion of ongoing research into extreme rainfall, an inspection of Usk Reservoir recommended that an updated flood study be undertaken for the reservoir. In January 2014, a high-level leak was identified at the site, located within natural ground on the right abutment below the spillway. The leak was probably triggered by high rainfall and reservoir levels over the previous month. A dam safety study was carried out by an All Reservoir Panel Engineer (ARPE) and on the recommendation of the Panel, the reservoir has been held at a maximum of 1m below top water level (TWL) since that time. Pre-feasibility studies were completed in 2014, including a flood study and interim assessment of works, and hydraulic modeling. In 2016/2017, a feasibility study to investigate options for upgrading the Usk spillway was done. Many structural modifications were recommended including the existing overflow arrangement which was under capacity; flow was thrown out of the channel by existing baffle blocks, and the downstream stilling basin was largely ineffective. The existing wave wall was structurally deficient for the anticipated wave loading in a probable maximum flood (PMF) event. If the wave wall were to fail in a PMF event, the effective dam wave freeboard would be marginal. There was insufficient evidence to recommend replacement of the wave wall on reservoir safety grounds, but works would be required to remediate the existing wave wall, including a section of the wall adjacent to the spillway bridge, which had rotated, possibly indicating a loss
of support due to erosion. The existing spillway bridge was in poor condition and impinges on flows over the spillway weir in a PMF event.
To address the findings of the study, the scope of work required was:
1) Construction of a reinforced concrete watertight spillway lining to fully contain design flows, including localized wall heightening,
2) Removal of the existing baffle blocks and guide wall, 3) The addition of shear keys for spillway chute stability,
4) Grouting works to close voids and to enhance the existing grout curtain, 5) Addition back of wall drainage along the right side of the spillway chute, 6) Earthworks to achieve the required finished ground profile adjacent to the
spillway walls, and
7) Remedial/repair works to the existing wave wall and spillway approach the wall, [30].
Figure 21: Usk Reservoir Dam Spillway views from downstream, after renovation (Left), before renovation (Right) (Photo by Mat Fascione) [32].
7.8 Folsom Dam- USA
Folsom Dam is a concrete gravity dam on the American River of Northern California in the United States. It was completed in 1955, officially opened the following year. The concrete dam is 100m high and 430m long, flanked by earthen wing dams, refer Figure 22 [33].
Figure 22: Folsom Dam General View [33].
The reservoir is held in place by additional nine saddle dams in the west and southeast sides. The wing dams total a length of 2,700m, while the saddle dams measure 5,040m long combined. The dam and appurtenant dikes total a length of 8,150m. Floodwaters are released by a spillway located on the main dam, controlled
by eight radial gates with a capacity totaling 16,100m3/s as well as a set of works
with a capacity 3,300m3/s. The dam and its reservoir, Folsom Lake, are part of the Central Valley Project, a multipurpose project that provides flood control, hydroelectricity and irrigation and municipal water supply. In order to increase Sacramento's flood protection to 200 year, flood protection (meaning that the area is protected from a flood that has a 0.5% chance of occurring in any given year) the US Army Corps of Engineers recently constructed an auxiliary spillway, which was completed in October 2017 and enables Folsom Dam operators to increase outflows to prevent the lake level from reaching or exceeding the height of the main dam gates [34].
The volume of impounded water behind the dam forms Folsom Lake at the normal pool level is 1.201km3 and a surcharge capacity of 0.14km3 making a total capacity
of 1.341km3. The original capacity was 1.25 km3, but it has been reduced somewhat
due to sedimentation. The dam and reservoir control runoff from a catchment area of 4,860km2, or 87.6% of the 5,500km2 American River watershed. The average
amount of runoff entering the reservoir is 3.3km3, forcing the release of 2.1km3 for
flood control. During a severe storm in December 1964, the inflow into Folsom Lake reached a record high of 7,900 m3 per second, with a river release of 3,300m3
per second. In February 1986, nearly 500,000 people faced the possibility of flooding when engineers at Folsom Dam were forced to open the spillway gates after heavy rains. The flooding was made worse by the failure of the Auburn Dam (a cofferdam) upstream which released an extra 120,000,000m3 into the American River. A peak flow of 7,100m3/s entered Folsom Lake forcing operators at Folsom Dam to open all the spillway gates releasing 3,700m3/s into the American River.
This was 420m3/s more than the safe capacity of downstream levees. Although the
dam and the Sacramento levee system held without major damages, the requisite winter flood control space was increased later on by 50%, from 493Mm3 to 740Mm3
to protect against future floods. In addition, about 41,000,000m3 of sediment carried
down from the mountains were deposited in Folsom Lake, considerably reducing its capacity. The consequence was a reduced capacity to store winter rainfall for summer use. The New Year's Day storm of 1997 was the most severe in recent history, with a total inflow of 1,223Mm3 (equal to the entire capacity of Folsom
Lake) over a 5-day period. However, this time the Bureau of Reclamation was able to limit releases to less than 3,100m3/s.
The 1997 storm was a classic example of a "rain on snow" event, during which a warm tropical storm melted existing snowpack at lower and middle elevations, effectively doubling the volume of runoff. Prior to the New Year's storm, the winter of December 1996 had also been one of the wettest ever recorded, saturating the ground and depositing a considerable amount of snow [35]. The Bureau of Reclamation's Safety of Dams Program determined the risk of flooding in the Sacramento area made it one of the most at-risk communities in the United States. Two projects to increase flood protection have been undertaken. The first will raise the surrounding dikes by 2.1m to increase flood protection. The second, a new additional auxiliary spillway is designed to handle the runoff from large storms and
snowmelt floods that might cause damage in the region. The new spillway is built with gates 15m lower than the existing spillway, allowing for more efficient evacuation of reservoir storage before flooding events. The auxiliary spillway was constructed adjacent to Folsom main concrete dam, and it was substantially completed in 2017. It includes a 1,100-foot-long approach channel beginning in Folsom Reservoir, a concrete control structure with six bulkhead and six radial gates, a 3,100-foot-long auxiliary spillway chute, and a stilling basin that acts as an energy dissipation structure as water discharges and enters the American River, refer Figure 23 (Left) [35] and Figure 23 (Right) [36].
Figure 23: (Left) Auxiliary Spillway before completion [35]. (Right) Auxiliary Spillway after completion [36].
The spillway was substantially completed in October 2017, refer Figure 24.
Figure 24: View of Folsom Dam Auxiliary Spillway after completion showing head works and chute [37].
With the ability to operate the new spillway, the USBR is able to better manage large floods by safely releasing more water from Folsom Reservoir earlier in a storm through both the spillway gates on Folsom Dam and the new control structure’s radial gates (which sit 15m lower), reducing hydrologic risk and leaving more storage capacity in the reservoir.
In Summary, of overtopping, it may be said that enhancing dams’ safety against overtopping may include various actions involving modifications to the spillway or the dam or both. With respect to spillways, once the reviewed design flood is found to be significantly higher than the original design flood, adequacy of spillway capacity needs to be thoroughly reviewed. Solutions may vary between, 1) augmenting the existing spillway capacity through addition of more spillway bays of the same type as existing, 2) provision of breaching sections or fuse plugs; if suitable sites are available. It is preferable to locate such breaching sections on a saddle rather than on the main dam section, or 3) adding a completely new auxiliary spillway.
In all the above cases; however, it is required to investigate the alignment of the surplus water channel till it meets the main channel to assess the likely damages in the surrounding valley in the event of design flood causing a breach, and to make sure, also, that increasing the maximum design outflow from the dam appurtenant structures did not lead to increasing the flood hazards risks to the downstream communities.
Other actions involving the dam itself may be sought by adopting one of the following alternatives depending on their suitability with respect to site conditions, these may be such as: 1) Increasing the freeboard above the maximum designed retention level by a provision of parapet, including strengthening of sections; where necessary so that the flood cushion available will be increased, 2) there may be cases where the dam height itself may have to be increased if freeboard is not sufficient to allow temporary raising of the reservoir level. In such case, structural stability analysis will be made to ensure the stability of the dam against the increased water load, and the safety of the structure must be confirmed.
In cases where structural modifications to the dam or the spillway are not possible then it may be necessary to change the reservoir operation rules to ensure the safe routing of the revised inflow design discharge. In such case, this can be done by increasing the flood storage by lowering the conservation storage level, so that flood moderation will be enhanced, and this may involve in some cases lowering the spillway sill level. This may result; however, in reduction of the benefits such as reducing power generation and/or irrigation storage, but it adds on the positive side as it will involve little investment required for modification; if any.
8. Climate Change and Dams Safety
The operation and planning of basin‐scale water resources systems have historically relied on assuming stationary hydrologic conditions. This approach assumes that past hydrologic conditions are sufficient to guide the future operation and planning of water resources systems and infrastructure. This assumption is threatened nowadays by climate change, and to the notion that both climate and hydrology will
evolve in the future [38]. Global climate change is expected to lead to changes in climatic factors, such as,
variations in extreme temperatures and frequency and extent of heavy precipitation events, which may produce conditions outside current design criteria for dams in many parts of the world.
Changing precipitation temporal patterns together with rising temperature, as may be expected in many cases from climate change, can aggravate flow conditions leading to unprecedented floods. For example, in regions where seasonal snowmelt plays a significant role in annual runoff, hotter temperatures can trigger more rain-on-snow events, which induce faster and often earlier melting such that the combination of rain and melting snow can aggravate spring flooding in a short period of time. Moreover, during the early spring, frozen land prevents melting snow or rainfall from seeping into the ground leading to larger volumes of surface runoff. If seasonal storms are added to all this result is often severe spring flooding. Spring`s storms intensified by climate change factors can also bring several inches of precipitation in just few hours. These heavy rains can lead to severe flooding by over saturating the ground and may lead to earlier filling of reservoirs and leaving no room for next flood events and present chances for dams overtopping. U.S.A., as an example, has thousands of miles of levees and dams that are designed to protect against a certain level of flooding. These structures can erode and weaken over time, and they can also be overtopped, or even fail, during larger flood events [39]. According to the United States Association of Dam Safety Officials, 73 dams have failed since 2010, not including the recent ones in South Carolina. The data shows that most of the failures were caused by extreme weather. The average age of the dams that failed was 62 years [40].
Large dams and other water resources’ systems, as already mentioned have always been based on the assumption that future stream-flow patterns will mirror those of the past, but this is no longer true. Climate change has begun to significantly and unpredictably change precipitation patterns.
In looking to the full picture of climate change on the World scale, more frequent droughts will make many hydropower projects uneconomic, while more extreme rainfall will increase siltation of dams (reducing their useful lifetimes) and increase the risk of dam overtopping failures and catastrophic flood releases.
Unfortunately, large dams’ developers do not currently take climate change into account in their plans. If they do, dams would need much greater capacities to safely pass high floods, and projections of power generation for hydropower projects would have to allow for the probability of new extremes of drought. These factors
would increase the costs and reduce the benefits from dams, thus making other alternatives available to them more attractive.
Predictability of climate change impacts on any particular area or region, however, is not an easy task and may require many detailed studies. This has put a special duty on the various governments to draw up plans regarding climate change impacts on the various aspects of life, which include among other things dam safety. Examples to this are the studies performed by the Scandinavian countries, Norway and Sweden, to face these challenges:
The first is the study of the Norwegian Ministry of Environment on adapting to changing climate issued in 2010. In this report, forecasts on climate change impacts on climatic factors are forecasted, and hence their effects on all aspects of the socio-economic issues in Norway are predicted. A comprehensive action plan with recommended future works is then given to mitigate these impacts. With respect to flood protection and dams’ safety, it stipulates the following:
“Since dam bursts (Overtopping) may pose a risk to human life, dam safety
is given special attention. The regulations for dam safety comprise all dams that can potentially injure a third party. There are approximately 1700 hydropower dams in Norway and around 750 of these dams represent a risk to human life if they should burst. The regulations for dam safety stipulate that dams must be assessed every 15 to 20 years, depending on their consequence class. The purpose of this reassessment is to identify any changes in the loads, such as the size of floods, wind waves, ice pressure, etc., and changes in the regulatory requirements. The design flood magnitude should, for example, be recalculated so that any changes over the past years are identified, including changes as a result of climate change. It appears that the requirements and expectations that are stipulated in statutes and regulations provide satisfactory legal authority for continuous climate change adaptation in the sector, and to ensure that future changes in the climate are taken into account”.
It goes on to recommend the following when applying for a license to build a new dam;
“Climate effects should be a key topic in the impact assessments that are required in connection with the license applications”, [41].
In Sweden, the issue of climate change impacts on dam safety is also taken up very seriously. In a statement published by the Swedish Portal for Climate Change Adaptation, which is the result of cooperation between nineteen Swedish Government Agencies, the following is stated under the title of “Dam safety- Sweden” last updated on April 28, 2016.
“Changes in high water flows are the dominant influence on climate
change and dam safety. Adaptation measures to climate change for hydroelectric dams include reconstruction measures as well as operating and water conservation measures”.
It goes on to state: “If the inflow in a particular situation exceeds the dam plant’s releasing
dam’s limit, exceeding its dimensions, it could lead to dam failure. Adaptation measures for hydroelectric dams include reconstruction measures as well as operating and water conservation measures. Other climate indicators such as wind, torrential rain, temperature changes, ground frost and snow affect dam safety, to a certain extent, but not as much as extreme flows” [42].
9. Conclusions
Thousands of dams have been built in the world during the last one hundred or more years. But most of the older dams were planned and constructed using very little hydrological data and utilizing primitive hydrological methods to estimate the inflow design discharge. This led to many catastrophic overtopping failures causing a great number of fatalities and extensive material damages. The question of safety against overtopping stems from two factors: mainly spillway adequacy which is derived from the fact that new methods of analysis and new hydrometeorological data may indicate the use of a larger spillway design flood than the one used in the original design, and also not having enough freeboard. An extensive revision of the safety of a great number of dams is therefore warranted nowadays, especially that advanced tools of such revisions are available, which include calculation procedures, such as the accurate estimation of the Probable Maximum Floods, and advanced statistical tools to analyze large volumes of flow data and meteorological information, which have been obtained by refined measuring methods. In this case, the probability of exceedance of any value can be reasonably found which is compatible with the require safety level. Upgrading of dams should follow this step to bring these dams to an acceptable standard of safety. The other source of urgency for revisions of dams’ safety against overtopping, among other failure modes, stems from the new and strict government authorities’ regulations requiring risk reduction towards communities that live downstream from dams. It is good to see now that large efforts are being made for upgrading dams, for which only few examples are given in the proceeding paragraphs. Notwithstanding all these efforts; however, the new awareness of climate change impacts on the hydrological cycle should be another reason for governments to draw up plans and issue regulations to consider the risks involved and take necessary actions to mitigate the impacts of climate change on the hydrological cycle, whether in reviewing already constructed dams or licensing the construction of new ones.
References
[1] Association of State Dam Safety Officials (2020). Dams Failures and Incidents. Website last visited on 12.12.2019. https://damsafety.org/dam-failures
[2] Jandora, J. and Riha, J. (2009). The Failure of Embankment dams due to Overtopping. Pp. 17-18 Brno University of technology January 2009. file:///C:/Users/HP/Desktop/Failure%20of%20Embankement%20dams%20d ue%20to%20overtopping.pdf
[3] Lempérière, F. and Vigny, J.P. (2013). Hydrocoop, France L. Deroo, ISL, France. New Methods and Criteria for designing spillways could reduce risks and cost significantly. Posted by Guillaume on July 16 2013 In Flood and
Spillway.
http://www.hydrocoop.org/new-methods-and-criteria-for-designing-spillways-could-reduce-risks-and-costs-significantly/
[4] Issa, I. (2015). Sedimentological and Hydrological Investigation of Mosul Dam. Doctoral Thesis, Refer to Appended paper No 1, Sedimentation Processes and useful life of Mosul dam. Luleå University of Technology, 2015. http://www.diva-portal.org/smash/get/diva2:990809/FULLTEXT01.pdf [5] USBR and USACE (2012). IV-2, Flood Overtopping Failure Best Practices.
Presentation last modified November 2012
https://www.usbr.gov/ssle/damsafety/risk/BestPractices/Presentations/IV-2-20121126-PP.pdf
[6] Racicot, J. and Lord, D. (2015). Will you be able to access your dam during emergencies? Dam access during emergencies PP 913- 924 July 2015.
https://damfailures.org/wp-content/uploads/2015/07/078_Will-You-Be-Able-to-Access-Your-Dam-During-Emergencies.pdf
[7] USACE, USBR, Federal Energy Regulatory Commission, TVA (2019). Overtopping Failure - Best Practices in Dam a Levee Safety Risk Analysis Last Modified June 2017. Presented July 2018.
https://www.usbr.gov/ssle/damsafety/risk/BestPractices/Presentations/F2-OvertoppingWallsStillingBasinFailurePP.pdf
[8] Jandora, J. and Riha, J. (2009). The Failure of Embankment dams due to Overtopping. Page 13 Brno University of technology January 2009. file:///C:/Users/HP/Desktop/Failure%20of%20Embankement%20dams%20d ue%20to%20overtopping.pdf (Page 13)
[9] USACE (1994). Engineering and Design, Flood-Runoff Analysis. Chapter 9 Manual No. 1110-2-1417 31 August 1994.
https://www.publications.usace.army.mil/Portals/76/Publications/EngineerM anuals/EM_1110-2-1417.pdf
![Figure 1: Overtopping vs. other Failure Mechanism (ASDSO), USA [1].](https://thumb-eu.123doks.com/thumbv2/5dokorg/4426866.106500/2.813.116.696.653.988/figure-overtopping-vs-other-failure-mechanism-asdso-usa.webp)

![Figure 5: Definition of terms for wind action [6].](https://thumb-eu.123doks.com/thumbv2/5dokorg/4426866.106500/8.813.111.704.107.454/figure-definition-terms-wind-action.webp)
![Table 1: Recommended Dam Classification System Based on Hazard Potential [10].](https://thumb-eu.123doks.com/thumbv2/5dokorg/4426866.106500/12.813.106.702.464.669/table-recommended-dam-classification-based-hazard-potential.webp)