JHEP01(2015)068
Published for SISSA by SpringerReceived: November 26, 2014 Accepted: December 21, 2014 Published: January 14, 2015
Searches for heavy long-lived charged particles with
the ATLAS detector in proton-proton collisions at
√
s = 8 TeV
The ATLAS collaboration
E-mail: atlas.publications@cern.ch
Abstract: Searches for heavy long-lived charged particles are performed using a data
sample of 19.1 fb−1from proton-proton collisions at a centre-of-mass energy of√s = 8 TeV
collected by the ATLAS detector at the Large Hadron Collider. No excess is observed above the estimated background and limits are placed on the mass of long-lived particles in various supersymmetric models. Long-lived tau sleptons in models with gauge-mediated symmetry breaking are excluded up to masses between 440 and 385 GeV for tan β between 10 and 50, with a 290 GeV limit in the case where only direct tau slepton production is considered. In the context of simplified LeptoSUSY models, where sleptons are stable and have a mass of 300 GeV, squark and gluino masses are excluded up to a mass of 1500 and 1360 GeV, respectively. Directly produced charginos, in simplified models where they are nearly de-generate to the lightest neutralino, are excluded up to a mass of 620 GeV. R-hadrons, composites containing a gluino, bottom squark or top squark, are excluded up to a mass of 1270, 845 and 900 GeV, respectively, using the full detector; and up to a mass of 1260, 835 and 870 GeV using an approach disregarding information from the muon spectrometer.
Keywords: Hadron-Hadron Scattering
JHEP01(2015)068
Contents
1 Introduction 2
2 Data and simulated samples 3
3 ATLAS detector 4
3.1 Pixel detector 5
3.1.1 Specific ionisation measurement 5
3.1.2 Mass measurement 5
3.2 Calorimeters 6
3.3 Muon system 6
3.4 Measurement of β based on time-of-flight 7
4 Online event selection 7
4.1 Single-muon trigger 8
4.2 Missing transverse momentum trigger 8
4.3 Trigger efficiency 8
5 Offline event and candidate selection 9
5.1 Common event and candidate selection 9
5.2 Slepton event and candidate selection 10
5.3 Chargino event and candidate selection 11
5.4 R-hadron event and candidate selection 12
6 Background estimation 13
6.1 Slepton and chargino searches 13
6.2 R-hadron searches 14 7 Systematic uncertainties 14 7.1 Theoretical cross-sections 14 7.2 Signal efficiency 15 7.3 Background estimation 17 8 Results 17 8.1 Slepton limits 17 8.2 Chargino limits 25 8.3 R-hadron limits 27 9 Conclusion 27
JHEP01(2015)068
1 Introduction
Heavy long-lived particles (LLP) are predicted in a range of extensions of the Standard
Model (SM) [1]. R-parity-conserving supersymmetry (SUSY) [2–15] models, such as split
SUSY [16,17], gauge-mediated SUSY breaking (GMSB) [18–25] and LeptoSUSY [26,27],
as well as other scenarios such as universal extra dimensions [28] and leptoquark
exten-sions [29], allow for a variety of LLP states stable enough to be directly identified by the
ATLAS detector. These states include long-lived super-partners of the leptons, quarks and
gluons; sleptons (˜`), squarks (˜q) and gluinos (˜g), respectively; as well as charginos ( ˜χ±1,2),
which together with neutralinos ( ˜χ01−4) are a mixture of super-partners of the Higgs and
W /Z bosons, known as Higgsinos, winos and binos.
When travelling with a speed measurably slower than the speed of light, charged particles can be identified and their mass (m) determined from their measured speed (β) and momentum (p), using the relation m = p/βγ, where γ is the relativistic Lorentz factor. Three different searches are presented in this article, using time-of-flight (TOF) to measure β and specific ionisation energy loss (dE/dx), to measure βγ.
The searches are based almost entirely on the characteristics of the LLP itself, but are further optimised for the different experimental signatures of sleptons, charginos and composite colourless states of a squark or gluino together with light SM quarks or gluons, called R-hadrons.
Long-lived charged sleptons would interact like muons, releasing energy by ionisation as they pass through the ATLAS detector. A search for long-lived sleptons identified in both the inner detector (ID) and in the muon spectrometer (MS) is therefore performed (“slepton search”). The search is optimised for GMSB and LeptoSUSY models. In the former, the
gravitino is the lightest supersymmetric particle (LSP) and the light tau slepton (˜τ1) is the
long-lived, next-to-lightest supersymmetric particle (NLSP). The ˜τ1, the lightest ˜τ mass
eigenstate resulting from the mixture of right-handed and left-handed super-partners of the τ lepton, is predominantly the partner of the right-handed lepton in all models considered here. In addition to GMSB production, results are also interpreted for the case of direct pair production of charged sleptons, independently of the mass spectrum of other SUSY
particles. The recent discovery of the Higgs boson with a mass of about 125 GeV [30,31]
disfavours minimal GMSB within reach of the Large Hadron Collider (LHC). For the Higgs boson to have such mass, the top squark mass would have to be several TeV, and in GMSB the slepton masses are strictly related to the squark masses. However, modifications to minimal GMSB can easily accommodate the observed Higgs mass without changing the
sparticle masses [32–34]. The LeptoSUSY models, characterised by final states with high
multiplicity of leptons and jets, are studied in the context of a simplified model, where all
the neutralinos and charginos are decoupled with the exception of the ˜χ01, and the sleptons
are long-lived and degenerate, with a mass set to 300 GeV, a value motivated by exclusion
limits of previous searches [35]. In these models a substantial fraction of the events would
contain two LLP candidates, a feature also used to discriminate signal from background. Charginos can be long-lived in scenarios where the LSP is a nearly pure neutral wino and is mass-degenerate with the charged wino. The chargino signature in the detector
JHEP01(2015)068
would be the same as for a slepton, but the dominant production is in chargino-neutralino
( ˜χ±1χ˜01) pairs, where the neutralino leaves the apparatus undetected. As a result, the event
would have one LLP and significant missing transverse momentum (~pTmiss, with magnitude
denoted by Emiss
T ). This signature is pursued in a dedicated “chargino search”.
Coloured LLPs (˜q and ˜g) would hadronise forming R-hadrons, bound states composed
of the LLP and light SM quarks or gluons. They may emerge as charged or neutral states from the pp collision and be converted to a state with a different charge by interactions with the detector material, and thus arrive as neutral, charged or doubly charged particles in the MS. Searches for R-hadrons are performed following two different approaches: using all available detector information (“full-detector R-hadron search”), or disregarding all information from the MS (“MS-agnostic R-hadron search”). The latter case is independent of the modelling of R-hadron interactions with material in the calorimeters.
Previous collider searches for charged LLPs have been performed at LEP [36–39],
HERA [40], the Tevatron [41–43], and the LHC [35,44,45].
2 Data and simulated samples
The work presented in this article is based on 19.1 fb−1 of pp collision data collected at a
centre-of-mass energy √s = 8 TeV in 2012. Events are selected online by trigger
require-ments either on the presence of muons or large ETmiss. Events collected during times when
a problem was present in one of the relevant sub-detectors are later rejected offline. A
separate stream of 19.8 fb−1 pp collision data and Monte Carlo (MC) simulation Z → µµ
samples are used for timing resolution studies. Simulated signal samples are used to study the expected signal behaviour and to set limits.
All MC simulation samples are passed through a detector simulation [46] based on
Geant4 [47] and a model of the detector electronics. The effect of multiple pp
interac-tions in the same or a nearby bunch crossing (pile-up) is taken into account by
overlay-ing additional minimum-bias collision events simulated usoverlay-ing Pythia8 [48] v. 8.170 and
reweighting the distribution of the average number of interactions per bunch crossing in MC simulation to that observed in data. All events are subsequently processed using the same reconstruction algorithms and analysis chain as the data.
The GMSB samples are generated, using Herwig++ [49] v. 2.5.2 along with the
UEEE3 [50] tune and the CTEQ6L1 [51] parton distribution function (PDF) set, with
the following model parameters: number of super-multiplets in the messenger sector,
N5 = 3, messenger mass scale, mmessenger = 250 TeV, sign of the Higgsino mass
param-eter, sign(µ) = 1, and Cgrav, the scale factor for the gravitino mass which determines the
NLSP lifetime, set to 5000 to ensure that the NLSP does not decay inside the detector. The ratio of the vacuum expectation values of the two Higgs doublets (tan β) is varied between 10 and 50. The SUSY-breaking scale (Λ) is chosen between 80 and 160 TeV and
the corresponding ˜τ1 masses vary from 175 to 510 GeV, in order to cover the regions of
parameter space accessible to this analysis and not excluded by previous searches. The
masses of the right-handed ˜e (or ˜µ) are larger than that of ˜τ1 by 2.7–93 GeV for tan β
JHEP01(2015)068
to 709 GeV as a function of Λ and is independent of tan β. The lightest chargino ( ˜χ±1) mass
varies from 540 to 940 GeV, and is 210 to 260 GeV higher than the neutralino mass, with a small dependence on tan β. The dependence of the mass splitting between the chargino and lightest neutralino on tan β varies from 1% at Λ = 80 TeV to 3% at Λ = 160 TeV.
The LeptoSUSY samples are simulated in MadGraph5 [52] v. 1.5.4 using the
CTEQ6L1 PDF set, with Bridge [53] v. 2.24 used for decaying the squarks, and Pythia8
v. 8.170 along with the AU2 [54,55] tune for parton showering. The sleptons are long-lived
and set to be degenerate with a mass of 300 GeV. The third-generation squarks are as-sumed to be very heavy (10 TeV). The masses of the first- and second-generation squarks (gluinos) are varied between 600 GeV and 3 TeV (950 GeV and 3 TeV) assuming a fixed
mass of the ˜χ01 of 400 GeV.
Samples of long-lived charginos are generated using Herwig++ v. 2.6.3 along with the UEEE3 tune and the CTEQ6L1 PDF set, according to simplified models where the lightest chargino and lightest neutralino are nearly degenerate, and the chargino is the LLP. Starting from a self-consistent model with a chargino/neutralino mass of about 658 GeV (140 MeV mass splitting), the simplified version is obtained by moving the chargino and neutralino masses up and down in a range between 100 and 800 GeV, keeping the mass
splitting constant. In addition, the chargino is forced to remain stable and the other
particle masses are set to values too high to be produced at the LHC. Production of ˜χ±1χ˜∓1
( ˜χ±1χ˜01) constitutes about one third (two thirds) of the events generated in these samples.
For the R-hadron samples, pair production of gluinos, bottom squarks (sbottoms)
and top squarks (stops) is simulated in Pythia6 [56] v. 6.4.27, incorporating specialised
hadronisation routines [57, 58] to produce final states containing R-hadrons [59], along
with the AUET2B [60] tune and the CTEQ6L1 PDF set. Interactions of R-hadrons with
matter are handled by dedicated routines for Geant4 based on different scattering models
with alternative assumptions [61]. The model for gluino R-hadron interactions, using a
gluino-ball fraction of ten percent, is referred to as the generic model. For sbottom and stop R-hadrons a triple Regge interaction model is assumed.
Samples of Z → µµ events are simulated using Powheg-Box [62] r. 1556 and Pythia8
v. 8.170 along with the AU2 tune and the CT10 [63] PDF set and used only for calibration
and studies of systematic uncertainties.
3 ATLAS detector
The ATLAS detector [64] is a multi-purpose particle detector with a forward-backward
symmetric cylindrical geometry and near 4π coverage in solid angle.1 The search for
heavy long-lived charged particles relies on measurements of ionisation and time-of-flight, therefore the detector components providing these observables are described below.
1
ATLAS uses a right-handed coordinate system with its origin at the nominal interaction point in the centre of the detector and the z-axis coinciding with the axis of the beam pipe. The x-axis points from the interaction point to the centre of the LHC ring, and the y-axis points upward. Cylindrical coordinates (r, φ) are used in the transverse plane, φ being the azimuthal angle around the beam pipe. The pseudorapidity is defined in terms of the polar angle θ as η = − ln tan(θ/2).
JHEP01(2015)068
3.1 Pixel detector
As the innermost detector system in ATLAS, the silicon pixel detector typically provides at least three high-precision spatial measurements for each track in the region |η| < 2.5 at radial distances from the LHC beam line of r < 15 cm. The sensors in the pixel barrel (|η| < 2) are placed on three concentric cylinders around the beam-line, whereas sensors in the end-cap (|η| > 2) are located on three disks perpendicular to the beam axis on each side of the barrel. The data are only read out if the signal is larger than a set threshold.
3.1.1 Specific ionisation measurement
The charge collected in each pixel is measured using the time-over-threshold (ToT) tech-nique. The calibration of the ToT to the charge deposition in each pixel is established in dedicated scans, and therefore the ToT measurement yields the energy loss of a charged particle in the pixel detector.
The maximum ToT value corresponds to 8.5 times the average charge released by a min-imum ionising particle (MIP) with a track perpendicular to the silicon detectors and leaving all of its ionisation charge on a single pixel. If this value is exceeded, no hit is registered.
In LHC collisions the charge generated by a charged particle crossing a layer of the pixel detector is usually contained in a few pixels. Neighbouring pixels are joined together to form clusters and the charge of a cluster is calculated by summing the charges of all pixels after calibration correction. The specific energy loss (dE/dx) is measured using the average of all individual cluster charge measurements for the clusters associated with the track, typically three measurements. To reduce the effect of tails in the expected Landau distribution, the average is evaluated after removing the cluster with the highest charge (the two clusters with the highest charge are removed for tracks having five or more clusters).
3.1.2 Mass measurement
The masses of slow charged particles can be measured using the ID information by evalu-ating a function that parameterises the expected behaviour of the specific energy loss as a function of the particle βγ. The parametric function describing the relationship between the
most probable value of the specific energy loss (MPVdE
dx) and βγ was found by searching for
a functional form which adequately describes the simulated data [65]. MPVdE
dx is described
via five fixed parameters p1–p5, evaluated separately for data and MC simulation, using
MPVdE dx(βγ) = p1 βp3 ln(1 + (|p2|βγ) p5) − p 4. (3.1)
The most probable value of dE/dx for MIPs is about 1.2 MeVg−1cm2 with a spread
of about 0.2 MeVg−1cm2 and a slight η dependence, increasing by about 10% from
low-|η| to high-low-|η| regions [66]. The measurable βγ range lies between 0.2 and 1.5, the lower
bound being defined by the overflow in the ToT spectrum, and the upper bound by the overlapping distributions in the relativistic-rise branch of the curve.
A mass estimate mβγ = p/βγ can be obtained for all tracks with a measured specific
energy loss dE/dx above the value for MIPs, using their reconstructed momentum p and βγ evaluated from dE/dx. The stability of the measurement of the specific energy loss as
JHEP01(2015)068
a function of time is monitored through measurements of the masses of kaons and protons with percent-level precision and is found to have a variation of less than one percent. For LLPs considered in this article the expected dE/dx values can be significantly larger than those of SM particles, allowing their identification based on this information. The RMS of
the mβγ distribution obtained in this way is about 20%.
3.2 Calorimeters
Liquid argon is used as the active detector medium in the electromagnetic (EM) barrel and end-cap calorimeters, as well as in the hadronic end-cap (HEC) calorimeter. All are sampling calorimeters, using lead plates as absorbers material for the EM calorimeters and copper plates as absorbers material for the HEC calorimeter. The barrel EM calorimeter covers the region |η| < 1.475 and consists of a pre-sampler and three layers at radii from 150 to 197 cm. The EM end-cap calorimeter consists of three layers in the region 1.375 < |η| < 2.5 (two for 2.5 < |η| < 3.2) and a pre-sampler for 1.5 < |η| < 1.8. The four layers of the HEC calorimeter cover the range 1.5 < |η| < 3.2. The time of the energy deposition in each element of the calorimeter (cell) is measured. The typical cell time resolution is 1.5–2.0 ns for energy deposits of 1 GeV in the EM, 2.0–2.5 ns for energy deposits of 10 GeV in the HEC. The ATLAS tile calorimeter is a cylindrical hadronic sampling calorimeter. It uses steel as the absorber material and plastic scintillators as the active material. It covers radii from 228 to 423 cm. The calorimeter is subdivided into a central barrel covering |η| . 1.0 and extended barrels covering 0.8 ≤ |η| ≤ 1.7. Each barrel part is divided into 64 modules in φ and the cells in each module are divided into three layers. The typical cell time resolution is 0.6–0.8 ns for energy deposits of 1 GeV. The time resolution is approximately
proportional to E−1/2.
3.3 Muon system
The muon spectrometer forms the outer part of the ATLAS detector, detects charged particles exiting the calorimeters and measures their momenta in the pseudorapidity range |η| < 2.7. It is also designed to trigger on these particles in the region |η| < 2.4. In the barrel the chambers are arranged in three concentric cylindrical shells around the beam axis with radii of 5 to 10 m, while in the two end-caps the muon chambers are arranged in three wheels that are perpendicular to the beam axis at distances between 7.4 and 21.5 m to the nominal interaction point.
The precision momentum measurement is performed by monitored drift tube (MDT) chambers. These chambers consist of three to eight layers of drift tubes covering the region |η| < 2.7, except in the innermost tracking layer of the forward region (2.0 < |η| < 2.7), where cathode strip chambers are used. Resistive plate chambers (RPC) in the barrel region (|η| < 1.05) and thin gap chambers (TGC) in the end-cap (1.05 < |η| < 2.4) provide a fast first-level trigger (level-1). Muons typically have around 20 MDT hits and 10 RPC hits if they traverse the MS barrel, with a typical time resolution of 3.5 ns and 0.6–1.1 ns, respectively. In contrast to the standard ATLAS muon reconstruction, candidate tracks are refitted allowing their velocity to be less than the speed of light, in order to associate all the MDT hits produced by the LLP with the candidate.
JHEP01(2015)068
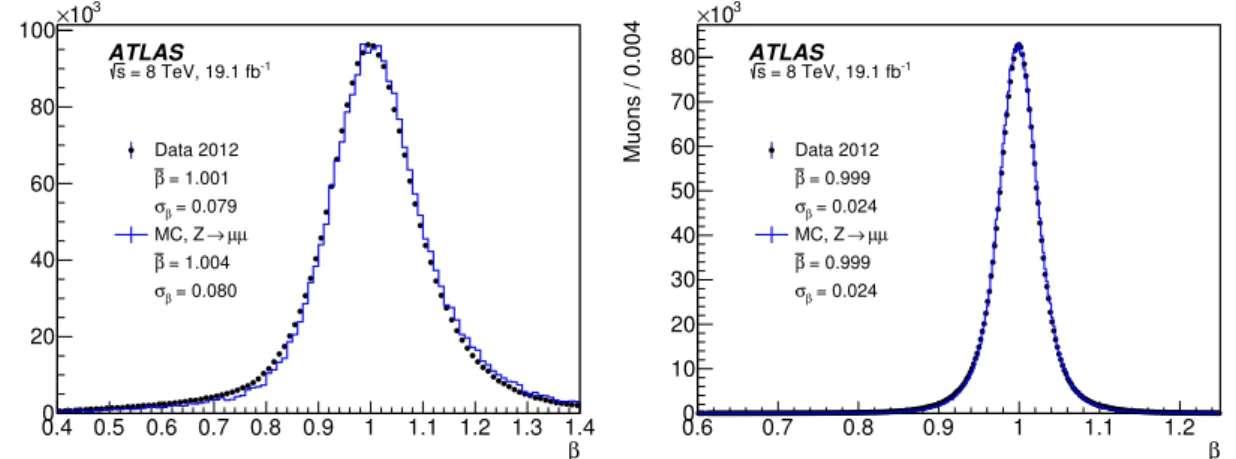
β 0.4 0.5 0.6 0.7 0.8 0.9 1 1.1 1.2 1.3 1.4 Muons / 0.004 0 20 40 60 80 100×103 Data 2012 = 1.001 β = 0.079 β σ µ µ → MC, Z = 1.004 β = 0.080 β σ ATLAS -1 = 8 TeV, 19.1 fb s β 0.6 0.7 0.8 0.9 1 1.1 1.2 Muons / 0.004 0 10 20 30 40 50 60 70 80 3 10 × Data 2012 = 0.999 β = 0.024 β σ µ µ → MC, Z = 0.999 β = 0.024 β σ ATLAS -1 = 8 TeV, 19.1 fb sFigure 1. Distribution of the muon speed, β, from the calorimeter (left) and combined measure-ments of calorimeter and muon spectrometer (right) obtained for selected Z → µµ events in data (points) and smeared MC simulation (line).
3.4 Measurement of β based on time-of-flight
The calorimeters, RPCs and MDTs have sufficiently accurate timing to distinguish between highly relativistic SM particles and slower LLPs of interest to the searches described in this article. The measured time-of-flight to calorimeter cells and MS hits crossed by the can-didate track are used to measure the speed β. Custom calibration methods using Z → µµ events are used to achieve optimal β resolution. The times are first corrected collectively for any timing differences between the LHC and ATLAS in order to compensate for collec-tive time-dependent effects (average for each LHC store) and then individually by detector element for any offsets. The calibration also provides a β uncertainty for each detector el-ement. In order to obtain the correct signal efficiency, hit time measurements in simulated Z → µµ samples are smeared to correspond to the distribution observed in data. Each hit is smeared by the time resolution observed in the detector element where it was measured. The individual β measurements are combined in a weighted average, using the errors determined per detector element in the calibration. The combination is done first for each sub-detector (calorimeters, MDT, RPC) separately, and then for the entire detector. At
each step the measurements are required to be consistent, as described in section 5.2.
Depending on η, the β resolution for muons with β = 1 is 2.4–2.6% for the RPC, 3.7–4.9% for the MDT and about 8% for the calorimeter. Though the calorimeter β resolution is less precise than that of the MS, it provides high efficiency and the model independence of the MS-agnostic R-hadron search.
Figure 1 shows the β from the calorimeter (left) and combined measurements (right)
obtained for selected Z → µµ events in data and smeared MC simulation. The mean values
and resolution of the combined β are ¯β = 0.999 and σβ = 0.024, respectively, for both data
and MC simulation. The RMS of the mβ distribution obtained this way is about 10% (20%
for the calorimeter only measurement).
4 Online event selection
JHEP01(2015)068
4.1 Single-muon trigger
The muon trigger and its performance in 2012 data are described in detail in reference [67].
The searches use un-prescaled muon triggers with a transverse momentum (pT) threshold of
24 GeV. Offline candidates are selected with pT > 70 GeV, well above the trigger threshold.
Events selected by level-1 muon triggers are accepted and passed to the high-level trigger only if assigned to the collision bunch crossing. Late triggers due to the arrival of particles in the next bunch crossing are thus lost. The trigger efficiency for particles arriving late at the MS cannot be assessed from data, where the vast majority of candi-dates are in-time muons and where low-β measurements are due to mismeasurement. The trigger efficiency is thus obtained from simulated signal events. However, the quality of the estimate depends on the accuracy of the timing implementation in the simulation. A detailed emulation of the level-1 electronics circuits, including their timing, is applied to simulated events. The probability that an LLP triggers the event increases roughly linearly from zero at β = 0.62 to a maximum value of about 70% at β = 0.82 for LLPs that reach the MS. A systematic uncertainty is assigned to account for differences in the input time
measurements between data and simulated events (see section 7.2).
GMSB and LeptoSUSY events have two LLPs and possibly muons present in the decay chain, so the likelihood of one of the penetrating particles arriving in the collision bunch crossing is high. Chargino events have no muons, and since in the majority of the chargino events there is only one LLP, the efficiency is lower. The estimated trigger efficiency for GMSB slepton events is between 65% and 80%, for LeptoSUSY events between 75% and 90% and for stable-chargino events between 24% and 64%. Muon triggers are less efficient for R-hadrons (0–20%), where one or both of the R-hadrons may be neutral as they enter the MS and β is typically low.
4.2 Missing transverse momentum trigger
The EmissT quantity used at the trigger level is based on the calorimeter only and does
not include any corrections for muon-like objects. LLPs deposit very little of their energy
in the calorimeter, and therefore in most signal types Emiss
T is dominated by initial state
radiation (ISR) jets recoiling against the two LLPs. When charginos and neutralinos decay
into long-lived sleptons, additional EmissT may result from neutrinos.
The R-hadron searches use un-prescaled ETmiss triggers [68] with thresholds as low as
60 GeV, while the other searches use thresholds between 70 and 80 GeV. The onset of these triggers is at about 10 GeV below the threshold, while full efficiency is reached at about 70–80 GeV above the threshold. Unlike the single-muon trigger, there is no loss of efficiency
for the Emiss
T triggers when LLPs have low β.
4.3 Trigger efficiency
In all the searches, except the MS-agnostic R-hadron search, a logical OR of the muon
and ETmiss triggers described above is used. Depending on the mass of the LLP, the total
trigger efficiency is between 80% and 90% for GMSB slepton events, between 40% and 66% for events with stable charginos, above 95% for LeptoSUSY events and between 22% and
JHEP01(2015)068
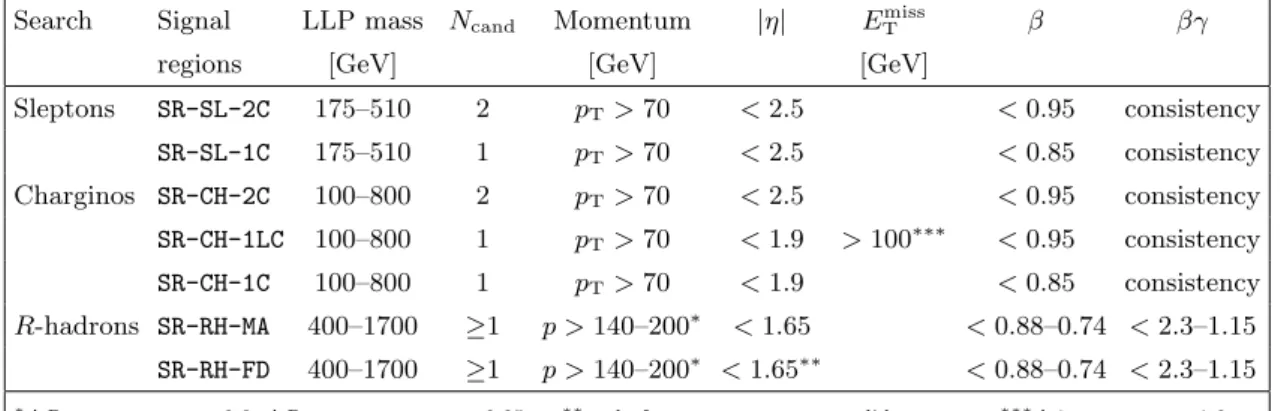
Search Signal LLP mass Ncand Momentum |η| ETmiss β βγ
regions [GeV] [GeV] [GeV]
Sleptons SR-SL-2C 175–510 2 pT> 70 < 2.5 < 0.95 consistency SR-SL-1C 175–510 1 pT> 70 < 2.5 < 0.85 consistency Charginos SR-CH-2C 100–800 2 pT> 70 < 2.5 < 0.95 consistency SR-CH-1LC 100–800 1 pT> 70 < 1.9 > 100∗∗∗ < 0.95 consistency SR-CH-1C 100–800 1 pT> 70 < 1.9 < 0.85 consistency R-hadrons SR-RH-MA 400–1700 ≥1 p > 140–200∗ < 1.65 < 0.88–0.74 < 2.3–1.15 SR-RH-FD 400–1700 ≥1 p > 140–200∗ < 1.65∗∗ < 0.88–0.74 < 2.3–1.15 ∗∆R
jet,pT>40GeV> 0.3, ∆Rtrack,pT>10GeV> 0.25 ∗∗only for id+calorimeter candidates ∗∗∗∆φLLP,EmissT > 1.0
Table 1. Overview of signal regions (SRs), the covered mass range and selection requirements for different types of long-lived particles. The signal regions for the same search are mutually exclusive and combined in the limit setting, except for two R-hadron SRs, which each probe a different hy-pothesis for the particle interactions with the detector. Ncanddenotes the number of LLP candidates
considered in the given SR. The β and βγ requirements listed for the R-hadron SRs are due to their mass dependence. In addition, all selections have cosmic-ray muon and Z vetoes. For sleptons and charginos βγ is only used to check for consistency with β by requiring β(TOF) − β(dE/dx) < 5σ.
35%, depending on mass and type, for events containing R-hadrons. In the MS-agnostic
R-hadron search only the ETmisstriggers are used, with an efficiency between 21% and 26%.
5 Offline event and candidate selection
Three different signal types are studied: sleptons, charginos and R-hadrons. An overall trigger and event-quality selection, common to all searches, is applied. Given the different expected interactions with the ATLAS detector, a dedicated selection, containing event-based as well as candidate-event-based criteria, is optimised and applied for each signal type. An
overview of the signal regions can be found in table1.
5.1 Common event and candidate selection
Collision events are selected by requiring a good primary vertex. Vertices are reconstructed requiring at least three tracks reconstructed in the ID and consistent with the beam spot.
The primary vertex is defined as the one with the highest P p2
T of associated tracks.
Since the background increases significantly at high |η|, due to the large momenta of candidates and decreased ID momentum resolution, those regions are excluded from the definition of signal regions where they may add large backgrounds and where the signal is expected to be more centrally produced (high masses). High-|η| regions are considered for selections where other stringent requirements reduce the background, such as two muons or LLP candidates in the event and/or a precise β measurement.
Different requirements on pTand p are placed in the various searches, as pTis more
suit-able to suppress very boosted SM background in cases including the high-|η| regions, while the the use of p is advantageous in searches focussing on low-|η| regions (e.g. R-hadrons), as it is more closely related to mass.
JHEP01(2015)068
Additional requirements on β (βγ) and mβ (mβγ) are used to reduce background. The
presence of an LLP signal is searched for in a distribution of mβ (mβγ), where the signal
should peak and background be continuous.
5.2 Slepton event and candidate selection
In GMSB and LeptoSUSY events, the weak coupling of the gravitino to the other particles
implies that only the NLSP (˜τ1 for the models of interest) decays to the gravitino. As
a result of this and of R-parity conservation, at least two ˜τ1 sleptons are expected in
each GMSB event, both with a high probability of being observed. Therefore the slepton searches require at least two loosely identified muon-like objects reconstructed using the
techniques described in reference [69], which will be called LLP candidates in the following.
By applying this selection criterion, background from W and multi-jet events is reduced. Two sets of selection criteria are applied on a per-candidate basis with details given below. A loose selection with high efficiency is used to select candidates in events where there are
two LLP candidates, since a background event would very rarely have two high-pT muons,
both with poorly measured β and a large reconstructed mass. Events having two loose candidates, independent of their charge, fall in the two-candidate signal region (SR-SL-2C). In events where only one candidate passes the loose selection, that candidate is required to pass an additional, tighter selection. Such events are collected in a mutually exclusive one-candidate signal region (SR-SL-1C).
Candidates in the loose slepton selection are required to have pT > 70 GeV and |η| <
2.5. Any two candidates that combine to give an invariant mass within 10 GeV of the Z boson mass are both rejected. Candidates are also required to have associated hits in at least two of the three layers of precision measurement chambers in the MS. Cosmic-ray muons are rejected by a topological requirement on the combination of any two candidates
with opposite η and φ. The number of degrees of freedom in the β measurement2 is
required to be larger than three. LLP candidates are expected to have low β values and these values are expected to be consistent between individual measurements, both in the same detector system and between different detectors, while in the case of muons a low β value would be due to a poor measurement in only one of the detectors. The different detector system measurements of β are required to be pair-wise consistent at the 3σ level, and the combined β to be consistent with the βγ estimated in the pixel detector within 5σ. The β resolution is estimated for each candidate, and the βγ resolution is about 11%. The βγ measurement is translated to β and compared to the value of β based on time-of-flight for the consistency check. There is no requirement on the value of βγ obtained from the pixel dE/dx measurement in the searches that require consistency. As a result, many candidates are in the MIP region. Those are required to have β consistent with the MIP hypothesis. Finally, in order to reduce the muon background, the combined β measurement is required to be between 0.2 and 0.95.
2The number of calorimeter cells plus MS hits contributing to the β measurement minus the number of
JHEP01(2015)068
To pass the tighter slepton selection used for SR-SL-1C, a candidate is additionally required to have at least two separate detector systems measuring β and the number of degrees of freedom of the β measurement is required to be at least six.
Events with one candidate are then divided between SR-SL-1C, where the combined β measurement is required to be less than 0.85, and a control region with 0.85 < β < 0.95, used to cross-check the background estimation.
Finally, the measured mass, mβ = p/βγ, calculated from the candidate’s momentum
and its measured β, is required to be above some value. The value is chosen according to
the mass of the the hypothetical ˜τ1 mass in the given model, so as to achieve 99% signal
efficiency with respect to the earlier selection. For SR-SL-2C, both masses are required to be above the chosen value.
Typical efficiencies for signal events to satisfy all criteria including the mass require-ment are 30% for SR-SL-2C and 20% for SR-SL-1C, giving 50% efficiency in total. The efficiencies are similar for events with pair-produced sleptons and events where sleptons arise from directly produced, decaying charginos and neutralinos.
5.3 Chargino event and candidate selection
Except for the two-muon requirement, the chargino event selection is the same as the slepton selection. For chargino-pair production, the events would be very similar to slepton events, while for chargino-neutralino production a single LLP candidate is accompanied by
Emiss
T caused by the neutralino. The chargino and neutralino are typically well-separated
in φ, therefore the ~pTmiss is expected to point in the opposite direction to the reconstructed
LLP. The events are divided into three signal regions. Events with two LLP candidates passing the loose selection, as before independent of their charge, are in the two-candidate signal region (SR-CH-2C). This selection is motivated by pair production of charginos.
Events with one candidate passing the loose selection must have ETmiss >100 GeV and an
azimuthal angular distance between the LLP candidate and the ~pTmiss ∆φ > 1, to be
included in the one-loose-candidate signal region (SR-CH-1LC). SR-CH-1LC is motivated by the chargino-neutralino production mode. Finally if an event has neither two candidates
nor large ETmiss, one given candidate has to pass the tighter selection and have β < 0.85
to be included in the one-candidate signal region (SR-CH-1C). All three signal regions are mutually exclusive.
The requirements for a candidate to pass the loose or the tight selection are the same as for the slepton search. In addition, in both SR-CH-1LC and SR-CH-1C, candidates with |η| > 1.9 are excluded.
A mass selection, chosen to achieve 99% signal efficiency with respect the earlier se-lection, is applied to the candidate mass. This requirement depends on the hypothetical chargino mass and differs by model. For SR-CH-2C, both masses are required to be above the chosen value.
Typical efficiencies for signal events to satisfy all selection criteria including the mass requirement are 5–6% for SR-CH-2C, 10–13% for SR-CH-1LC and 3% for SR-CH-1C, giving 18–22% efficiency in total, depending on the mass of the chargino candidates. Looking sep-arately at the two different production modes, the efficiency of SR-CH-2C for chargino-pair
JHEP01(2015)068
production is 15–20% and the efficiency of SR-CH-1LC for chargino–neutralino production is 12–17%.
5.4 R-hadron event and candidate selection
Since the R-hadron contains light quarks and gluons in addition to the squark or gluino, the charge of the R-hadron can change following nuclear interactions with the detector material. This possibility makes it difficult to rely on a single detection mechanism without any loss of detection efficiency, as a neutral state would not be detected until the next nuclear interaction occurs. Some of the main hadronic states resulting from such charge exchange in the models considered are neutral. In a search for R-hadrons that are produced charged, it is therefore natural to take an inside-out approach, starting from the ID track and adding discriminators from outer detector systems, in case a signal is seen along the extrapolated track. This is reflected in the two different R-hadron approaches.
In anid+calorimeterselection, candidates are required to have a good-quality ID track
with pT > 50 GeV and |η| < 1.65. To ensure reliable estimates of βγ and β, candidates
must not be within an η–φ distance ∆R = q
(∆η)2+ (∆φ)2 = 0.3 of any jet with pT >
40 GeV, reconstructed from calorimeter energy clusters using the anti-ktjet algorithm [70]
with distance parameter set to 0.4. Furthermore, candidates must not have any nearby
(∆R < 0.25) tracks with pT> 10 GeV nor have pixel hits shared with other tracks. The Z
boson mass window and cosmic-ray muon rejection are applied in the same way as in the slepton searches. Candidates must have a good dE/dx measurement and a good estimate of β. The uncertainty on the calorimeter-only β is required to be less than 12%.
In acombinedselection, candidates are required to have a combined track, reconstructed
in both the ID and the MS. With the exception of the explicit η requirement, the ID
requirements for thecombined candidate as well as the Z boson mass window, cosmic-ray
muon rejection and dE/dx measurement are the same as for the id+calorimeterselection.
The estimate of β, based on a combination of internally consistent measurements in the calorimeter, the RPCs and the MDTs, is required to have an uncertainty of less than 5%. In the full-detector R-hadron search, candidates are first checked for compatibility with thecombinedselection and only when failing, for compatibility with theid+calorimeter
se-lection. The two types of candidates are therefore mutually exclusive and events containing at least one candidate fulfilling either of the two selections are considered in the full-detector signal region (SR-RH-FD).
The independent MS-agnostic R-hadron search, ignoring MS information, as well as the
muon trigger, considers events containing at least one candidate passing theid+calorimeter
selection (SR-RH-MA).
In the approximately 15% of events with more than one candidate, a candidate passing the combined selection is preferred; if there are two or more candidates from the same cat-egory, one is chosen at random and the others are discarded. In both R-hadron searches, additional requirements on a minimum momentum and maximum values for β and βγ are
set, depending on the mass hypothesis in question. The two R-hadron mass estimates mβγ
JHEP01(2015)068
minus twice the width of the mass peak, which is typically around 20% of the peak mass, leading to an efficiency of more than 95%. All mass and momentum requirements are the same for gluinos, sbottoms and stops, while the requirements on βγ and β are optimised separately to account for the lower expected cross-section in the sbottom and stop cases. The signal efficiency for gluino, sbottom and stop R-hadrons is typically 8–12%, 5–9% and 8–13%, respectively, in the MS-agnostic search and 8–15%, 8–11% and 15–18%, re-spectively, in the full-detector search, depending on the mass hypothesis. While stops and sbottoms have the same cross-section, sbottoms tend to hadronise into neutral states (57%) slightly more often than stops (43%). In addition, more sbottom-based R-hadrons convert into neutral states, as they traverse material, than stop-based R-hadrons do, reducing the efficiency of the sbottom search compared to the stop one.
6 Background estimation
The background for all searches is almost entirely composed of high-pT muons with
mis-measured β and/or large ionisation. Most of this instrumental background is rejected by requiring a β measurement significantly smaller than one and by requiring consistency between the different, independent β and βγ measurements. The background estimate is derived from data in all cases. The background mass distribution can be estimated by producing random pairings of momentum and β (and βγ where applicable) according to the distributions seen in the data. The procedure relies on two validated assumptions: that the signal-to-background ratio before applying selections on β (βγ) is small, and that the β (βγ) distribution for background candidates is due to measurement resolution and is therefore independent of the source of the candidate and its momentum.
To avoid β-momentum measurement correlations arising from different detector sys-tems and for different pseudorapidity regions, the detector is divided into eight η regions so that the β resolution within each region is similar.
6.1 Slepton and chargino searches
The muon β probability density function (pdf) in each η region is the distribution of the measured β of muons in the region normalised to unity, and is obtained separately for each
signal region from candidates passing the selection described in sections 5.2 and 5.3, but
without the requirements on the value of β or mβ.
The background is then estimated by drawing a random β from the appropriate muon
β pdf and calculating mβ using the momentum of the reconstructed LLP candidates only
in cases where the β satisfies the selection requirement. Events with two candidates before the β requirement are used to estimate the background in SR-SL-2C and SR-CH-2C. The statistical uncertainty of the background estimate is reduced by repeating this procedure many times for each candidate and dividing the resulting distribution by the number of repetitions.
JHEP01(2015)068
GMSB LeptoSUSY
Source SR-SL-1C SR-SL-2C SR-SL-1C SR-SL-2C
Signal size — theory 5 5 1–54 1–54
Signal efficiency
· Trigger efficiency 3.2 3.2 3.1 3.1
· ISR ≤0.5 ≤0.5 ≤0.5 ≤0.5
· Pixel dE/dx calibration 1.1 1.1 1.1 1.1
· β timing calibration 1.0 2.0 1.0 2.0
Total signal efficiency 3.6 4.0 3.5 3.9
Luminosity 2.8 2.8 2.8 2.8
Background estimate 10–12 8.3–9 10–12 8.3–9
Table 2. Summary of systematic uncertainties for the slepton searches (given in percent). Ranges indicate a mass dependence for the given uncertainty (low mass to high mass).
6.2 R-hadron searches
In the R-hadron searches, the pdfs are produced from candidates in data, which satisfy the
selection criteria, except those on β, βγ, mβ and mβγ. As each particle/mass hypothesis
has a different selection, the background estimates are produced in each case.
The momentum pdf is produced from candidates that pass the momentum require-ment, but have β < 0.90 and βγ < 2.5, while the β and βγ pdfs are produced by selecting candidates which pass the respective β and βγ selection and have momentum in the range 70 GeV < p < 180 GeV. This ensures that enough events are selected for the background pdfs to reflect the signal region even at high masses. The independence of p, β and βγ required for this approach to work is achieved by considering five equidistant regions in |η|. The typical number of events in the pdfs used for generating the background estimate
is O(104).
7 Systematic uncertainties
Several possible sources of systematic uncertainty are studied. The resulting systematic
uncertainties are summarised in tables 2 and 3. The uncertainties given are those on the
expected yields in the signal region.
7.1 Theoretical cross-sections
Signal cross-sections are calculated to next-to-leading order in the strong coupling constant, including the resummation of soft gluon emission at next-to-leading-logarithm accuracy
(NLO+NLL)3 [72–74]. The nominal cross-section and the uncertainty are taken from an
3The NLL correction is used only for strong squark and gluino production when the squark and gluino
JHEP01(2015)068
Charginos R-hadrons
Source SR-CH-1C SR-CH-1LC SR-CH-2C SR-RH-MA & SR-RH-FD
Signal size — theory 8.5 8.5 8.5 15–56
Signal efficiency
· Trigger efficiency 3.4 3.4 3.4 ≤2.4
· ISR ≤1.0 ≤1.0 ≤1.0 ≤9
· Pixel dE/dx calibration 1.1 1.1 1.1 1.1
· β timing calibration 1.0 1.0 2.0 ≤3.6
· Offline Emiss
T scale 5.6–7.6 2–4.2
Total signal efficiency 6.8–8.5 4.3–5.7 4.2 ≤10.2
Luminosity 2.8 2.8 2.8 2.8
Background estimate 3.5–6.8 4 8.7–20 3–15
Table 3. Summary of systematic uncertainties for the chargino and R-hadron searches (given in percent). Ranges indicate a mass dependence for the given uncertainty (low mass to high mass).
envelope of cross-section predictions using different parton distribution function sets and
factorisation and renormalisation scales, as described in reference [75].
The procedure results in an uncertainty of 5% for the GMSB slepton search (dominated by electroweak production), between 1% (low squark mass) and 54% (high squark mass) in the LeptoSUSY slepton search, 8.5% in the stable-chargino search and from 15% (at 400 GeV) to 56% (at 1700 GeV) in the R-hadron searches.
7.2 Signal efficiency
The muon trigger efficiency for muons is calculated using the tag-and-probe technique on
Z → µµ events as described in reference [67]. The reduction in the muon trigger efficiency
due to late arrival of particles is estimated from simulation. However, the quality of the estimate depends on the exact timing implementation in the simulation, and needs to agree well with the data in order to obtain a good estimate of the trigger efficiency. For events triggered by the RPC, a systematic uncertainty is estimated by smearing the hit times in the simulation according to uncalibrated data, and applying the trigger efficiency as a function of β. The uncertainty on events triggered by the TGC is negligible due to an accurate timing description in the simulation. The resulting systematic uncertainty on the muon trigger efficiency is between 2.9% and 3.4%, depending on the signal model.
The ETmiss triggers use calorimeter energy deposits to calculate the transverse energy,
and are thus blind to muons. Therefore, Z → µµ events can be used for calibration and
mass is defined as the average of the squark masses in the first two generations. In the case of gluino-pair (associated squark-gluino) production processes, the NLL calculations are extended up to squark masses of 4.5 TeV (3.5 TeV). For masses outside this range and for other types of production processes (i.e. electroweak and associated strong and electroweak), cross-sections at NLO accuracy obtained with Prospino2 [71] are used.
JHEP01(2015)068
to study systematic uncertainties. To evaluate the trigger efficiency, the trigger turn-on
curve is obtained by fitting the measured efficiency as a function of ETmiss in Z → µµ
events, both in data and simulation. These efficiency turn-on curves are then applied
to the expected Emiss
T spectrum from simulated signal events. The total uncertainty
is estimated from three contributions: the relative difference between the efficiencies obtained using the fitted threshold curves from Z → µµ data and simulation as well as the differences in efficiency obtained from independent ±1σ variations in fit parameters relative to the unchanged turn-on curve fit for both Z → µµ data and MC simulation.
The total estimated ETmiss trigger uncertainties are 1.2%, 3.4%, 2.5%, 2.3% and 2.3% for
sleptons, stable charginos as well as gluino, sbottom and stop R-hadrons, respectively.
These uncertainties include effects of a 10% variation of the ETmiss scale, motivated by
comparing the calorimeter response in Z → µµ events between data and simulation. The trigger efficiency depends on the amount of ISR. To evaluate the associated uncer-tainty, a number of representative mass hypotheses are reproduced, setting the Pythia6
radiation level low and high [56, p. 391]. A simple threshold curve modelling of the trigger
is applied to those and the nominal samples. The largest variation from the central sample is found to be between 0.5% and 1% for the slepton and chargino searches and below 9% for the R-hadron searches.
The systematic uncertainty on the efficiency of the offline ETmissselection for SR-CH-1LC
is determined by varying the energy or momentum scale of the individual components
entering the calculation, and propagating these changes to the Emiss
T calculation. The
dominant contributions are the muon momentum scale (at low masses) and the jet energy
scale [76] (at high masses). A systematic uncertainty on the signal efficiency can be obtained
by using those scaled values when applying the ETmiss requirement and is estimated to be
between 2% and 7.6%. SR-CH-1C is affected by candidates migrating in or out of SR-CH-1LC. The signal β resolution is estimated by smearing the measured time of hits in the MS and calorimeter according to the spread observed in the time calibration. The systematic uncertainty due to the smearing process is estimated by scaling the smearing factor up and down, so as to bracket the distribution obtained in data. A 1% (2%) systematic uncertainty is found in SR-SL-1C and SR-CH-1C (SR-SL-2C and SR-CH-2C) for the slepton and chargino searches, respectively. The corresponding uncertainty for R-hadrons is estimated to be less than 3.6% (1%) in the full-detector (MS-agnostic) approach.
The βγ measurement from the pixel dE/dx carries a systematic uncertainty due to the difference between simulation (signal) and data (predominantly background). This difference can be measured using Z → µµ events in data and simulation, and the scale between data and MC simulation is found to be different by 2.3%. In addition, variations in the βγ scale are checked, assuming tracking to be very stable, by monitoring the measured proton mass over time. This results in an RMS of 0.6%, yielding a total scale uncertainty of 2.4%. Applying this scale uncertainty in simulated signal events leads to uncertainties on the signal efficiency of 1.1% at low R-hadron masses (300 GeV) and 0.4% at higher masses (500 and 800 GeV). For simplicity, a systematic uncertainty of 1.1% is applied for all masses. The uncertainty on the integrated luminosity is ±2.8%. It is derived, following the
same methodology as that detailed in reference [77], from a preliminary calibration of the
JHEP01(2015)068
7.3 Background estimation
To test the momentum dependence of the muon β pdf, the candidates in each η region are split into a high and a low momentum category with the same amount of events in each, and the background is estimated with the resulting β pdfs. The effect on the background estimation due to residual p–β correlations is assessed by using a finer |η| division in the slepton searches. The detector is sub-divided into 25 |η| regions instead of the 8 used in the analysis and the background is estimated with this division.
Similar tests are performed to determine the uncertainty on the background for the R-hadron search. Unlike the slepton search, the range of mass hypotheses tested is very large, and it is found that the size of the systematic uncertainty on the background esti-mate grows with mass. In order to quantify the systematic uncertainty, the pdfs used to produce the background estimates are varied, both by changing the selection range used for producing them and also by dividing the selection ranges into two sub-ranges, and comparing the resulting background estimates from these sub-range pdfs.
The total uncertainties on the background estimate are 8.3–9% for SR-SL-2C increasing with mass, and 10–12% for SR-SL-1C in the slepton searches. The uncertainties in the chargino searches are 3.5–6.8% for SR-CH-1C, 4% for SR-CH-1LC and 8.7–20% for SR-CH-2C. For R-hadrons the uncertainty is 3–15%.
8 Results
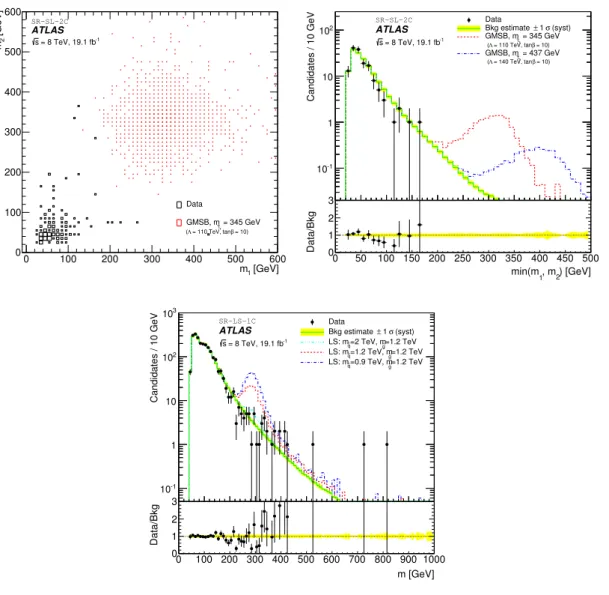
The mass distributions observed in data together with the background estimate, its
system-atic uncertainty and examples of expected signal are shown in figures 2–4 for the slepton,
chargino and R-hadron searches, respectively.
No indication of signal above the expected background is observed, and limits on new
physics scenarios are set using the CLs prescription [78].
For each search, limits on the cross-section are calculated from the likelihood to
ob-serve the number of events found in each signal region with candidate mass mβ (and mβγ
for R-hadrons) above the required mass value, given the background estimate and signal efficiency. For each signal region the likelihood function is built assuming a Poisson count-ing model for the observed number of events with Gaussian constraints for the systematic uncertainties. For the slepton and the chargino searches a global extended likelihood, given
by the product of the likelihood functions of the various signal regions, is used. The CLs
calculation uses a profile likelihood test statistic [79].
Mass limits are derived by comparing the obtained cross-section limits to the lower edge of the ±1σ band around the theoretically predicted cross-section for each process. Examples of the observed and expected event yields, as well as efficiencies and uncertainties
for data and some MC simulation signal samples, are shown in tables 4–7 for the various
searches and signal regions.
8.1 Slepton limits
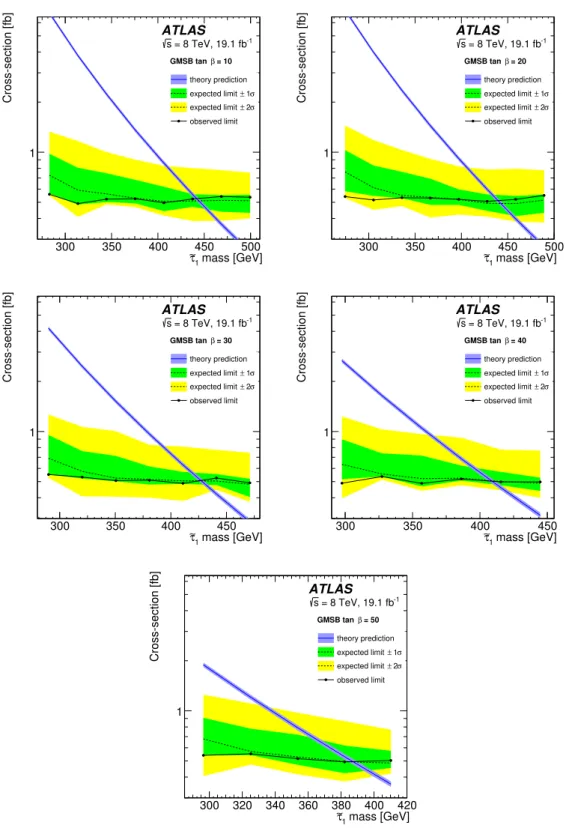
The resulting production cross-section limits at 95% confidence level (CL) in the GMSB
scenario as a function of the ˜τ1 mass are presented in figure5and compared to theoretical
JHEP01(2015)068
˜
τ1 mass [GeV] 345 407 469
SR-SL-2C
Minimum mβ requirement [GeV] 240 270 320
Expected signal 12.5 5.1 2.1
Efficiency 0.28±0.01 0.29±0.01 0.28±0.01
Estimated background 0.43±0.05 0.25±0.03 0.10±0.01
Observed 0 0 0
SR-SL-1C
Minimum mβ requirement [GeV] 240 280 320
Expected signal 8.5 3.5 1.5
Efficiency 0.19±0.01 0.20±0.01 0.21±0.01
Estimated background 49±5 27±3 15±1
Observed 47 28 20
Cross-section limit [fb] 0.52 0.50 0.54
Table 4. Observed and expected event yields, as well as efficiencies and uncertainties for three MC simulation signal samples, in the two signal regions used in the GMSB slepton search. Cross-section upper limits are stated at 95% CL.
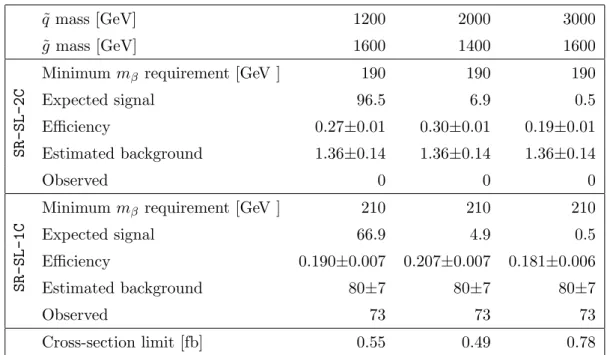
˜
q mass [GeV] 1200 2000 3000
˜
g mass [GeV] 1600 1400 1600
SR-SL-2C
Minimum mβ requirement [GeV ] 190 190 190
Expected signal 96.5 6.9 0.5
Efficiency 0.27±0.01 0.30±0.01 0.19±0.01
Estimated background 1.36±0.14 1.36±0.14 1.36±0.14
Observed 0 0 0
SR-SL-1C
Minimum mβ requirement [GeV ] 210 210 210
Expected signal 66.9 4.9 0.5
Efficiency 0.190±0.007 0.207±0.007 0.181±0.006
Estimated background 80±7 80±7 80±7
Observed 73 73 73
Cross-section limit [fb] 0.55 0.49 0.78
Table 5. Observed and expected event yields, as well as efficiencies and uncertainties for three MC simulation signal samples, in the three signal regions used in the LeptoSUSY slepton search. Cross-section upper limits are stated at 95% CL.
JHEP01(2015)068
[GeV] 1 m 0 100 200 300 400 500 600 [GeV]2 m 0 100 200 300 400 500 600 Data = 345 GeV 1 τ∼ GMSB, m = 10) β = 110 TeV, tan Λ ( SR-SL-2C ATLAS -1 = 8 TeV, 19.1 fb s ) [GeV] 2 , m 1 min(m 0 50 100 150 200 250 300 350 400 450 500 Candidates / 10 GeV -1 10 1 10 2 10 Data (syst) σ 1 ± Bkg estimate = 345 GeV 1 τ∼ GMSB, m = 10) β = 110 TeV, tan Λ ( = 437 GeV 1 τ∼ GMSB, m = 10) β = 140 TeV, tan Λ ( SR-SL-2C ATLAS -1 = 8 TeV, 19.1 fb s ) [GeV] 2 , m 1 min(m 0 50 100 150 200 250 300 350 400 450 500 Data/Bkg 0 1 2 3 m [GeV] 0 100 200 300 400 500 600 700 800 900 1000 Candidates / 10 GeV -1 10 1 10 2 10 3 10 Data (syst) σ 1 ± Bkg estimate =1.2 TeV g ~ =2 TeV, m q ~ LS: m =1.2 TeV g ~ =1.2 TeV, m q ~ LS: m =1.2 TeV g ~ =0.9 TeV, m q ~ LS: m SR-LS-1C ATLAS -1 = 8 TeV, 19.1 fb s m [GeV] 0 100 200 300 400 500 600 700 800 900 1000 Data/Bkg 0 1 2 3Figure 2. Reconstructed mass mβ of one candidate (m2) versus mβ of the other candidate (m1)
for observed data and expected signal, in the GMSB slepton search in the two-candidate signal region (top-left). Observed data, background estimate and expected signal in the slepton search for the lower of the two masses (m) in the two-candidate signal region (GMSB ˜τ1 masses of 344.5 and
437 GeV; top-right) and for the one-candidate signal region (LeptoSUSY mq˜= 2.0, 1.2 and 0.9 TeV
with mg˜= 1.2 TeV; bottom).
A long-lived ˜τ1 in GMSB models with N5 = 3, mmessenger = 250 TeV and sign(µ) = 1
is excluded at 95% CL up to masses of 440, 440, 430, 410, 385 GeV for tan β = 10, 20, 30, 40 and 50, respectively.
Limits on the rates of specific production mechanisms are obtained by repeating the analysis on subsets of the GMSB samples corresponding to each production mode. For GMSB models with parameters in this range, strong production of squarks and gluinos is suppressed due to their large masses. Directly produced sleptons constitute 30–63% of
the GMSB cross-section, and the corresponding ˜τ1 production rates depend only on the
˜
JHEP01(2015)068
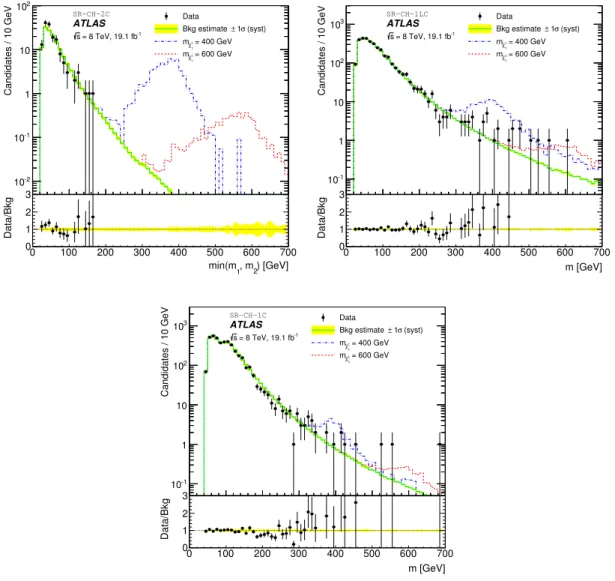
) [GeV] 2 , m 1 min(m 0 100 200 300 400 500 600 700 Candidates / 10 GeV -2 10 -1 10 1 10 2 10 Data (syst) σ 1 ± Bkg estimate = 400 GeV 1 ± χ∼ m = 600 GeV 1 ± χ∼ m SR-CH-2C ATLAS -1 = 8 TeV, 19.1 fb s ) [GeV] 2 , m 1 min(m 0 100 200 300 400 500 600 700 Data/Bkg 0 1 2 3 ) [GeV] 2 , m 1 min(m 0 100 200 300 400 500 600 700 Candidates / 10 GeV -1 10 1 10 2 10 310 DataBkg estimate ± 1σ (syst)
= 400 GeV 1 ± χ∼ m = 600 GeV 1 ± χ∼ m SR-CH-1LC ATLAS -1 = 8 TeV, 19.1 fb s m [GeV] 0 100 200 300 400 500 600 700 Data/Bkg 0 1 2 3 ) [GeV] 2 , m 1 min(m 0 100 200 300 400 500 600 700 Candidates / 10 GeV -1 10 1 10 2 10 3
10 DataBkg estimate ± 1σ (syst)
= 400 GeV 1 ± χ∼ m = 600 GeV 1 ± χ∼ m SR-CH-1C ATLAS -1 = 8 TeV, 19.1 fb s m [GeV] 0 100 200 300 400 500 600 700 Data/Bkg 0 1 2 3
Figure 3. Reconstructed mass mβ in observed data, background estimate and expected signal
( ˜χ±1 masses of 400 and 600 GeV) in the chargino search for the lower of the two masses (m) in the two-candidate signal region (top-left), for the one-loose-candidate signal region (top-right) and the one-candidate signal region (bottom).
the same analysis constrains a simple model with only pair-produced sleptons which are long-lived, or which themselves decay to long-lived sleptons of another flavour. Such direct
production is excluded at 95% CL up to ˜τ1masses of 373 to 330 GeV for models with slepton
mass splittings of 2.7–93 GeV. The slepton direct-production limits are shown in figure6.
Figure7shows the cross-section limits on direct ˜τ1 production for the case where the mass
splitting from the other sleptons is very large. As the theoretical prediction as well as the according uncertainty bands overlap almost entirely for various values of tan β, only the
curve for tan β = 10 is shown. Masses below 286 GeV are excluded if only ˜τ1 is produced.
JHEP01(2015)068
[GeV] β m 0 100 200 300 400 500 600 700 800 Events / 10 GeV -1 10 1 10 2 10 3 10 Data (syst) σ 1 ± Bkg estimate = 500 GeV g ~ Expected signal, m SR-RH-FDCOMBINED ATLAS -1 = 8 TeV, 19.1 fb s [GeV] β m 0 100 200 300 400 500 600 700 800 Data/Bkg 0 1 2 3 [GeV] β m 0 100 200 300 400 500 600 700 800 Events / 10 GeV -1 10 1 10 2 10 3 10 Data (syst) σ 1 ± Bkg estimate = 500 GeV g ~ Expected signal, m SR-RH-FDCOMBINED ATLAS -1 = 8 TeV, 19.1 fb s [GeV] γ β m 0 100 200 300 400 500 600 700 800 Data/Bkg 0 1 2 3 [GeV] β m 0 100 200 300 400 500 600 700 800 Events / 10 GeV -1 10 1 10 Data (syst) σ 1 ± Bkg estimate = 500 GeV b ~ Expected signal, m SR-RH-MA ATLAS -1 = 8 TeV, 19.1 fb s [GeV] β m 0 100 200 300 400 500 600 700 800 Data/Bkg 0 1 2 3 [GeV] β m 0 100 200 300 400 500 600 700 800 Events / 10 GeV -1 10 1 10 2 10 Data (syst) σ 1 ± Bkg estimate = 500 GeV t~ Expected signal, m SR-RH-MA ATLAS -1 = 8 TeV, 19.1 fb s [GeV] γ β m 0 100 200 300 400 500 600 700 800 Data/Bkg 0 1 2 3Figure 4. Data and background estimates for the reconstructed mass based on time-of-flight, mβ, (top-left) and based on specific energy loss, mβγ, (top-right) for combinedcandidates in the
full-detector 500 GeV gluino R-hadron search (SR-RH-FD), as well as mβ (bottom-left) for the
MS-agnostic 500 GeV sbottom and mβγ (bottom-right) for the MS-agnostic 500 GeV stop R-hadron
search (SR-RH-MA).
Finally, in the context of the GMSB model, 30–50% of the GMSB cross-section arises
from direct production of charginos and neutralinos (dominated by ˜χ0
1χ˜ ±
1 production) and
subsequent decay to ˜τ1. Figure 8 shows the 95% CL lower limits on the ˜χ01 and ˜χ
±
1 mass
when the final decay product is a long-lived ˜τ1. In the samples used to derive these limits,
the ˜χ01 and ˜χ±1 masses are closely related by GMSB, as represented by the values on the
two x-axes. The mass of the ˜τ1 decreases with increasing tan β and increases with the ˜χ01
and ˜χ±1 masses. At low ˜χ01 and ˜χ±1 masses and large tan β, the cross-section limits are
thus affected by the amount of background in the ˜τ1 mass search region, which starts at
120 GeV for tan β = 50 and at 170 GeV for tan β = 10. The cross-section limits exclude ˜χ01
JHEP01(2015)068
mass [GeV] 1 τ∼ 300 350 400 450 500 Cross-section [fb] 1 = 10 β GMSB tan ATLAS -1 = 8 TeV, 19.1 fb s theory prediction σ 1 ± expected limit σ 2 ± expected limit observed limit mass [GeV] 1 τ∼ 300 350 400 450 500 Cross-section [fb] 1 = 20 β GMSB tan ATLAS -1 = 8 TeV, 19.1 fb s theory prediction σ 1 ± expected limit σ 2 ± expected limit observed limit mass [GeV] 1 τ∼ 300 350 400 450 Cross-section [fb] 1 = 30 β GMSB tan ATLAS -1 = 8 TeV, 19.1 fb s theory prediction σ 1 ± expected limit σ 2 ± expected limit observed limit mass [GeV] 1 τ∼ 300 350 400 450 Cross-section [fb] 1 = 40 β GMSB tan ATLAS -1 = 8 TeV, 19.1 fb s theory prediction σ 1 ± expected limit σ 2 ± expected limit observed limit mass [GeV] 1 τ∼ 300 320 340 360 380 400 420 Cross-section [fb] 1 = 50 β GMSB tan ATLAS -1 = 8 TeV, 19.1 fb s theory prediction σ 1 ± expected limit σ 2 ± expected limit observed limitFigure 5. Cross-section upper limits as a function of the mass of the lightest stau for the GMSB models organised by tan β: 10 and 20 first row, 30 and 40 second row and 50 last row. The expected limit is drawn as a dashed black line with ±1σ and ±2σ uncertainty bands drawn in green and yellow, respectively. The observed limit is shown as solid black line with markers. The theoretical cross-section prediction is shown as a solid blue line with a shaded ±1σ uncertainty band.
JHEP01(2015)068
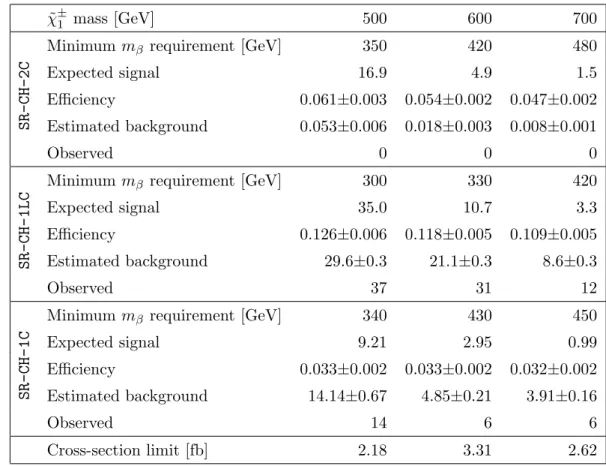
˜
χ±1 mass [GeV] 500 600 700
SR-CH-2C
Minimum mβ requirement [GeV] 350 420 480
Expected signal 16.9 4.9 1.5
Efficiency 0.061±0.003 0.054±0.002 0.047±0.002
Estimated background 0.053±0.006 0.018±0.003 0.008±0.001
Observed 0 0 0
SR-CH-1LC
Minimum mβ requirement [GeV] 300 330 420
Expected signal 35.0 10.7 3.3
Efficiency 0.126±0.006 0.118±0.005 0.109±0.005
Estimated background 29.6±0.3 21.1±0.3 8.6±0.3
Observed 37 31 12
SR-CH-1C
Minimum mβ requirement [GeV] 340 430 450
Expected signal 9.21 2.95 0.99
Efficiency 0.033±0.002 0.033±0.002 0.032±0.002
Estimated background 14.14±0.67 4.85±0.21 3.91±0.16
Observed 14 6 6
Cross-section limit [fb] 2.18 3.31 2.62
Table 6. Observed and expected event yields, as well as efficiencies and uncertainties for three MC simulation signal samples, in the three signal regions used in the chargino search. Cross-section upper limits are stated at 95% CL.
mass [GeV] 1 τ∼ 200 250 300 350 400 450 mass [GeV]1 τ∼ mass - l~ 10 20 30 40 50 60 70 80 90 100 ATLAS -1 = 8 TeV, 19.1 fb s Excluded Observed Limit theory SUSY σ 1 ± Expected Limit exp σ 1 ±
Figure 6. 95% CL excluded regions for directly produced sleptons in the plane m(˜`)–m(˜τ1) vs.
m(˜τ1). The excluded region is is shown in blue. The expected limit is drawn as a solid black line
with a ±1σ uncertainty band drawn as dashed black lines. The observed limit is shown as solid red line with a ±1σ uncertainty band drawn as dashed red lines.
JHEP01(2015)068
mass [GeV] 1 τ∼ 250 300 350 400 450 500 Cross-section [fb] 1theory prediction tanβ=10
expected limit ± 1σ
σ 2 ±
observed limit tanβ=10 tanβ=30 tanβ=50
ATLAS
-1
= 8 TeV, 19.1 fb s
Figure 7. Cross-section upper limits as a function of the ˜τ1mass for direct ˜τ1production and three
values of tan β. The expected limit for tan β = 10 is drawn as a dashed black line with ±1σ and ±2σ uncertainty bands drawn in green and yellow, respectively. The observed limits for three values of tan β are shown as solid lines with markers. The theoretical cross-section prediction for tan β = 10 is shown as a coloured ±1σ band, and does not vary significantly for the other tan β values.
mass [GeV] 1 0 χ∼ 350 400 450 500 550 600 650 700 750 Cross-section [fb] -1 10 1 10 2 10 = 10 β tan theory prediction σ 1 ± expected limit = 10 β tan theory prediction σ 1 ± expected limit observed limit σ 2 ± expected limit ATLAS -1 = 8 TeV, 19.1 fb s mass [GeV] 1 ± χ∼ 550 600 650 700 750 800 850 900 950
Figure 8. Cross-section upper limits as a function of the ˜χ1mass for ˜τ1sleptons resulting from the
decay of directly produced charginos and neutralinos in GMSB. Observed limits are given as a solid black line with markers. Expected limits for tan β = 10 are drawn as a dashed black line with ±1σ and ±2σ uncertainty bands drawn in green and yellow, respectively. The theoretical cross-section prediction (dominated by ˜χ0
1χ˜ +
1 production) is shown as a coloured ±1σ band. Depending on the
hypothesis and to a small extent on tan β, in these models, the chargino mass is 210 to 260 GeV higher than the neutralino mass.
JHEP01(2015)068
R-hadron type / mass [GeV] g / 1300˜ ˜b / 800 ˜t / 900
SR-RH-MA
Minimum mβγ requirement [GeV] 785.1 560.3 612.9
Minimum mβ requirement [GeV] 746.9 512.7 565.5
Expected signal 3.09 4.63 2.54
Efficiency 0.10±0.01 0.084±0.009 0.12±0.01
Estimated background 0.010±0.001 0.27±0.02 0.18±0.02
Observed 0 0 0
Cross-section limit [fb] 1.53 1.8 1.23
R-hadron type / mass [GeV] g / 1300˜ ˜b / 800 ˜t / 900
SR-RH-FD
Minimum mβγ requirement [GeV] 785.1 560.3 612.9
Minimum mβ requirement [GeV] 746.9 512.7 565.5
Expected signal 3.50 5.90 3.50
Efficiency 0.11±0.01 0.11±0.01 0.17±0.02
Estimated background 0.051±0.006 0.73±0.06 0.40±0.03
Observed 0 1 0
Cross-section limit [fb] 1.33 1.80 0.84
Table 7. Observed and expected event yields, as well as efficiencies and uncertainties for three MC simulation signal samples, in the R-hadron searches. Cross-section upper limits are stated at 95% CL.
Limits on LeptoSUSY scenarios are set on squarks and gluinos decaying to long-lived
sleptons within the LeptoSUSY model. The exclusion region in the plane m(˜g) vs. m(˜q) is
shown in figure9. Squark and gluino masses are excluded at 95% CL up to a mass of 1500
and 1360 GeV, respectively, in simplified LeptoSUSY models where sleptons are stable
and degenerate, with a mass of 300 GeV, and all neutralinos (except ˜χ01) and charginos are
decoupled.
8.2 Chargino limits
Limits are set on long-lived charginos, which are nearly degenerate with the lightest neu-tralino in simplified SUSY models. The production cross-section limits at 95% CL in this
scenario as a function of the ˜χ±1 mass are presented in figure10and compared to theoretical
predictions. Masses below 620 GeV are excluded. The observed cross-section limit is found to be consistently one or two standard deviations (σ) above the expected limit, due to an excess of data events relative to the background estimate in SR-CH-1LC, as can be seen in
JHEP01(2015)068
mass [GeV] q ~ 1000 1500 2000 2500 3000 mass [GeV]g~ 1000 1500 2000 2500 3000 ATLAS -1 = 8 TeV, 19.1 fb s Excluded Observed Limit theory SUSY σ 1 ± Expected Limit exp σ 1 ±Figure 9. 95% CL excluded regions of squark mass and gluino mass in the LeptoSUSY models. The excluded region is is shown in blue. The expected limit is drawn as a solid black line with a ±1σ uncertainty band drawn as dashed black lines. The observed limit is shown as solid red line with a ±1σ uncertainty band drawn as dashed red lines.
mass [GeV] 1 ± χ∼ 450 500 550 600 650 700 750 800 Cross-section [fb] 1 10 2 10 Charginos ATLAS -1 = 8 TeV, 19.1 fb s theory prediction σ 1 ± expected limit σ 2 ± expected limit observed limit
Figure 10. Cross-section upper limits for various chargino masses in stable-chargino models. The expected limit is drawn as a dashed black line with ±1σ and ±2σ uncertainty bands drawn in green and yellow, respectively. The observed limit is shown as solid black line with markers. The theo-retical cross-section prediction is shown as a solid blue line with a shaded ±1σ uncertainty band.
JHEP01(2015)068
Search Lower mass limit [GeV]
GMSB sleptons
· tan β = 10, 20, 30, 40, 50 440, 440, 430, 410, 385
· direct ˜` production(m`˜− m˜τ1= 2.7–93 GeV) 377–335
· direct ˜τ1 production 289 · ˜χ01χ˜±1 decaying to stable ˜τ1 537 LeptoSUSY · ˜q, ˜g 1500, 1360 Charginos · ˜χ±1 620 R-hadrons · ˜g, ˜b, ˜t (full-detector) 1270, 845 and 900 · ˜g, ˜b, ˜t (MS-agnostic) 1260, 835 and 870
Table 8. Summary of the lower mass limits (95% CL) from the various searches.
8.3 R-hadron limits
The R-hadron limits in the MS-agnostic (left) and full-detector (right) searches are shown
in figure 11. In the full-detector search for R-hadrons a lower mass limit at 95% CL of
1270 GeV for gluinos, 845 GeV for sbottoms and 900 GeV for stops is obtained. A selection relying solely on the inner detector and calorimeters, thereby covering e.g. R-hadrons which change into neutral bound states in the calorimeters before reaching the MS, yields a lower mass limit of 1260 GeV for gluinos, 835 GeV for sbottoms and 870 GeV for stops.
9 Conclusion
Searches for heavy long-lived charged particles are performed through measurement of the mass of candidates by means of time-of-flight and specific ionisation loss measurements in
ATLAS sub-detectors using a data sample of 19.1 fb−1 from proton-proton collisions at a
centre-of-mass energy of√s = 8 TeV collected by the ATLAS detector at the Large Hadron
Collider. The data are found to match the Standard Model background expectation within uncertainties. The exclusion limits placed for various models impose new constraints on non-SM cross-sections.
An overview on all 95% CL lower mass limits placed in this article is given in table 8.
The upper limits placed on cross-sections and lower limits placed on the mass of long-lived particles in various supersymmetric models, thanks to increased luminosity and more advanced data analysis, substantially extend previous ATLAS limits, and are largely com-plementary to searches for promptly decaying SUSY particles.