Review of the 2004 water year in Colorado, A
13
0
0
Full text
(2) Doesken and Gillespie. 2. Meteorological Description of the 2004 Water Year The 2004 water year (WY2004) refers to the period of 12 consecutive months beginning October 1, 2003 and ending September 30, 2004. It encompasses the winter snow accumulation season and, the spring green-up and snowmelt season, and it ends at the conclusion of the summer growing season (and irrigation season). Drought was still a major concern in Colorado as WY2004 began. While WY2003 was wetter than the record drought year of WY2002, and the huge Front Range March snowstorm had been extremely beneficially, much of the state remained dry. Soil moisture was still lacking, rangeland was dry and brown, rivers were flowing well below their normal levels, and reservoir storage remained below average. Water conservation efforts did result in less water usage in WY2003 than in comparable previous years, but with another very hot summer, demand for water remained modest. Ranchers twinged knowing that cattle prices were high, but range conditions did not warrant increased grazing rates. As we moved into the fall of 2003 and the beginning of the 2004 water year, Coloradans were very aware of the need for a wet year to help overcome the lingering impacts from drought. Large-scale climate factors did not provide any strong indications of what may lie ahead. A weak warm phase in the El Nino Southern Oscillation (ENSO) had developed going into the fall of 2002 and continued throughout 2003 and into 2004. This warm phase failed to blossom into a full “El Nino” but instead vascillated, leaving climatologists uncertain about the long-range forecast and water officials unclear on the likelihood of significant drought recovery. It was an improved situation from the “la Nina” (cold phase of ENSO) that had developed in 1999 and may have contributed to drought 2000–2002. Correlations of ENSO with Colorado historic precipitation patterns hinted that Colorado may have another dry winter but that conditions might improve during the spring of 2004. These probabilistic forecasts, however, were not accompanied by high confidence.. 3. Temperature Patterns During the 2004 Water Year We tend to emphasize precipitation and snow accumulation as we describe climatic conditions affecting Colorado’s hydrology and water supplies. However, temperatures, while much less spatially variable than precipitation, are also very important. Temperatures directly impact the phase of precipitation (rain versus snow), when and how quickly snow melts, and evaporation rates. Urban, agricultural and forest water demands are all affected by temperature. Figure 1. shows regionally averaged temperatures for Colorado, on a month-by-month basis for WY2004, expressed as departures from the 19712000 base period. If temperatures were to track right at the long-term average, each line on the graph would appear along the 0 (zero) axis. The graph shows several striking features: very warm temperatures in October 2003, mild mid winter (December–January) temperatures especially from the mountains eastward, a chilly February statewide, record warmth in March, and continued above average conditions in April and May. These very warm spring temperatures would typically mean a very early snowmelt, high evaporation 280.
(3) A Review of the 2004 Water Year in Colorado. rates and an early onset of the wildfire season. That’s exactly what it was looking like as we moved through March. Fortunately, April brought widespread soaking precipitation to offset the impacts of high temperature.. Water Year 2004. Departure from average, degree F. 8 6 4 2 0 -2 -4 -6 Oct. Nov. Dec. Eastern Plains. Jan. Feb. Mar. Foothills. Apr. May. Jun. Mountains. Jul. Aug. Sep. Western Valleys. Figure 1. Regionally averaged monthly temperature departures from the 1971-2000 averages, October 2003 through September 2004, for Colorado’s Eastern Plains, the Front Range foothills and adjacent plains corridor, the Colorado mountainous region, and the western valleys and plateau region (Western Slope).. After several consecutive summers with abnormally hot temperatures in Colorado, WY2004 brought a welcome change. June, July and August were all cooler than average from the mountains eastward. In fact, most areas from the Rocky Mountains east to the Appalachians experienced a very cool summer, one of the coolest in several decades at some locations. These cool temperatures, combined with higher than average humidity, reduced wildfire hazards, decreased evaporation rates, and helped stretch Colorado’s water supplies allowing more water to remain in reservoir for future use.. 4. Precipitation WY2004 did not get off to a good start. Only a few isolated areas in the mountains received one inch or more of October precipitation. Most of that fell from just one storm early in the month. The rest of October was unusually warm and very dry statewide. Much of the state ended up with less than 25% of average. November was no better east of the mountains with most areas east of the high mountains receiving only a few hundredths of an inch of moisture all month. Fortunately, a series of storms brought steady. 281.
(4) Doesken and Gillespie. doses of snow to the high country, getting the winter snowpack started, and very much improving attitudes and morale in the winter recreation industry. December and January were “ho-hum.” Other than a few short blasts of winter cold, temperatures were consistently above average in most areas. About every week a winter storm arrived, but most skipped across the state quickly dropping snow at high elevations but little in the valleys. One storm in early December brought heavy precipitation to northwestern Colorado. A longer-lasting storm in early January left heavy snows across the mountains of southern Colorado and also coated the western valleys with snow. This fresh snow cover resulted in several weeks of very cold temperatures around Grand Junction and especially in the Gunnison Valley. February’s storm track favored southwestern Colorado, while the northern mountains were again dry. Finally a few storms spilled out into eastern Colorado. February proved to be the coldest month of the year, so snow did not melt quickly. March is often the snowiest month of the year for Colorado from the Central mountains eastward across the plains. That was definitely not the case this year. Other than a brief, localized blizzard that clipped the northeast corner of Colorado early on March 1, and a more widespread Front Range upslope event late on March 4th, March was remarkably placid and extremely warm. Monthly precipitation ended up less than 50% of average at most weather stations both in, east and west of the mountains. Snow began melting, even at high elevations. With each passing dry week, Coloradans became increasing resigned to dealing with more severe drought. By the second day of April, weather patterns shifted, and moist air streamed into Colorado. For 10 days, April 2-11, precipitation fell over all or portions of the western two-thirds of the state. Later in the month, another storm system soaked eastern Colorado, especially southeastern counties. Three to four inches of rain fell in two days. This immediately helped green up pastures and rangeland, and also brought improvement to what was beginning to look like another miserable winter wheat crop. By the end of the month, water year precipitation to date (Figure 2) climbed above average along the southern Front Range and parts of the Arkansas Valley. Conditions also improved greatly in the Rio Grande Valley. Most of the rest of Colorado, however, was still drier than average for the first seven months of the water year. Warm and very dry weather returned in May. Only one widespread storm May 12-13th brought significant precipitation. Scattered thunderstorms developed later in the month. Southern and western Colorado missed most of the action, and numerous areas received less than 25% of the average May moisture. Mountain snow melted quickly. The first half of June was also dry and quite hot. Western Colorado remained dry throughout most of June, but the eastern half of the state saw an abrupt change beginning June 15th. Cool, moist “upslope” winds from the east pumped moisture into the state, and widespread soaking and locally very heavy rain fell east of the mountains. June precipitation still ended up below average over much of northeastern Colorado, but the but the Front Range and southeastern plains were much wetter than average. Holly received over seven inches of rain in the last half of June. 282.
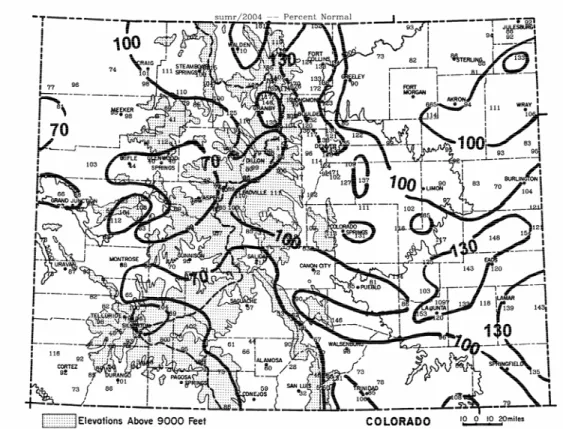
(5) A Review of the 2004 Water Year in Colorado. July precipitation was spotty, with heavy thunderstorms in some areas and dry conditions in others. But overall much or eastern Colorado and the Front Range were again quite wet and cool, while western Colorado was predominantly near to below average. Cool high pressure over the northern plains episodically pumped moist air into eastern Colorado in August. Rainfall was especially heavy on the 18th, with over 4 inches of rain falling in several areas from Denver southeastward to the Arkansas Valley. Western Colorado remained drier than average.. Figure 2. Colorado accumulated precipitation for winter 2004, October 2003 through April 2004, as a percent of the 1971-2000 average.. The 2004 Water Year ended on a wet note, especially for the mountains. Several September storm systems brought widespread moderate to heavy rains to western Colorado. Southwestern Colorado took the brunt of a storm September 19-21st that dropped more than four inches of rain. Growing season precipitation (Figure 3) ended up near to below average over most of western Colorado and portions of the plains. A swath of average to much above average May-September moisture extended from north central Colorado south to Colorado Springs and then eastward into the Arkansas Valley. Several locations, including Fort Collins, Boulder, Denver, Colorado Springs and Lamar exceeded 130% of average. In combination with cool summer temperatures, this greatly improved vegetation health and soil moisture over substantial areas.. 283.
(6) Doesken and Gillespie. Figure 3. Colorado growing season (May through September 2004) precipitation totals as a percent of the 1921-2000 average.. Figure 4. Water Year 2004 precipitation (October 2003 through September 2004) as a percent of the 1971 – 2000 average.. 284.
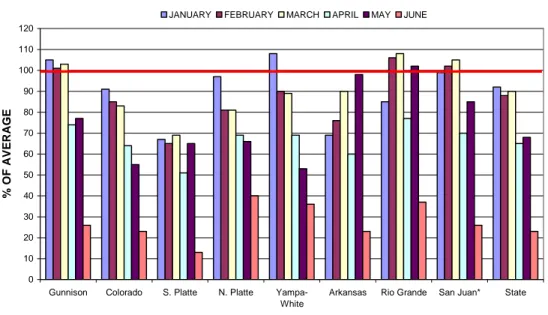
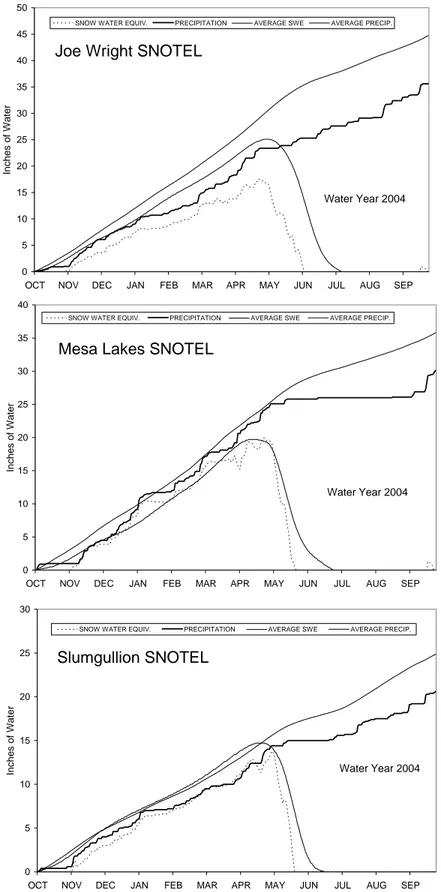
(7) A Review of the 2004 Water Year in Colorado. For WY2004 as a whole (Figure 4), precipitation totals were above average from Larimer County south to Denver and then south and southeastward across most of the southeast quarter of the state. South Park (Park County) was also a local wet spot as was the upper Rio Grande basin west from Alamosa and the Grand Mesa near Grand Junction. The remainder of the state was average to below average with the driest areas in northeastern Colorado from Greeley to Sterling and along I-70 in eastern Colorado from Limon to Stratton. Some areas had less than 70% of average. Most of western Colorado ended up with between 80 and 100% of the average water year precipitation. Except for the Front Range corridor and the lower Arkansas Valley, WY2004 precipitation was not sufficient to overcome prevailing drought conditions. In some areas, moisture deficits continued to compile. Fortunately, the wet April rescued the state from what could have been another very bad year. The cool and regionally wet summer greatly reduced evapotranspiration demand, helped Colorado avoid another active wildfire season and resulted in good summer crops in many areas. The wet September was also very beneficial and contributed to improved soil moisture conditions over much of the state going into WY2005. 5. Snowpack Accumulation The winter of 2003-2004 produced below average snowfall across most of Colorado’s mountains. Figure 5 shows basinwide and statewide snowpack as a percent of average at the beginning of each month from January 1 through June 1, 2004. Basins in southern Colorado (Arkansas, Gunnison, Rio Grande and San Juan/Dolores/Animas/San Miguel) fared reasonably well in WY2004, and were above average at times throughout the season. The northern half of the State, however, fell below average and stayed low all winter. The South Platte Basin, for example, never rose above 70% of average snowpack and then melted out rapidly in May. March, normally a big month for snow in Colorado, saw very rapid depletions in snowpack as a percent of average in all basins, but April helped make up for that, especially across southern Colorado. Overall, this was the 7th consecutive year where the maximum snowpack accumulation composited over the state as a whole fell short of the long-term average. The daily accumulations of precipitation and snow water equivalent at three selected locations in Colorado are shown in Figure 6. Very little snow accumulated anywhere in Colorado in October. A pattern of stormy weather in early November quickly eliminated the deficits in western Colorado, but mountain areas along the Front Range remained below average. December was a dry month across most of the state. A huge storm, which hit southwestern Colorado particularly hard, contributed several inches of muchneeded snow water equivalent in early January, but the increased snowpack percentages were short lived as dry weather patterns quickly returned to the entire state for the rest of the month. By February 1, statewide snowpack stood at 88% of average, ranging from 106% of average in the Rio Grande to just 65% of average in the South Platte. Another cycle of stormy weather. 285.
(8) Doesken and Gillespie. developed in February and continued into early March. But then dry and abnormally warm weather prevailed for the rest of the month. Low elevation snowpack melted out in March. Temperatures were so warm that many SNOTEL stations observed their earliest melting episodes on record (past 25 years). By April 1, statewide snowpack was only 65% of average, and the South Platte basin was just 51%. This decline was the 3rd largest ever measured in Colorado in March since snowpack monitoring was established in the 1930s. COLORADO SNOWPACK Summary for 2004 USDA Natural Resources Conservation Service JANUARY. FEBRUARY. MARCH. APRIL. MAY. JUNE. 120 110 100. % OF AVERAGE. 90 80 70 60 50 40 30 20 10 0 Gunnison. Colorado. S. Platte. N. Platte. YampaWhite. Arkansas. Rio Grande. San Juan*. State. *Includes Animas, Dolores, San Miguel Basins. Figure 5. 2004 monthly progression of snowpack for major watersheds in Colorado as a percent of the 1971-2000 averages.. Fortunately for the State’s water users, April brought a dramatic turn around. There were two major storm episodes interspersed with a warm melting period. Southern Colorado, particularly the Arkansas Basin, was hardest hit and made up nearly all of the deficit from the preceding dry months. The WY2004 then ended on another warm and dry note, and the state’s snowpack melted quickly in all basins. All SNOTEL sites melted out completely by mid June, several weeks early than normal.. 6. Runoff and Streamflow Streamflow represents the integration of each year’s complex and unique combinations of temperature, precipitation, snow accumulation, evaporation and sublimation. It also is influenced by previous years’ weather that affects long-term base flows. Figure 7 shows daily discharges for selected basins in northern, central and southern Colorado and describe well the variety of conditions that were experienced in Colorado in WY2004. The Poudre River saw only a modest snowmelt peak in early June. Flow rates 286.
(9) A Review of the 2004 Water Year in Colorado. 50 SNOW WATER EQUIV.. PRECIPITATION. AVERAGE SWE. AVERAGE PRECIP.. 45 40. Joe Wright SNOTEL. Inches of Water. 35 30 25 20 15. Water Year 2004. 10 5 0 OCT. NOV. DEC. JAN. FEB. MAR. APR. MAY. JUN. JUL. AUG. SEP. 40 SNOW WATER EQUIV.. 35. PRECIPITATION. AVERAGE SWE. AVERAGE PRECIP.. Mesa Lakes SNOTEL. Inches of Water. 30. 25. 20. 15. Water Year 2004 10. 5. 0 OCT. NOV. DEC. JAN. FEB. MAR. APR. MAY. JUN. JUL. AUG. SEP. 30 SNOW WATER EQUIV.. 25. PRECIPITATION. AVERAGE SWE. AVERAGE PRECIP.. Slumgullion SNOTEL. Inches of Water. 20. 15. Water Year 2004 10. 5. 0 OCT. NOV. DEC. JAN. FEB. MAR. APR. MAY. JUN. JUL. AUG. SEP. Figure 6. Daily precipitation (heavy solid line) and snowpack water equivalent (dotted line) for the 2004 water year and comparisons to average for Joe Wright SNOTEL (north), Mesa Lakes SNOTEL (central), and Slumgullion SNOTEL (south).. 287.
(10) Doesken and Gillespie 3000. Cache La Poudre River at Mouth of Canyon 2004 Discharge. Discharge, (1000 CFS). 2500. Mean Discharge. 2000. 1500. 1000. 500. 0 OCT. NOV. DEC. JAN. FEB. MAR. APR. MAY. JUN. JUL. AUG. SEP. JUN. JUL. AUG. SEP. 10000. Colorado River near Dotsero, CO. 9000. 2004 Discharge. Mean Discharge. Discharge (1000 CFS). 8000 7000 6000 5000 4000 3000 2000 1000 0 OCT. NOV. DEC. JAN. FEB. MAR. APR. MAY. 5000 4500. Animas River at Durango, CO 2004 Discharge. Mean Discharge. Discharge, (1000 CFS). 4000 3500 3000 2500 2000 1500 1000 500 0 OCT. NOV. DEC. JAN. FEB. MAR. APR. MAY. JUN. JUL. AUG. SEP. Figure 7. Daily streamflow discharge in cubic feet per second during the 2004 water year and period of record averages from USGS gauging stations on the Cache La Poudre River (top), the Colorado River near Dotsero (middle) and the Animas River at Durango (bottom).. 288.
(11) A Review of the 2004 Water Year in Colorado. then fell off quickly. The Poudre basin benefited greatly from the cool and wet summer weather patterns that developed after mid June. Rainfall runoff is normally a small component of the Poudre’s flow, but this year flow rates from later June through the end of September returned to near historical averages and allowed for much more irrigation water deliveries than had been expected. The situation on the Colorado River in Western Colorado was much different, however. With low snow accumulations, early meltout and little summer precipitation, the annual flow on the Colorado River at Dotsero was only 56% of average. The Animas River in southern Colorado showed a much different hydrograph. Early snowmelt raised river levels in March but flows then diminished in April. Rather than a large surge in snowmelt runoff in late May or June, there were actually four similar peaks spread out over several weeks. As is often the case following drought periods, summer streamflows then dropped off quickly and were well below average for the rest of the summer until a large widespread fall rain event sent a large surge of water down the River in late September. Southwestern Colorado is prone to fall storms associated with tropical storms over the Pacific, and this was another good example. Seasonal streamflows for selected watersheds are shown in Figure 8 with respect to long-term average flows. Colorado’s snowpack yielded proportionately less runoff than expected this year partly because of the warm spring temperatures and partly because of the effects of cumulative effects of long-term drought. A wet and cool summer was beneficial for Front Range rivers and streams, but for most of Colorado, WY2004 streamflow volumes were again much below average – 60-70% of average for the Yampa, White, Colorado and Gunnison basins. Streamflow volumes were better over southern Colorado. The Purgatoire River, a small river that flows through Trinidad in the Arkansas River, was actually above average. Summer rainfall was sufficiently high over southeastern Colorado 700 2004. Average. Acre Feet (Thousands). 600 500 400 300 200 100 0 G e nd ra. re ud Po. o Ri. e oir at rg Pu. gle Ea. as. r y lo Ta. im An. pa m Ya. Figure 8. 2004 water year streamflow volumes in thousands of acre-feet compared to period-of-record averages for selected rivers in Colorado.. 289.
(12) Doesken and Gillespie. that the lower Arkansas River from Pueblo to the Kansas state line saw considerable summer flows from rainfall runoff. The result was more available irrigation water than had been expected.. 7. Water Supplies and Reservoir Storage Impacts from recent dry years continue to be seen in reservoir storage. WY2004 began with statewide reservoir storage at 74% of average and ended the year at 77% (Figure 9). Significant improvements were made in the Gunnison, San Juan, Animas and Dolores basins while the Colorado River continued to see a decline in reservoir storage. Small improvements were noted in many of the Front Range reservoirs. Water managers feel a certain sense of relief after ending the 2002 water year with reservoir storage volumes at just 48% of average. WY2003 and 2004 have not provided exceptional precipitation, and snowpack has been below average. Through careful water management and deliveries, and a little luck with good spring storms and summer rains, more water has been saved for use in future dry years. 100 90. October 1, 2004. Percent of Average. 80 70 60 50 40 30 20 10 0 Statewide. Gunnison. Colorado. South Platte. Arkansas. Rio Grande. San Juan*. *includes the Animas and Dolores basins. Figure 9. Reservoir storage at the end of the 2003 water year as a percent of average for each major watershed in Colorado.. 8. Conclusions and Historical Perspective Drought impacts lingered in Colorado throughout WY2004. While precipitation totals for the year were near average for the state as a whole, the distribution and timing resulted in below average runoff especially on the tributaries to the Colorado River and the South Platte. Several areas east of the Continental Divide enjoyed a wet year for a change, and summer temperatures were very cool – a sharp contrast with recent years. This was the 7th consecutive year with below average snowpack on April 1 – a key date for water resource planning and management decisions 290.
(13) A Review of the 2004 Water Year in Colorado. (Figure 10). Peak runoff occurred earlier than average on most of Colorado’s major rivers. Despite mediocre streamflows, reservoir levels improved slightly and ended the year at 77% of average, a 3% improvement over the previous year, and much better than the 48% of average at the end of WY2002. This was likely a testimony to water conservation efforts in many parts of the state. APRIL 1 SNOWPACK COLORADO STATEWIDE 160 148146. 140 130. 120. 126. 120 114. 109. Percent of Average. 127. 126. 119 109 104. 106. 112114. 99. 100 95. 105. 104104 97. 91 93. 85 87. 87. 80. 90. 89 84. 94 87. 74 65. 65 59. 60. 52 46. 40. 20. 0 68 69 70 71 72 73 74 75 76 77 78 79 80 81 82 83 84 85 86 87 88 89 90 91 92 93 94 95 96 97 98 99 00 01 02 03 04. Year. Figure 10. April 1 Snowpack for Colorado statewide in percent from 1968 through 2004.. The severe drought of 2002 appears to have taught some important lessons. All of Coloradans, at least for now, seem more sensitive and responsive to the fluctuations in water than just a few short years ago. Water conservation efforts in many cities have been very successful and ongoing. WY2004 ended with optimism. Improved soil moisture conditions as well as rangeland and forest health were observed over much of the state going into the fall of 2004.. 9. Acknowledgements Colorado Climate Center, Department of Atmospheric Science, College of Engineering, is funded by the Colorado Agricultural Experiment Station.. 291.
(14)
Figure


+5


Related documents
Jag har även utgått från att företagaren i varje exempel lyfter lön på 420 000 kr per år, detta har jag gjort för att dels uppfylla syftet med uppsatsen men också för
Detta är något som även respondent D uppfattar, respondenten anser att organisationen bör arbeta mer aktivt kring att synliggöra organisationen som arbetsgivare externt,
Enligt slitage- mätningar i fält har denna massa slitits mer än massorna inom hållbarhetsklass 2 efter en vinter och är bortsliten i hjulspår efter två vintrar. Om man på en väg
betydelse för barns utveckling och lärande, särskilt i relation till huruvida den fysiska lärandemiljön är tillgänglig eller inte och vilket material barnen har tillgång till...
De olika testmetoderna, som framtagits som förslag till europa- normer beskrivs i korthet, sådana med vägteknisk anknytning ut- förligare än metoder, t ex avsedda för
Den multikulturella organisationen beskrivs av Mlekov och Widell (2003, sid. Olikheter och nya tankesätt uppmuntras här på alla nivåer och samtliga medarbetare känner sig
I det här fallet anser författarna för den här litteraturstudien att Nightingales syn på omvårdnad om att endast kvinnor var bra på att vårda och ge personcentrerad vård
Leken är grunden för lärande och bör ha en central plats i förskolans verksamhet – den är viktig för barn då de genom leken kan utveckla en
