JHEP07(2019)117
Published for SISSA by SpringerReceived: January 25, 2019 Revised: June 25, 2019 Accepted: July 2, 2019 Published: July 19, 2019
Search for scalar resonances decaying into µ
+
µ
−
in
events with and without b-tagged jets produced in
proton-proton collisions at
√
s = 13 TeV with the
ATLAS detector
The ATLAS collaboration
E-mail:
atlas.publications@cern.ch
Abstract: A search for a narrow scalar resonance decaying into an opposite-sign muon
pair produced in events with and without b-tagged jets is presented in this paper. The
search uses 36.1 fb
−1of
√
s = 13 TeV proton-proton collision data recorded by the ATLAS
experiment at the LHC. No significant excess of events above the expected Standard Model
background is observed in the investigated mass range of 0.2 to 1.0 TeV. The observed
upper limits at 95% confidence level on the cross section times branching ratio for b-quark
associated production and gluon-gluon fusion are between 1.9 and 41 fb and 1.6 and 44 fb
respectively, which is consistent with expectations.
Keywords: Hadron-Hadron scattering (experiments)
JHEP07(2019)117
Contents
1
Introduction
1
2
ATLAS detector
3
3
Data and simulated event samples
4
4
Event reconstruction
6
5
Signal and background estimate
7
6
Statistical analysis
9
7
Systematic uncertainties
10
7.1
Experimental uncertainties
10
7.2
Theoretical uncertainties
12
8
Results
15
9
Conclusion
17
The ATLAS collaboration
24
1
Introduction
This paper presents a search, in proton-proton (pp) collision data at a centre-of-mass energy
of 13 TeV, targeting a scalar particle Φ with a mass in the range 0.2–1.0 TeV decaying into
two opposite-sign muons. The natural width of the particle is assumed to be much narrower
than the experimental resolution, such that it is the latter that dominates the distribution
of the dimuon invariant mass in signal events. To maximize the sensitivity to the presence of
b-quarks, the analysis is performed in two data categories. The first search category requires
at least one jet tagged as containing b-hadrons (b-tagged) in the final state. The second
category requires exactly zero b-tagged jets in the event. Simultaneous fits to these two
categories are used to search for both the gluon-gluon fusion and b-associated production
mechanisms of the scalar particle. This work is primarily motivated as a signature-based
search; the event selection is not designed to target any specific model and instead facilitates
the comparison of the data with predictions from various theoretical models.
The discovery of the 125 GeV Higgs boson at the Large Hadron Collider (LHC) [
1
,
2
]
was a significant step in understanding the mechanism of electroweak symmetry breaking
(EWSB). Measurements of the properties of this particle [
3
–
7
] are so far consistent with
JHEP07(2019)117
g
g
¯b
Φ
b
(a)g
g
Φ
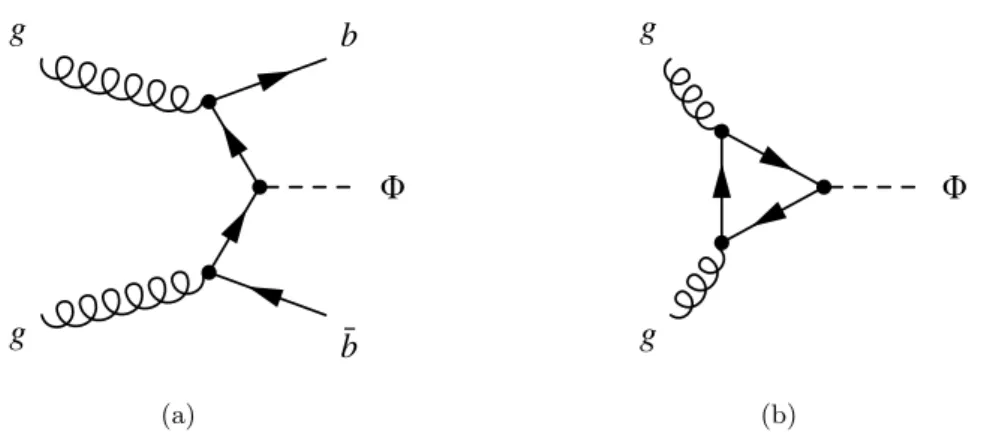
(b)Figure 1. Feynman diagrams for (a) the b-quark associated production mode and (b) the gluon-gluon fusion production mode.
boson could be only a part of an extended scalar sector, as predicted by several theoretical
models beyond the SM. For example, such an extended scalar sector is predicted by a class
of extensions of the SM known as the two-Higgs-doublet models (2HDM) [
14
,
15
].
The 2HDM posit the existence of three neutral bosons with properties and coupling
strengths differing from those of the SM Higgs particle. One of the higher-mass neutral
Higgs bosons may couple to muons at a higher rate than to τ -leptons, in contradiction to
the SM Yukawa ordering. This is the case in the Flavourful Higgs model [
16
], for example.
The search described in this paper sets limits on the cross-section times branching ratio of Φ
decaying into muon pairs which are more stringent than the equivalent limits for Φ decaying
into τ -lepton pairs [
17
]. This is due to higher identification efficiency and lower background
rate for muons than for τ -leptons, and the invariant-mass resolution being better for muon
pairs than for τ -lepton pairs. Similarly, the coupling of these higher-mass neutral Higgs
bosons to b-quarks could be enhanced relative to the SM Higgs boson coupling. Hence, the
production of Φ in association with b-quarks (bbΦ), shown in figure
1(a)
, could be more
abundant than the production of Φ by gluon-gluon fusion (ggF), shown in figure
1(b)
. The
Φ → b¯
b decay mode, where Φ is produced in associations with b-quarks, is investigated by
CMS in ref. [
18
].
Additional interest for the search for an excess of events with respect to the SM
predictions in the dimuon plus b-tagged jets final state arises from Z
0and leptoquark
models [
19
], which could result in either resonant or non-resonant contributions to the
pp → ttµ
+µ
−→ W bW ¯bµ
+µ
−final state. This work complements the search for Z
0candi-dates decaying into muon pairs presented in ref. [
20
]: by classifying events in terms of the
presence or absence of a b-tagged jet, it may be sensitive to signatures not observable with
an inclusive selection.
Previous similar searches focused explicitly on beyond-the-SM Higgs bosons decaying
into muon pairs, in the mass range 90–500 GeV [
21
,
22
] using
√
s = 7 and 8 TeV data. This
work extends the exclusion limits for new scalar resonances with masses up to 1.0 TeV.
The analysis described in this paper makes use of a fit to the observed dimuon invariant
JHEP07(2019)117
or via gluon-gluon fusion is tested with simultaneous fits to the two data regions (with and
without a b-tagged jet) separately for bbΦ and ggF production modes. No assumptions are
made about the relative contributions of the bbΦ and ggF cross-sections.
This paper is structured as follows. Section
2
describes the ATLAS detector.
Sec-tion
3
discusses the data and the simulated event samples used to model the signal and
the background processes. The event reconstruction is discussed in section
4
, while
sec-tion
5
describes the background estimate and introduces the signal interpolation procedure
used to model the m
µµdistribution for resonance mass hypotheses for which no simulated
sample was generated. The event yields and the description of the statistical analysis are
discussed in section
6
, followed by section
7
, which provides an overview of the systematic
uncertainties. Section
8
summarizes the results.
2
ATLAS detector
ATLAS [
23
–
25
] is a multipurpose particle detector with a forward-backward symmetric
cylindrical geometry and near 4π coverage in solid angle.
1It consists of an inner tracking
detector surrounded by a thin superconducting solenoid, electromagnetic and hadronic
calorimeters, and a muon spectrometer.
The inner tracking detector (ID) covers the pseudorapidity range |η| < 2.5, and is
surrounded by a superconducting solenoid providing a 2 T magnetic field. At small radii, a
high-granularity silicon pixel detector covers the vertex region and typically provides four
measurements per track. It is followed by the silicon microstrip tracker, which provides
eight measurement points per track. The silicon detectors are complemented by a gas-filled
straw-tube transition radiation tracker, which extends the tracking capability radially with
typically 35 measurements per track for particles at |η| = 2.0.
Electromagnetic (EM) calorimetry, within the region |η| < 3.2, is provided by
bar-rel and endcap high-granularity lead/liquid-argon (LAr) sampling calorimeters, with an
additional thin LAr presampler covering |η| < 1.8 to correct for energy loss in the
up-stream material. For |η| < 2.5 the EM calorimeter is divided into three layers in depth. A
steel/scintillator-tile calorimeter provides hadronic calorimetry for |η| < 1.7. LAr
ioniza-tion, with copper as absorber, is used for the hadronic calorimeters in the endcap region
1.5 < |η| < 3.2. The solid-angle coverage is completed with forward copper/LAr and
tungsten/LAr calorimeter modules in 3.1 < |η| < 4.9, optimized for EM and hadronic
measurements, respectively.
The muon spectrometer (MS) surrounds the calorimeters and comprises separate
trig-ger and high-precision tracking chambers measuring the deflection of muons in a magnetic
field provided by one barrel and two end-cap toroid magnets. The precision chamber
sys-tem covers the region |η| < 2.7 with three layers of monitored drift tubes, complemented
1
ATLAS uses a right-handed coordinate system with its origin at the nominal interaction point (IP) in the centre of the detector and the z-axis along the beam pipe. The x-axis points from the IP to the centre of the LHC ring, and the y-axis points upward. Cylindrical coordinates (r, φ) are used in the transverse plane, φ being the azimuthal angle around the z-axis. The pseudorapidity is defined in terms of the polar angle θ as η = − ln tan(θ/2). The angular distance is measured in units of ∆R =p(∆η)2+ (∆φ)2.
JHEP07(2019)117
by cathode-strip chambers in the forward region. The muon trigger system covers the
range |η| < 2.4 with resistive-plate chambers in the barrel and thin-gap chambers in the
endcap regions.
A two-level trigger and data acquisition system is used to record events for offline
analysis [
26
]. The level-1 trigger is implemented in hardware and uses a subset of the
detector information to reduce the event rate to a value of at most 100 kHz. It is followed
by a software-based high-level trigger which filters events using the full detector information
and outputs events for permanent storage at an average rate of 1 kHz.
3
Data and simulated event samples
This search is performed with a sample of pp collision data recorded at a centre-of-mass
energy
√
s =13 TeV corresponding to an integrated luminosity of 36.1 fb
−1collected during
2015 and 2016. Events are considered for further analysis only if they were collected under
stable LHC beam conditions and the relevant detector components were fully operational.
The data used in this analysis were collected using a combination of muon triggers.
For the 2015 dataset an isolated muon with transverse momentum p
Tgreater than 20 GeV
was required, while for 2016 this requirement was raised to 26 GeV. To avoid inefficiencies
due to the isolation requirement, these triggers were complemented by a trigger requiring
a reconstructed muon with p
Tgreater than 50 GeV, without any isolation requirements.
Simulated signal events were generated similarly to the SM Higgs boson H, where H
was replaced by a higher-mass scalar boson Φ with a constant width of 4 MeV. Nine Monte
Carlo (MC) samples were generated in the mass range 0.2–1.0 TeV at intervals of 100 GeV.
Both the ggF and bbΦ production modes were considered. Events were generated at
next-to-leading order (NLO) with Powheg-Box 2 [
27
–
30
] and MadGraph5 aMC@NLO [
31
,
32
],
for ggF and bbΦ respectively. The CT10 [
33
] set of parton distribution functions (PDFs) was
used in the generation of ggF events while CT10nlo nf4 [
34
] PDFs were used to produce
the b-quark associated signal samples in the four-flavour scheme. In the gluon-gluon fusion
production mode, Pythia 8.210 [
35
] with the AZNLO [
36
] set of tuned parameters was
used together with the CTEQ6L1 [
37
] PDF set for the parton shower, underlying event
and hadronization simulation. For the b-quark associated production, Pythia 8.210 with
the A14 [
38
] set of tuned parameters was used together with the NNPDF2.3LO [
39
set for the parton shower, underlying event, and hadronization simulation. The EvtGen
v1.2.0 program [
40
] was used to model the properties of the bottom and charm hadron
decays in all signal samples.
Since the generated signal samples are spaced equally in m
Φwhile the experimental
resolution increases with m
Φ, signal distributions for intermediate mass hypotheses were
obtained using an interpolation procedure, described in section
5
.
Events containing Z/γ
∗+ jets were simulated using Powheg-Box 2 [
29
,
41
] interfaced
to the Pythia 8.186 parton shower model and the CT10 PDF set. The AZNLO tune
was used, with PDF set CTEQ6L1 for the modelling of non-perturbative effects. The
EvtGen v1.2.0 program was used to model the properties of the bottom and charm hadron
JHEP07(2019)117
charged leptons. Generator-level filters are employed to enhance the fraction of simulated
events in the phase-space region that is most relevant for the analysis. Event yields were
corrected with a mass-dependent rescaling at next-to-next-to-leading order (NNLO) in
the QCD coupling constant, computed with VRAP 0.9 [
43
] and the CT14NNLO PDF
set [
34
].
Mass-dependent electro-weak (EW) corrections were computed at NLO with
mcsanc–1.20 [
44
], along with photon-induced contributions (γγ → `` via t- and u-channel
processes) computed with the MRST2004QED PDF set [
45
].
Additional Z/γ
∗+ jets events, used to evaluate the systematic uncertainty from the
modelling of the fitted m
µµdistribution, were simulated with Sherpa 2.2.1 [
46
] and with
MadGraph5 aMC@NLO interfaced with Pythia 8.186. In Sherpa, Z/γ
∗+ jets matrix
elements were evaluated with up to two extra partons at NLO, and three or four extra
partons were included at LO in QCD. The merging of different parton multiplicities was
achieved through a matching scheme based on the CKKW-L [
47
,
48
] merging technique
using a merging scale of Q
cut= 20 GeV. The models used for the parton shower and
underlying event are the ones provided internally by Sherpa. The Sherpa 2.2.1
gener-ator adopts a full five-flavour scheme, with massless b-quarks and c-quarks in the matrix
elements. These quarks are given mass in the final state and massive quarks can be
pro-duced directly via the parton shower. The MadGraph5 aMC@NLO v2 generator merges
the LO (QCD) matrix-element calculations for Z/γ
∗+ jets with up to four additional
par-tons (higher jet multiplicities are modelled by the parton shower algorithm). The merging
scheme applied to combine different parton multiplicities is the CKKW-L scheme with a
merging scale of Q
cut= 30 GeV. For the LO matrix-element calculation the NNPDF2.3 LO
PDFs were used (with α
S= 0.13). The A14 tune, together with the NNPDF2.3 LO PDFs,
was used for the parton shower. Similarly to Sherpa 2.2.1, MadGraph5 aMC@NLO
adopts a full five-flavour scheme.
For the generation of t¯
t and single top-quark production in the W t- and t-channel,
the Powheg-Box 2 generator with the CT10 PDF set was used for the matrix element
calculations. The parton shower, fragmentation, and the underlying event were simulated
using Pythia 6.428 with the CTEQ6L1 PDF set and the corresponding Perugia 2012
tune [
49
]. The top-quark mass was set to 172.5 GeV. For the generation of t¯
t events,
the h
dampparameter of Powheg-Box, which controls the transverse momentum of the
first additional emission beyond the Born configuration, was set to the mass of the top
quark. The main effect of this parameter is to regulate the high transverse momentum
emission against which the t¯
t system recoils. The t¯
t production sample was normalized
to the predicted production cross-section as calculated with the Top++2.0 program to
NNLO in perturbative QCD, including soft-gluon resummation to
next-to-next-to-leading-log (NNLL) order [
50
]. The normalization of the single top-quark event samples used an
approximate calculation at NLO in QCD for the t-channels [
51
,
52
] while NLO+NNLL
predictions were used for the W t-channel [
52
]. The EvtGen v1.2.0 program was used to
describe the properties of the bottom and charm hadron decays.
Diboson processes were modelled using the Sherpa 2.1.1 [
46
] generator and they were
calculated for up to one (ZZ) or zero (W W , W Z) additional partons at NLO and up to
JHEP07(2019)117
matrix-element generators. The matrix element calculation was merged with the Sherpa
internal parton shower [
55
] using the ME+PS@NLO prescription [
56
]. The CT10 PDF set
was used in conjunction with dedicated parton shower tuning developed by the Sherpa
authors. The generator cross-sections, calculated at NLO, were used in this case.
The generated signal samples were simulated with the fast simulation [
57
,
58
]
frame-work of ATLAS, which replaces the full simulation of the electromagnetic and hadronic
calorimeters by a parameterized model. The background samples were simulated using
the full Geant4-based simulation of the detector [
59
]. Finally, the simulated events were
processed through the same reconstruction software as the data. The effects of pile-up
from multiple proton-proton interactions in the same and neighbouring bunch crossings
were accounted for by overlaying minimum-bias events simulated using Pythia 8 with the
A2 tune [
60
] and interfaced with the MSTW2008LO PDFs. Simulated events were then
reweighted to match the pile-up conditions observed in the data.
4
Event reconstruction
Interaction vertices are reconstructed [
61
] from tracks measured by the inner detector. The
primary vertex is defined as the vertex with the largest
P p
2T
of its associated tracks. It
must have at least two associated tracks, each with transverse momentum p
T> 400 MeV.
Muon candidates are reconstructed from an ID track combined with a track or track
segment detected in the muon spectrometer [
62
]. These two tracks are used as inputs to
a combined fit (for p
Tless than 300 GeV) or to a statistical combination (for p
Tgreater
than 300 GeV) [
62
]. The combined fit takes into account the energy loss in the calorimeter
and multiple-scattering effects. The statistical combination for high transverse momenta
is performed to mitigate the effects of relative ID and MS misalignments. High-p
Tmuon
candidates are required to have at least three hits, one in each of the three layers of precision
chambers in the MS. For these muons, specific regions of the MS where the alignment is
suboptimal are vetoed as a precaution, as well as the transition region between the MS
barrel and endcap (1.01 < |η| < 1.10). Further quality requirements are applied to the
consistency of the ID and MS momentum measurements, and to the measured momentum
uncertainty for the MS track.
The reconstructed muon candidates are required to have transverse momentum, p
T,
greater than 30 GeV and pseudorapidity |η| < 2.5. They are further required to be
con-sistent with the hypothesis that they originate from the primary vertex by applying
selec-tions on the transverse (d
0) and longitudinal (z
0) impact parameters, defined relative to
the primary vertex position: |d
0/σ
d0| < 3 and |z
0sin θ| < 0.5 mm where σ
d0denotes the
uncertainty in the transverse impact parameter. A loose isolation requirement is applied,
based on the sum of the momenta of inner detector tracks which lie within a variable-sized
cone, with ∆R
max= 0.3, around the muon track. This isolation requirement is tuned to
yield a 99% efficiency over the full range of muon p
T.
Jets are reconstructed from noise-suppressed energy clusters in the calorimeter [
63
]
with the anti-k
talgorithm [
64
,
65
] with radius parameter R = 0.4. The energies of the jets
JHEP07(2019)117
in situ studies using data [
66
]. All jets are required to have p
T> 25 GeV and |η| < 4.5. A
multivariate selection that reduces contamination from pile-up [
67
] is applied to jets with
p
T< 60 GeV and with |η| < 2.4 utilizing calorimeter and tracking information to separate
hard-scatter jets from pile-up jets.
Selected jets in the central region can be tagged as containing b-hadrons (b-tagged) by
using a multivariate discriminant (MV2c10) [
68
,
69
] that combines information from an
impact-parameter-based algorithm, from the explicit reconstruction of a secondary vertex
and from a multi-vertex fitter that attempts to reconstruct the full b- to c-hadron decay
chain. At the chosen working point, the algorithm provides nominal light-flavour
(u,d,s-quark and gluon) and c-jet misidentification rates of 3% and 32%, respectively, for an
average 85% b-jet tagging efficiency, as estimated from simulated t¯
t events for jets with
p
T> 20 GeV and |η| < 2.5. The flavour-tagging efficiencies from simulation are corrected
separately for b-, c- and light-flavour jets, based on the respective data-based calibration
analyses [
70
].
Simulated events were corrected to reflect the muon and jet momentum scales and
reso-lutions, b-jet identification algorithm calibration, as well as the muon trigger, identification,
and isolation efficiencies measured in data.
An overlap removal procedure is applied to avoid a single particle being reconstructed
as two different objects as follows. Jets not tagged as b-jets, but which are reconstructed
within ∆R = 0.2 of a muon, are removed if they have fewer than three associated tracks
or if the muon energy constitutes more than 50% of the jet energy. Muons reconstructed
within a cone of size ∆R = min (0.4, 0.04 + 10 GeV/p
T) around the jet axis of any surviving
jet are removed. Jets are also discarded if they are within a cone of size ∆R = 0.2 around
an electron candidate. Electrons are reconstructed from clusters of energy deposits in the
electromagnetic calorimeter that match ID tracks, and are identified as described in ref. [
71
].
For electrons with transverse energy E
T> 10 GeV and pseudorapidity of |η| < 2.47, a
likelihood-based selection is used at the “loose” operating point defined in [
71
].
Following the overlap removal, jet cleaning criteria are applied to identify jets arising
from non-collision sources or noise in the calorimeters, and any event containing such a jet
is removed [
72
].
The missing transverse momentum, E
Tmiss, is defined as the negative vector sum of the
transverse momenta of muons, electrons and jets associated with the primary vertex. A
soft term [
73
] is added to include well-reconstructed tracks matched to the primary vertex
that are not associated with any of the objects.
At least two reconstructed muons are required in the event, and the two highest-p
Tmuons of the event are used to form a dimuon candidate. If these muons do not have
opposite charges, the event is rejected.
5
Signal and background estimate
Events satisfying the preselection criteria of section
4
are considered for further analysis.
Depending on the value of the reconstructed dimuon invariant mass and the number of
b-tagged jets, they are classified as being in either a control region, used to measure the
JHEP07(2019)117
rate of the dominant backgrounds (Z/γ
∗+ jets and t¯
t) or a signal region, used to search for
the Φ → µµ signal. All signal and control regions are designed to be orthogonal.
Selected events are retained in the signal region if the dimuon invariant mass, m
µµ,
exceeds 160 GeV, while they are retained in the control region if 100 GeV < m
µµ< 160 GeV.
The control regions do not include the Z-boson peak; this avoids constraints on systematic
uncertainties in a region of phase space which may behave differently with respect to the
high mass tails where the signal search is focused.
Events in the signal region are further classified as “SRbTag”, if at least one b-tagged
jet is identified in the event, or “SRbVeto”, otherwise. No further optimization of the
signal region definition is considered, in order to minimize the assumptions made about
the signal kinematics.
Events in the control region are further classified as “CRbVeto” if there is no b-tagged
jet identified in the event, while remaining control region events are classified as “CRbTag”,
if the missing transverse momentum is less than 100 GeV, or “CRttbar” otherwise.
The dominant background sources for this signature are muon pairs through
Z/γ
∗+ jets, top-quark pair, and diboson production. W +jets and QCD multi-jet events
contribute less than 0.01% to the total background in signal regions, and therefore are
neglected. All relevant background contributions were modelled using simulated samples
as described in section
3
.
Simulated Z/γ
∗+ jets events were categorized depending on the generator-level “truth”
labels of the jets in the event. Simulated jets were truth-labelled according to which hadrons
with p
T> 5 GeV were found within a cone of size ∆R = 0.3 around the jet axis. If a
b-hadron was found, the jet was truth-labelled as a b-jet. If no b-b-hadron was found, but a
c-hadron was present, then the jet was truth-labelled as a c-jet. Otherwise the jet was
truth-labelled as a light-flavour (i.e., u,d,s-quark, or gluon) jet. The Z/γ
∗+ jets events
were classified as Z+ heavy flavour (Z+ HF) if a b-jet or c-jet was found at generator level
and Z+ light flavour (Z+ LF) otherwise. These two categories of simulated events were
treated as different background components.
The predictions for the expected numbers of t¯
t, Z+ HF and Z+ LF events are adjusted
to match the number of events in data in the control regions via a global fit (see section
6
),
while the other backgrounds are normalized to their expected cross-section, discussed in
section
3
.
The expected invariant mass distribution of the narrow resonance signal m
Φis modelled
with a double-sided Crystal Ball (DSCB) [
74
] function in the mass range 0.2 TeV < m
Φ<
1.0 TeV for all nine simulated MC samples. The width of the m
µµdistribution is dominated
by the experimental resolution, which can be described by a Gaussian distribution. The
power-law asymmetric terms of the DSCB have enough degrees of freedom to model the
m
µµtails for signals in the 0.2–1.0 TeV mass range. In order to interpolate the signal
param-eterization to any mass value in this fit range, second-order polynomial paramparam-eterizations
of all six signal-shape parameters as a function of m
Φare obtained from a simultaneous fit
to all the generated mass points m
Φ, separately for events with and without at least one
b-tagged jet. Since all signal samples are scaled to the same arbitrary cross-section, any
differences in the number of events are due to differences in the acceptances of the
selec-JHEP07(2019)117
tion. The fitted normalization is parameterized with a second-order polynomial in a similar
way to the other DSCB parameters. As a result of this procedure, the m
µµdistribution
for an arbitrary hypothesis mass can be found by constructing a DSCB from parameters
calculated using the fitted coefficients and the hypothesized mass m
Φ. The interpolation
is performed separately for each systematic variation, and for the gluon-gluon fusion and
b-quark associated production signal samples. Binned templates are then generated from
the DSCB. To validate the interpolation procedure, one simulated sample at a time is
re-moved from the simultaneous fit, and the template generated from the DCSB is compared
with the m
µµdistribution from the corresponding simulated sample and they agree within
2–5%, the size of the bin-by-bin MC statistical uncertainty. Nine MC samples were
gener-ated in the mass range 0.2–1.0 TeV, every 100 GeV. The interpolation procedure was used
to generate signal templates every 10 GeV between 0.2 and 0.3 TeV, every 20 GeV between
0.3 and 0.6 TeV, and every 50 GeV between 0.6 and 1.0 TeV.
The acceptance of b-quark associated production in the SRbTag region varies in the
range 11–19% depending on m
Φ. The acceptance in the SRbVeto region, which is inversely
correlated with the SRbTag one, varies from 20% to 15%. For this reason, both SRbTag
and SRbVeto are included in the global fit (see section
6
). The acceptance of gluon-gluon
fusion in the SRbVeto region varies in the range 31–35%. The acceptance in the SRbTag
is less than 2% for all masses.
6
Statistical analysis
The test statistic ˜
q
µas defined in ref. [
75
] is used to determine the probability that the
background-only model is compatible with the observed data, to extract the local p-value,
and, if no hint of a signal is found in this procedure, to derive exclusion intervals using the
CL
smethod. The binned likelihood function is built as the product of Poisson probability
terms associated with the bins in the m
µµdistribution in the 0.16–1.5 TeV range. It depends
on the parameter of interest, on the normalization factors of the dominant backgrounds and
on additional nuisance parameters (representing the estimates of the systematic
uncertain-ties) that are each constrained by a Gaussian prior. The bin-by-bin statistical uncertainties
of the simulated backgrounds are also considered. Separate fits are performed to test the
different hypotheses: only bbΦ signal, only ggF signal, and signal composed of different
mixtures of the two production modes. Data are fitted in the 0.16–1.5 TeV range to check
that the background description is correct and to constrain systematic uncertainties, while
the signal presence is tested in a narrower 0.2–1.0 TeV range.
Logarithmic binning in m
µµis chosen to scale with experimental dimuon mass
resolu-tion (defined as full-width at half-maximum), which varies from 5% at m
µµ= 200 GeV to
14% at m
µµ= 1 TeV, while ensuring that the number of simulated background events in
each bin is sufficient to reliably predict the background. The numbers of events in the
CR-bVeto, CRbTag, and CRttbar control regions are also included in the maximum-likelihood
fit. Data in these regions are used to constrain the normalizations of the dominant
back-ground processes: Z+ LF, Z+ HF, and t¯
t. The normalization factors used to scale the
JHEP07(2019)117
Background Asimov data Observed dataZ+ HF 1.00 ± 0.23 1.47 ± 0.26 Z+ LF 1.00 ± 0.02 1.02 ± 0.02 t¯t 1.00 ± 0.04 1.02 ± 0.04
Table 1. Normalization factors of the dominant backgrounds as measured in a fit to data under the background plus signal hypothesis (480 GeV bbΦ signal). The uncertainty includes both the statistical and systematic sources: the latter ones dominate. The reduction of the observed relative uncertainty of the Z+ HF normalization in the data fit is due to the large increase in the number of Z+ HF events when the data in signal regions are included.
fit. Their expected uncertainty is estimated using an Asimov dataset [
75
], a pseudo-data
distribution equal to the background plus signal expectation for a given value of the signal
cross-section times branching ratio. The expected and measured normalization factors are
shown in table
1
. They are measured in a fit to data under the background plus signal
hypothesis, where the signal corresponds to bbΦ production with mass m
Φ= 480 GeV.
As discussed in section
7
, the experimental uncertainties are treated as fully
corre-lated among different processes and regions, while the theoretical uncertainties are mostly
uncorrelated among processes.
The numbers of observed events in the signal regions together with the predicted
event yields from signal and background processes are shown in table
2
. The numbers
are the results of the maximum-likelihood fit to data under the background plus signal
hypothesis, where the signal corresponds to bbΦ production with m
Φ= 480 GeV. The
number of predicted signal events corresponds to the expected upper limit (UL) times the
cross-section: this highlights the comparison between signal and background at the edge
of the analysis sensitivity.
The observed numbers of events are compatible with those expected from SM processes,
within uncertainties. The m
µµdistribution in the SRbTag region is shown in figure
2(a)
for
a bbΦ-only fit. The m
µµdistribution in the SRbVeto region is shown in figure
2(b)
, for a
ggF-only fit. Each background process is normalized according to its post-fit cross-section.
The templates for the m
Φ=200 GeV, m
Φ=480 GeV and m
Φ=1 TeV mass hypotheses are
normalized to the expected upper limit.
7
Systematic uncertainties
The sources of systematic uncertainty can be divided into three groups: those of
exper-imental origin, those related to the modelling of the simulated backgrounds, and those
associated with signal simulation. The finite size of the simulated background samples is
also an important source of uncertainty.
7.1
Experimental uncertainties
The dominant experimental uncertainties originate from residual mismodelling of the muon
reconstruction and selection after the simulation-to-data efficiency correction factors have
been applied. They include the uncertainty obtained from Z → µµ data studies and a
JHEP07(2019)117
Sample SRbTag SRbVeto CRbTag CRbVeto CRttbar
t¯t 16 490 ± 240 2 090 ± 300 16 300 ± 600 2 320 ± 350 4 160 ± 70 Single top 1 470 ± 100 480 ± 50 1 340 ± 100 530 ± 50 297 ± 22 Diboson 176 ± 23 2 570 ± 180 280 ± 40 4 550 ± 310 19 ± 5 Z+ HF 1 920 ± 320 3 400 ± 700 13 300 ± 1 900 25 000 ± 5 000 18 ± 9 Z+ LF 1 060 ± 330 57 700 ± 900 6 300 ± 2 000 501 000 ± 5 000 10 ± 9 Total Bkg 21 110 ± 140 66 240 ± 250 37 530 ± 200 533 100 ± 700 4 500 ± 60 bbΦ (UL) 37+14−10 45+18−13 ggF (UL) 4+2−1 73+28−21 Data 21 154 66 300 37 527 533 134 4 511
Table 2. Post-fit numbers of events from the combined fit under the background plus signal hy-pothesis (480 GeV bbΦ signal). Here “Total Bkg” represents the sum of all backgrounds. The quoted uncertainties are the combination of statistical and systematic uncertainties. The uncertainty in the total background determined by the fit is smaller than the sum in quadrature of the individual components due to the normalization factors and systematic uncertainties that introduce correlation between them. The number of signal events corresponds to the expected upper limit (UL) times the cross-section. The uncertainties in the expected signal yields are from fits using the Asimov dataset. 200 400 600 800 1000 1200 1400 Events 1 − 10 1 10 2 10 3 10 4 10 5 10 Z+jets(LF) Z+jets(HF) t t Single top Diboson Data Uncertainty (200) Φ bb (480) Φ bb (1000) Φ bb ATLAS -1 =13TeV, 36.1 fb s µ µ → Φ SRbTag [GeV] µ µ m 200 400 600 800 1000 1200 1400 Data/Bkg 0.8 1 1.2 (a) 200 400 600 800 1000 1200 1400 Events 1 − 10 1 10 2 10 3 10 4 10 5 10 Z+jets(LF) Z+jets(HF) t t Single top Diboson Data Uncertainty ggF (200) ggF (480) ggF (1000) ATLAS -1 =13TeV, 36.1 fb s µ µ → Φ SRbVeto [GeV] µ µ m 200 400 600 800 1000 1200 1400 Data/Bkg 0.8 1 1.2 (b)
Figure 2. Distributions of the dimuon invariant mass, mµµ, after the combined fit to data are
shown normalized: (a) in the SRbTag, under the background plus signal hypothesis (480 GeV bbΦ signal) and (b) in the SRbVeto, under the background plus signal hypothesis (480 GeV ggF signal). The fit for a mΦ=480 GeV signal corresponds to the largest excess observed above the background
expectation. Each background process is normalized according to its post-fit cross-section. The templates for the mΦ =200 GeV, mΦ =480 GeV and mΦ=1 TeV mass hypotheses are normalized
to the expected upper limit. The data are shown by the points, while the size of the statistical uncertainty is shown by the error bars. The last bin includes the overflow. The blue arrows represent the data points outside of the frame. The hatched band shows the total systematic uncertainty of the post-fit yield.
JHEP07(2019)117
high-p
Textrapolation uncertainty corresponding to the decrease in the muon
reconstruc-tion and selecreconstruc-tion efficiency with increasing p
Twhich is predicted by the MC simulation.
The degradation of the muon reconstruction efficiency was found to be approximately 3%
per TeV as a function of muon p
T. Uncertainties in the isolation and trigger efficiencies of
muons [
62
], along with the uncertainty in their energy scale and resolution, are estimated
from Z → µµ data taken at
√
s =13 TeV. These are found to have only a small impact (they
account for < 0.4% of the total uncertainty on the fitted value of the signal cross-sections).
Other sources of experimental uncertainties are the residual differences in the modelling
of the flavour-tagging algorithm, the jet energy scale and the jet energy resolution after
the simulation-to-data correction factors are applied. Flavour-tagging simulation-to-data
efficiency correction factors are derived [
68
] separately for b-jets, c-jets, and light-flavour
jets. All three correction factors depend on jet p
T(or p
Tand |η|) and are affected by
uncer-tainties from multiple sources. These are decomposed into uncorrelated components which
are then treated independently, resulting in three uncertainties for b-jets and for c-jets, and
five for light-flavour jets. The approximate size of the uncertainty in the tagging efficiency
is 2% for b-jets, 10% for c-jets and 30% for light-flavour jets. Additional uncertainties are
considered in the extrapolation of the b-jet efficiency calibration above p
T= 300 GeV and
in the misidentification of hadronically decaying τ -leptons as b-jets. The uncertainties in
the jet energy scale and resolution are based on their respective measurements in data [
66
].
The many sources of uncertainty in the jet energy scale correction are decomposed into
21 uncorrelated components which are treated as being independent of one another. An
additional uncertainty that specifically affects the energy calibration of b- and c-jets is
considered.
The uncertainties in the energy scale and resolution of the jets and leptons are
prop-agated to the calculation of E
Tmiss, which also has additional uncertainties from the scale,
resolution, and efficiency of the tracks used to define the soft term, along with the modelling
of the underlying event.
The pile-up modelling uncertainty is assessed by varying the number of pile-up
interac-tions in simulated events. The variainterac-tions are designed to cover the uncertainty in the ratio
of the predicted and measured cross-section of non-diffractive inelastic events producing a
hadronic system of mass m
X> 13 GeV [
76
].
The uncertainty in the combined 2015+2016 integrated luminosity is 2.1%. It is
de-rived, following a methodology similar to that detailed in ref. [
77
], and using the LUCID-2
detector for the baseline luminosity measurements [
78
], from calibration of the luminosity
scale using x–y beam-separation scans.
7.2
Theoretical uncertainties
Background processes.
As discussed earlier, the rates of major backgrounds are
mea-sured using data control regions, thus theoretical uncertainties in the predicted cross-section
for Z/γ
∗+ jets and t¯
t processes are not considered. Instead, the effects of theoretical
uncer-tainties in the modelling of the m
µµdistribution and in the ratio of the event yields in signal
regions to those in the control regions are evaluated. The dominant theoretical uncertainties
JHEP07(2019)117
For both the Z+ LF and Z+ HF processes, the following sources of theoretical and
modelling uncertainties are considered: PDF uncertainties (estimated via eigenvector
vari-ations and by comparing different PDF sets), limited accuracy of the fixed-order calculation
(estimated by QCD scale variations), variations in the choice of strong coupling constant
value (α
S(M
Z)), EW corrections, and photon-induced corrections. These variations are
treated as fully correlated between Z+ LF and Z+ HF processes.
The PDF variation uncertainty is obtained using the 90% confidence level (CL)
CT14NNLO PDF error set and by following the procedure described in refs. [
79
,
80
].
Rather than a single nuisance parameter to describe the 28 eigenvectors of this PDF error
set, which could lead to an underestimation of its effect, a re-diagonalized set of 7 PDF
eigenvectors was used [
34
]. This represents the minimal set of PDF eigenvectors that
main-tains the necessary correlations, and the sum in quadrature of these eigenvectors matches
the original CT14NNLO error envelope well. They are treated as separate nuisance
pa-rameters. The uncertainties due to the variation of PDF scales and α
Sare derived using
VRAP. The former is obtained by varying the renormalization and factorization scales of
the nominal CT14NNLO PDF up and down simultaneously by a factor of two. The value
of α
Sused (0.118) is varied by ±0.002. The EW correction uncertainty was assessed by
comparing the nominal additive (1 + δ
EW+ δ
QCD) treatment with the multiplicative
ap-proximation ((1 + δ
EW)(1 + δ
QCD)) treatment of the EW correction in the combination of
the higher-order EW and QCD effects. The uncertainty in the photon-induced correction
is calculated from the uncertainties in the quark masses and the photon PDF. Following
the recommendations of the PDF4LHC forum [
80
], an additional uncertainty due to the
choice of nominal PDF set is derived by comparing the central values of CT14NNLO with
those from other PDF sets, namely MMHT14 [
81
] and NNPDF3.0 [
82
]. The maximum
width of the envelope of these comparisons is used as the PDF choice uncertainty, but only
if it is larger than the width of the CT14NNLO PDF eigenvector variation envelope.
An additional modelling uncertainty is considered for the Z+ HF process. The m
µµspectrum simulated by Powheg was compared with those simulated with Sherpa 2.2.1 [
46
]
and with MadGraph5 aMC@NLO interfaced with Pythia 8.186.
A functional
form was chosen to describe the envelope of the differences in the m
µµdistribution
shape between events with at least one b-quark simulated by Sherpa 2.2.1 and
Mad-Graph5 aMC@NLO v2.
These systematic uncertainties not only imply uncertainties in the shape of the m
µµdistribution in the signal region, but they also affect the ratio of the expected number of
events in the signal region to the expected number in the control region. The effect on the
Z+ LF normalization in the bVeto signal region is 2%, while the size of the uncertainty
for Z+ HF in the bTag signal region is 7%.
Moreover, the ratio of the expected number of Z+ LF events in the bVeto control
region to the events in bTag control and signal regions was estimated with the nominal
Powheg+Pythia Z+jet sample, and with the alternative MadGraph5 aMC@NLO v2
sample. To cover the observed difference between the two, an additional uncertainty of
27% in the normalization of the Z+ LF process in the bTag signal and control region
was applied.
JHEP07(2019)117
For the t¯
t process, theoretical uncertainties in the modelling of the m
µµspectrum and
in the extrapolation from control region to signal region are also considered. These are
esti-mated by comparing the nominal prediction with alternative ones. To estimate the impact
of initial and final state radiation modelling, two alternative Powheg+Pythia samples
were generated with the following parameters. In the first one, the renormalization (µ
r)
and factorization (µ
f) scale were varied by a factor of 0.5, the value of h
dampwas doubled
(2m
t) and the corresponding Perugia 2012 radiation tune variation was used. In the second
sample, the renormalization and factorization scales were varied by a factor of 2, while the
h
dampparameter was not changed. The associated variation from the Perugia 2012 tune
was used. These choices of parameters have been shown to encompass the cases where µ
rand µ
fare varied independently, and covered the measured uncertainties of the data for
un-folded t¯
t distributions [
83
,
84
]. Differences in parton shower and hadronization models were
investigated using a sample where Powheg-Box was interfaced with Herwig++ 2.7.1 [
85
]
with the UE-EE-5 tune [
38
] and the corresponding CTEQ6L1 PDFs. The nominal sample
was also compared with a sample generated with MadGraph5 aMC@NLO 2.2.1 [
31
]
interfaced with Herwig++. A NLO matrix element and CT10 PDF were used for the t¯t
hard-scattering process. The parton shower, hadronization and the underlying events were
modelled using the Herwig++ 2.7.1 generator. The UE-EE-5 tune and the corresponding
CTEQ6L1 PDF were used. A functional form was chosen to encompass the differences in
the m
µµdistribution shape between the nominal sample and all these alternative samples.
These samples were also used to estimate the 3.5% extrapolation uncertainty from CRttbar
to the SRbTag.
Theoretical uncertainties that arise from higher-order contributions to the
cross-sections and PDFs and affect the values of the predicted cross-cross-sections for the diboson
and single-top backgrounds are considered.
Signal processes.
Uncertainties related to signal modelling include the uncertainties
associated with the initial- and final-state radiation, the modelling of underlying events,
the choice of the renormalization and factorization scales, and the parton distribution
functions. None of them has a sizeable effect on the shape of the m
µµspectra, but some
of them do affect the acceptance in the signal regions. Uncertainties for the different mass
hypotheses were evaluated, but for simplicity, only the largest of the values is used. In the
calculation of the uncertainties, appropriate requirements on the muon and jets kinematics
are applied at hadron level for the SRbTag and SRbVeto regions.
The factorization and renormalization scales were varied by a factor of two up and
down, including correlated and anti-correlated variations, both in Powheg-Box and in
MG5 aMC@NLO. For the bbΦ process, the largest deviation from the value of the
nom-inal acceptance is considered as the fnom-inal scale uncertainty (2% in SRbTag, and 1% in
SRbVeto). A 25% uncertainty for the acceptance of ggF events in the SRbTag is
consid-ered, as well as its anti-correlated effect in the SRbVeto region, following the procedure
adopted in ref. [
86
].
The PDF uncertainties are estimated by taking the envelope of the changes in the
JHEP07(2019)117
set for the ggF (bbΦ) signal process. They correspond to changes in acceptances not larger
than 1%.
Systematic variations of the parameters of the A14 (for bbΦ) and AZNLO (for ggF)
tunes are used to account for the uncertainties associated with the initial and final state
radiation and the modelling of underlying events. For bbΦ, these uncertainties correspond
to changes of 3.8% and 3.2% of the acceptance in the SRbTag and SRbVeto regions. They
are associated with a migration of events from one signal region to the other, hence they
are treated as anti-correlated between the two signal regions. For ggF, the uncertainty in
the SRbVeto is negligible (< 0.5%), while it is 3.8% in the SRbTag.
As discussed in section
3
, the signal samples were simulated with the fast
simula-tion framework of ATLAS, which replaces the full simulasimula-tion of the electromagnetic and
hadronic calorimeters by a parameterized model. No significant differences in acceptance
and dimuon invariant mass were observed between a limited number of fast simulation
sig-nal samples and samples generated with full Geant4-based simulation, hence no systematic
uncertainty is considered for the use of fast simulation.
The current result is dominated by the statistical uncertainty of the data (which
ac-counts for 66% of the total uncertainty on the fitted value of the signal cross-section), and
the systematic uncertainty due to the finite size of the simulated background samples (which
accounts for 25% of the total uncertainty). Amongst the remaining systematic
uncertain-ties, the modelling of the shape of the m
µµdistribution for the Z+jets and top-antitop
backgrounds dominates (3% of the total uncertainty) followed by the muon identification
efficiency (1.5%). All other considered sources of experimental and theoretical
uncertain-ties (which individually have an impact < 0.4%) have a combined contribution of less than
5% to the total uncertainty on the upper limit.
8
Results
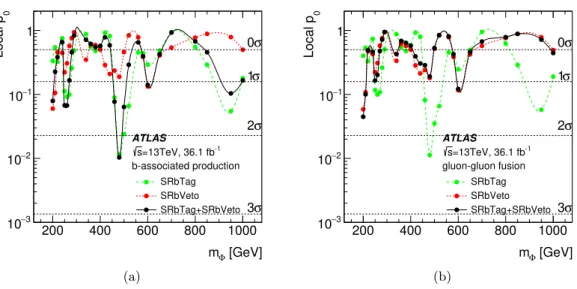
The observed p-values as a function of m
Φ, obtained applying the statistical analysis
de-scribed in section
6
, are shown in figure
3(a)
for the bbΦ-only fit and in figure
3(b)
for
the ggF-only fit. The lines in each figure correspond to separate fits. The dotted line
represents the p-value for a fit including only SRbTag and all control regions (CRs), the
dashed line represents the p-value for a fit including only SRbVeto+CRs, while the solid
line corresponds to the combined SRbTag+SRbVeto+CRs fit. The dotted lines in the two
figures show similar behaviour and so do the dashed lines, while the combined p-values
are calculated for separate signal production modes implying very different contributions
from the SRbVeto and SRbTag regions, which lead to substantially different limits. The
largest excess of events above the expected background is observed for the b-quark
associ-ated production at about m
Φ= 480 GeV and amounts to a local significance of 2.3σ, which
becomes 0.6σ after considering the look-elsewhere effect over the mass range 0.2–1.0 TeV.
The look-elsewhere effect is estimated using the method described in ref. [
87
].
Since the data are in agreement with the predicted backgrounds the results are given
in terms of exclusion limits. These are set using the modified frequentist CL
smethod [
88
].
JHEP07(2019)117
[GeV] Φ m 200 400 600 800 1000 0 Local p 3 − 10 2 − 10 1 − 10 1 σ 0 σ 1 σ 2 σ 3 SRbTag SRbVeto SRbTag+SRbVeto ATLAS -1 =13TeV, 36.1 fb s b-associated production (a) [GeV] Φ m 200 400 600 800 1000 0 Local p 3 − 10 2 − 10 1 − 10 1 σ 0 σ 1 σ 2 σ 3 SRbTag SRbVeto SRbTag+SRbVeto ATLAS -1 =13TeV, 36.1 fb s gluon-gluon fusion (b)Figure 3. Observed p-values as a function of mΦfor (a) a bbΦ-only fit and (b) a ggF-only fit. The
dotted line corresponds to the data in the SRbTag only, the dashed line to the data in SRbVeto only, and the solid curve to the combination of the two data categories. All three fits include data from all control regions.
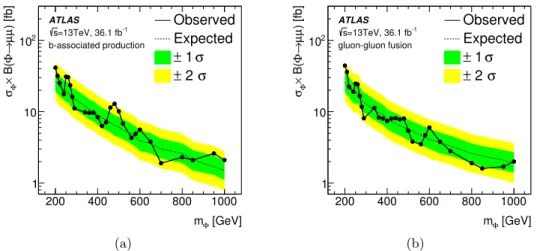
at the 95% confidence level (CL) as a function of the particle mass. The upper limits at 95%
CL on σ
Φ× B(Φ → µµ) (where σ
Φis the cross section and B is the branching ratio) assume
the natural width of the resonance to be negligible compared to the experimental resolution,
and they cover the mass range 0.2–1.0 TeV. In figure
4(a)
and
4(b)
the 95% CL upper limits
are shown for b-quark associated production and gluon-gluon fusion, respectively. The
expected limits are in the ranges 1.3–25 fb and 1.8–25 fb, respectively. The observed limits
are in the ranges 1.9–41 fb and 1.6–44 fb, respectively. Both the expected and observed
limits are calculated in the asymptotic approximation [
75
], which was verified with MC
pseudo-experiments for the m
Φ= 1000 GeV hypothesis.
The upper limit on the ggF
production mode is dominated by the SRbVeto, while for the bbΦ production mode both
the SRbTag and SRbVeto regions contribute to the result because of the relative acceptance
of the bbΦ production mode in the two regions. Limits shown in figure
4
are obtained in
simultaneous fits of the SRbVeto and SRbTag data regions and correspond to the different
signal production modes. Usage of the same data events in both the bbΦ-only and the
ggF-only fits explains correlations in the behaviour of the observed limits.
Figures
5(a)
and
5(b)
show the observed and expected 95% CL upper limits on the
production cross section times branching ratio for Φ → µµ as a function of the fractional
contribution from b-quark associated production (σ
bbΦ/[σ
bbΦ+ σ
ggF]) and the scalar
reso-nance mass. These fractions are derived assuming that other production mechanisms do
not affect the result.
A complete set of tables and figures are available at the Durham HepData
JHEP07(2019)117
[GeV] Φ m 200 400 600 800 1000 ) [fb] µ µ → Φ B( × Φ σ 1 10 2 10 Observed Expected σ 1 ± σ 2 ± ATLAS -1 =13TeV, 36.1 fb s b-associated production (a) [GeV] Φ m 200 400 600 800 1000 ) [fb] µ µ → Φ B( × Φ σ 1 10 2 10 Observed Expected σ 1 ± σ 2 ± ATLAS -1 =13TeV, 36.1 fb s gluon-gluon fusion (b)Figure 4. The observed and expected 95% CL upper limits on the production cross section times branching ratio for a massive scalar resonance produced via (a) b-quark associated production and (b) gluon-gluon fusion. [GeV] Φ m 200 400 600 800 1000 ) ggF σ + Φ bb σ /( Φ bb σ 0 0.2 0.4 0.6 0.8 1 1.2 ) [fb] µ µ → Φ B( × Φ σ 0 10 20 30 40 50 ATLAS -1 =13TeV, 36.1 fb s
observed upper limit at 95% CL
(a) [GeV] Φ m 200 400 600 800 1000 ) ggF σ + Φ bb σ /( Φ bb σ 0 0.2 0.4 0.6 0.8 1 1.2 ) [fb] µ µ → Φ B( × Φ σ 0 10 20 30 40 50 ATLAS -1 =13TeV, 36.1 fb s
expected upper limit at 95% CL
(b)
Figure 5. The (a) observed and (b) expected 95% CL upper limit on the production cross section times branching ratio for Φ → µµ as a function of the fractional contribution from b-quark associated production and the scalar boson mass.
9
Conclusion
The ATLAS detector at the LHC has been used to search for a massive scalar resonance
decaying into two opposite-sign muons, produced via b-quark associated production or via
gluon-gluon fusion, assuming that the natural width of the resonance is negligible compared
to the experimental resolution. The search is conducted with 36.1 fb
−1of pp collision data
at
√
s = 13 TeV, recorded during 2015 and 2016. The observed dimuon invariant mass
spectrum is consistent with the Standard Model prediction within uncertainties for events
both with and without a b-tagged jet over the 0.2–1.0 TeV range. The observed upper limits
at 95% confidence level on the cross-section times branching ratio for b-quark associated
production and gluon-gluon fusion are between 1.9 and 41 fb and 1.6 and 44 fb respectively,
which is consistent with expectations.
JHEP07(2019)117
Acknowledgments
We thank CERN for the very successful operation of the LHC, as well as the support staff
from our institutions without whom ATLAS could not be operated efficiently.
We acknowledge the support of ANPCyT, Argentina; YerPhI, Armenia; ARC,
Aus-tralia; BMWFW and FWF, Austria; ANAS, Azerbaijan; SSTC, Belarus; CNPq and
FAPESP, Brazil; NSERC, NRC and CFI, Canada; CERN; CONICYT, Chile; CAS, MOST
and NSFC, China; COLCIENCIAS, Colombia; MSMT CR, MPO CR and VSC CR,
Czech Republic; DNRF and DNSRC, Denmark; IN2P3-CNRS, CEA-DRF/IRFU, France;
SRNSFG, Georgia; BMBF, HGF, and MPG, Germany; GSRT, Greece; RGC, Hong Kong
SAR, China; ISF and Benoziyo Center, Israel; INFN, Italy; MEXT and JSPS, Japan;
CNRST, Morocco; NWO, Netherlands; RCN, Norway; MNiSW and NCN, Poland; FCT,
Portugal; MNE/IFA, Romania; MES of Russia and NRC KI, Russian Federation; JINR;
MESTD, Serbia; MSSR, Slovakia; ARRS and MIZˇ
S, Slovenia; DST/NRF, South Africa;
MINECO, Spain; SRC and Wallenberg Foundation, Sweden; SERI, SNSF and Cantons of
Bern and Geneva, Switzerland; MOST, Taiwan; TAEK, Turkey; STFC, United Kingdom;
DOE and NSF, United States of America. In addition, individual groups and members
have received support from BCKDF, CANARIE, CRC and Compute Canada, Canada;
COST, ERC, ERDF, Horizon 2020, and Marie Sk lodowska-Curie Actions, European Union;
Investissements d’ Avenir Labex and Idex, ANR, France; DFG and AvH Foundation,
Ger-many; Herakleitos, Thales and Aristeia programmes co-financed by EU-ESF and the Greek
NSRF, Greece; BSF-NSF and GIF, Israel; CERCA Programme Generalitat de Catalunya,
Spain; The Royal Society and Leverhulme Trust, United Kingdom.
The crucial computing support from all WLCG partners is acknowledged gratefully,
in particular from CERN, the ATLAS Tier-1 facilities at TRIUMF (Canada), NDGF
(Denmark, Norway, Sweden), CC-IN2P3 (France), KIT/GridKA (Germany), INFN-CNAF
(Italy), NL-T1 (Netherlands), PIC (Spain), ASGC (Taiwan), RAL (U.K.) and BNL
(U.S.A.), the Tier-2 facilities worldwide and large non-WLCG resource providers.
Ma-jor contributors of computing resources are listed in ref. [
90
].
Open Access.
This article is distributed under the terms of the Creative Commons
Attribution License (
CC-BY 4.0
), which permits any use, distribution and reproduction in
any medium, provided the original author(s) and source are credited.
References
[1] ATLAS collaboration, Observation of a new particle in the search for the standard model Higgs boson with the ATLAS detector at the LHC,Phys. Lett. B 716 (2012) 1
[arXiv:1207.7214] [INSPIRE].
[2] CMS collaboration, Observation of a new boson at a mass of 125 GeV with the CMS experiment at the LHC,Phys. Lett. B 716 (2012) 30[arXiv:1207.7235] [INSPIRE].
[3] ATLAS collaboration, Measurements of the Higgs boson production and decay rates and coupling strengths using pp collision data at√s = 7 and 8 TeV in the ATLAS experiment, Eur. Phys. J. C 76 (2016) 6[arXiv:1507.04548] [INSPIRE].
JHEP07(2019)117
[4] ATLAS collaboration, Evidence for the spin-0 nature of the Higgs boson using ATLAS data,Phys. Lett. B 726 (2013) 120[arXiv:1307.1432] [INSPIRE].
[5] CMS collaboration, Precise determination of the mass of the Higgs boson and tests of compatibility of its couplings with the standard model predictions using proton collisions at 7 and 8 TeV,Eur. Phys. J. C 75 (2015) 212[arXiv:1412.8662] [INSPIRE].
[6] CMS collaboration, Constraints on the spin-parity and anomalous HVV couplings of the Higgs boson in proton collisions at 7 and 8 TeV,Phys. Rev. D 92 (2015) 012004
[arXiv:1411.3441] [INSPIRE].
[7] ATLAS, CMS collaboration, Measurements of the Higgs boson production and decay rates and constraints on its couplings from a combined ATLAS and CMS analysis of the LHC pp collision data at√s = 7 and 8 TeV, JHEP 08 (2016) 045[arXiv:1606.02266] [INSPIRE].
[8] F. Englert and R. Brout, Broken symmetry and the mass of gauge vector mesons,Phys. Rev. Lett. 13 (1964) 321[INSPIRE].
[9] P.W. Higgs, Broken symmetries, massless particles and gauge fields,Phys. Lett. 12 (1964) 132[INSPIRE].
[10] P.W. Higgs, Broken symmetries and the masses of gauge bosons,Phys. Rev. Lett. 13 (1964) 508[INSPIRE].
[11] P.W. Higgs, Spontaneous symmetry breakdown without massless bosons,Phys. Rev. 145 (1966) 1156[INSPIRE].
[12] G.S. Guralnik, C.R. Hagen and T.W.B. Kibble, Global conservation laws and massless particles,Phys. Rev. Lett. 13 (1964) 585[INSPIRE].
[13] T.W.B. Kibble, Symmetry breaking in non-Abelian gauge theories,Phys. Rev. 155 (1967) 1554[INSPIRE].
[14] A. Djouadi, The anatomy of electro-weak symmetry breaking. II. The Higgs bosons in the minimal supersymmetric model,Phys. Rept. 459 (2008) 1[hep-ph/0503173] [INSPIRE].
[15] G.C. Branco et al., Theory and phenomenology of two-Higgs-doublet models,Phys. Rept. 516 (2012) 1[arXiv:1106.0034] [INSPIRE].
[16] W. Altmannshofer et al., Collider signatures of flavorful Higgs bosons,Phys. Rev. D 94 (2016) 115032[arXiv:1610.02398] [INSPIRE].
[17] ATLAS collaboration, Search for additional heavy neutral Higgs and gauge bosons in the ditau final state produced in 36 fb−1 of pp collisions at √s = 13 TeV with the ATLAS detector,JHEP 01 (2018) 055[arXiv:1709.07242] [INSPIRE].
[18] CMS collaboration, Search for beyond the standard model Higgs bosons decaying into a bb pair in pp collisions at√s = 13 TeV,JHEP 08 (2018) 113[arXiv:1805.12191] [INSPIRE].
[19] J.E. Camargo-Molina, A. Celis and D.A. Faroughy, Anomalies in bottom from new physics in top,Phys. Lett. B 784 (2018) 284[arXiv:1805.04917] [INSPIRE].
[20] ATLAS collaboration, Search for new high-mass phenomena in the dilepton final state using 36 fb−1 of proton-proton collision data at √s = 13 TeV with the ATLAS detector,JHEP 10 (2017) 182[arXiv:1707.02424] [INSPIRE].
[21] ATLAS collaboration, Search for the neutral Higgs bosons of the minimal supersymmetric standard model in pp collisions at√s = 7 TeV with the ATLAS detector, JHEP 02 (2013) 095[arXiv:1211.6956] [INSPIRE].
JHEP07(2019)117
[22] CMS collaboration, Search for neutral MSSM Higgs bosons decaying to µ+µ− in pp collisionsat√s = 7 and 8 TeV,Phys. Lett. B 752 (2016) 221[arXiv:1508.01437] [INSPIRE].
[23] ATLAS collaboration, The ATLAS experiment at the CERN Large Hadron Collider,2008 JINST 3 S08003[INSPIRE].
[24] ATLAS collaboration, ATLAS insertable b-layer technical design report,ATLAS-TDR-19 (2010).
[25] ATLAS collaboration, ATLAS insertable B-layer technical design report addendum, ATLAS-TDR-19-ADD-1(2012).
[26] ATLAS collaboration, Performance of the ATLAS trigger system in 2015,Eur. Phys. J. C 77 (2017) 317[arXiv:1611.09661] [INSPIRE].
[27] P. Nason, A new method for combining NLO QCD with shower Monte Carlo algorithms, JHEP 11 (2004) 040[hep-ph/0409146] [INSPIRE].
[28] S. Frixione, P. Nason and C. Oleari, Matching NLO QCD computations with Parton Shower simulations: the POWHEG method,JHEP 11 (2007) 070[arXiv:0709.2092] [INSPIRE].
[29] S. Alioli, P. Nason, C. Oleari and E. Re, A general framework for implementing NLO calculations in shower Monte Carlo programs: the POWHEG BOX,JHEP 06 (2010) 043 [arXiv:1002.2581] [INSPIRE].
[30] E. Bagnaschi, G. Degrassi, P. Slavich and A. Vicini, Higgs production via gluon fusion in the POWHEG approach in the SM and in the MSSM,JHEP 02 (2012) 088[arXiv:1111.2854] [INSPIRE].
[31] J. Alwall et al., The automated computation of tree-level and next-to-leading order
differential cross sections and their matching to parton shower simulations,JHEP 07 (2014) 079[arXiv:1405.0301] [INSPIRE].
[32] M. Wiesemann et al., Higgs production in association with bottom quarks,JHEP 02 (2015) 132[arXiv:1409.5301] [INSPIRE].
[33] H.-L. Lai et al., New parton distributions for collider physics,Phys. Rev. D 82 (2010) 074024 [arXiv:1007.2241] [INSPIRE].
[34] S. Dulat et al., New parton distribution functions from a global analysis of quantum chromodynamics,Phys. Rev. D 93 (2016) 033006[arXiv:1506.07443] [INSPIRE].
[35] T. Sj¨ostrand et al., An introduction to PYTHIA 8.2,Comput. Phys. Commun. 191 (2015) 159[arXiv:1410.3012] [INSPIRE].
[36] ATLAS collaboration, Measurement of the Z/γ∗ boson transverse momentum distribution in pp collisions at√s = 7 TeV with the ATLAS detector, JHEP 09 (2014) 145
[arXiv:1406.3660] [INSPIRE].
[37] J. Pumplin et al., New generation of parton distributions with uncertainties from global QCD analysis,JHEP 07 (2002) 012[hep-ph/0201195] [INSPIRE].
[38] ATLAS collaboration, ATLAS PYTHIA8 tunes to 7 TeV data,ATL-PHYS-PUB-2014-021 (2014).
[39] R.D. Ball et al., Parton distributions with LHC data, Nucl. Phys. B 867 (2013) 244 [arXiv:1207.1303] [INSPIRE].
[40] D.J. Lange, The EvtGen particle decay simulation package, Nucl. Instrum. Meth. A 462 (2001) 152[INSPIRE].