JHEP03(2018)174
Published for SISSA by SpringerReceived: December 19, 2017 Revised: February 22, 2018 Accepted: March 13, 2018 Published: March 28, 2018
Search for heavy resonances decaying into a W or Z
boson and a Higgs boson in final states with leptons
and b-jets in 36 fb
−1of
√
s = 13 TeV pp collisions
with the ATLAS detector
The ATLAS collaboration
E-mail: atlas.publications@cern.ch
Abstract: A search is conducted for new resonances decaying into a W or Z boson and a 125 GeV Higgs boson in the ν ¯νb¯b, `±νb¯b, and `+`−b¯b final states, where `± = e± or µ±, in pp collisions at √s = 13 TeV. The data used correspond to a total integrated luminosity of 36.1 fb−1 collected with the ATLAS detector at the Large Hadron Collider during the 2015 and 2016 data-taking periods. The search is conducted by examining the reconstructed invariant or transverse mass distributions of W h and Zh candidates for evidence of a localised excess in the mass range of 220 GeV up to 5 TeV. No significant excess is observed and the results are interpreted in terms of constraints on the production cross-section times branching fraction of heavy W0 and Z0 resonances in heavy-vector-triplet models and the CP-odd scalar boson A in two-Higgs-doublet models. Upper limits are placed at the 95% confidence level and range between 9.0 × 10⁻⁴pb and 7.3 × 10⁻¹pb depending on the model and mass of the resonance.
Keywords: Beyond Standard Model, Hadron-Hadron scattering (experiments)
JHEP03(2018)174
Contents1 Introduction 1
2 ATLAS detector 3
3 Data and simulated event samples 4
4 Event reconstruction 6
5 Analysis strategy and event selection 9
6 Background estimation 13
7 Systematic uncertainties 15
8 Results 17
9 Conclusion 28
The ATLAS collaboration 36
1 Introduction
The ATLAS [1] and the CMS [2] collaborations discovered a Higgs boson (h) with a mass near 125 GeV and properties consistent with the Standard Model (SM) predictions [3–5]. Two of the most important questions that remain are how the Higgs boson mass is protected against large radiative corrections (the naturalness problem [6–8]) and whether the Higgs boson is part of an extended scalar sector [9], thus making this particle important for searches for new physics beyond the SM.
Various models with dynamical electroweak symmetry breaking scenarios attempt to solve the naturalness problem by assuming a new strong interaction at a higher energy scale. These models generically predict the existence of new vector resonances that nat-urally decay into a vector boson and a Higgs boson, for example in Minimal Walking Technicolour [10–12], Little Higgs [13], and composite Higgs models [14, 15]. The decays into a vector-boson and Higgs boson final state are frequently enhanced in these models.
Another possible extension of the SM includes the addition of a second Higgs dou-blet [16]. A second Higgs doublet arises in many theories beyond the SM, collectively called two-Higgs-doublet models (2HDMs), such as the minimal supersymmetric SM [17–21], ax-ion models [22], and baryogenesis models [23]. In 2HDMs with a CP-conserving Higgs potential, the scalar sector of the theory consists of five Higgs bosons: two charged (H±), two neutral CP-even (h, H) and one neutral CP-odd (A).
JHEP03(2018)174
This paper describes a search for the production of new heavy vector bosons, denoted hereafter by W0 and Z0, that decay into a W or a Z boson and an h boson and a search for a heavy CP-odd scalar boson A that decays into a Z and an h boson. The analyses described here target leptonic decays of the vector bosons (W± → `±ν, Z → `+`−/ν ¯ν; `± = e±, µ±) and decays of the h boson into a b-quark pair. This results in three search channels: W0 → W±h → `±νb¯b, Z0/A → Zh → `+`−b¯b, and Z0/A → Zh → ν ¯νb¯b.
Resonance searches are typically not sensitive to all free parameters of the underlying theory, thus simplified models [24] can be used to parameterise a broad class of models, wherein only the relevant couplings and mass parameters are retained in the Lagrangian. For the interpretation of the results in the context of models with heavy vector triplets (HVT), a simplified model [25, 26], based on a phenomenological Lagrangian is used as a benchmark. This model incorporates an SU(2)L triplet of heavy vector bosons, which allows the results to be interpreted in a large class of models. The new heavy vector bosons, W0 and Z0, collectively denoted by V0, couple to the Higgs and gauge bosons via a combination of parameters gVcH and to the fermions via the combination (g2/gV) cF, where g is the SU(2)L gauge coupling. The parameter gV represents the strength of the new vector-boson interaction, and cHand cF represent corrections to the coupling strength specific to Higgs bosons and fermions, respectively. Two benchmark models are used in this analysis. In the first model, referred to as Model A, the branching fractions to fermions and gauge bosons are comparable, as in some models with an extended gauge symmetry [27]. For Model B, fermionic couplings are suppressed, as in strong dynamical models such as the minimal composite Higgs model [28]. At low resonance masses and large gVcouplings, the HVT models fail to reproduce the SM parameters, thus this search focuses on high masses, from 500 GeV up to 5 TeV.
The results from the A → Zh search are interpreted as exclusion limits on the ratio of the vacuum expectation values of the two Higgs doublets, tan(β), and on cos(β − α), where α is the mixing angle between the two CP-even Higgs bosons. The exclusion limits are evaluated for the Type I, Type II, Lepton-specific, and Flipped 2HDMs. These differ with respect to which doublets couple to the up-type and down-type quarks as well as to the charged leptons [16]. Both the production via gluon-gluon fusion and the production with associated b-quarks (bbA) are considered in this search. The A → Zh decay mode is mostly relevant below the tt production threshold and the cross-section falls steeply with increasing A boson mass. Therefore, this search starts at the Zh threshold of approximately 220 GeV and goes up to 2 TeV.
Previous searches in the same final states have been performed by the ATLAS and the CMS collaborations using data at √s = 8 TeV and 13 TeV. The ATLAS searches for W0 → W h (Z0 → Zh) exclude, at 95% confidence level (CL), W0 (Z0) resonances with masses below 1.75 (1.49) TeV assuming the HVT benchmark Model A (gV= 1) and below 2.22 (1.58) TeV assuming Model B (gV= 3) [29, 30]. Searches by the CMS Collaboration exclude resonances with masses less than 2.0 TeV at 95% CL assuming the HVT benchmark Model B (gV= 3) [31]. Searches using the fully hadronic final state (W/Zh → qq0b¯b) have also been performed by CMS and ATLAS and exclude W0 (Z0) resonances below 3.15 TeV (2.6 TeV) assuming the HVT benchmark Model B (gV= 3) [32–34]. Previous searches for a CP-odd scalar boson A in the Zh decay mode are reported in refs. [35–39].
JHEP03(2018)174
The search presented in this paper is performed by looking for a localised excess in the distribution of the reconstructed mass of the ν ¯νb¯b, `±νb¯b, and `+`−b¯b systems. The mass range covered by the search, from 220 GeV to 5 TeV, probes a wide range of Higgs boson transverse momenta. Thus, two methods are used to reconstruct Higgs boson candidates. At low transverse momenta, the decay products of the Higgs boson are reconstructed as individual jets. At high transverse momenta, the decay products start to merge and are reconstructed as a single jet. The signal yield and background normalisations are determined from a binned maximum-likelihood fit to the data distribution for each of the V0and A boson models (W0, Z0, gluon-gluon fusion A, bbA) and are used to set upper limits on the production cross-section times decay branching fraction. A combined fit using all three lepton channels sets bounds on the HVT model in the case where the V0 bosons are degenerate in mass.
This paper is structured as follows. Sections2 and3 provide a brief description of the ATLAS experiment and the data and simulated event samples. The event reconstruction and selections are discussed in sections4and5. The background estimation and systematic uncertainties are described in sections6and7. Finally, sections8and9detail the statistical analysis and provide a discussion of the results and concluding remarks.
2 ATLAS detector
The ATLAS detector [40] at the LHC covers nearly the entire solid angle1 around the collision point. It consists of an inner tracking detector (ID) surrounded by a thin super-conducting solenoid, electromagnetic and hadronic calorimeters, and a muon spectrometer incorporating three large superconducting toroid magnets.
The ID is immersed in a 2 T axial magnetic field and provides charged-particle tracking in the range |η| < 2.5. It consists of silicon pixel, silicon microstrip, and transition radiation tracking detectors. Prior to the data-taking at the increased centre-of-mass energy of 13 TeV, the ID was enhanced by adding a new layer of pixel detectors (the IBL [41]) inside the existing pixel detector layers in the barrel region (at a radius of approximately 33 mm). The upgraded detector typically provides four three-dimensional measurements for tracks originating from the luminous region. The silicon microstrip tracker provides four two-dimensional measurement points per track. The transition radiation tracker enables track reconstruction at large radii up to |η| = 2.0 and provides electron identification information based on the number of hits above the threshold for transition radiation.
The calorimeter system covers the pseudorapidity range |η| < 4.9. Within the region |η| < 3.2, electromagnetic calorimetry is provided by barrel and endcap high-granularity lead/liquid-argon (LAr) electromagnetic calorimeters. An additional thin LAr presam-pler, covering |η| < 1.8, is used to correct for energy loss in material upstream of the
1
ATLAS uses a right-handed coordinate system with its origin at the nominal interaction point (IP) in the centre of the detector and the z-axis along the beam pipe. The x-axis points from the IP to the centre of the LHC ring, and the y-axis points upwards. Cylindrical coordinates (r, φ) are used in the transverse plane, φ being the azimuthal angle around the z-axis. The pseudorapidity is defined in terms of the polar angle θ as η = − ln tan(θ/2). Angular distance is measured in units of ∆R ≡p(∆η)2+ (∆φ)2.
JHEP03(2018)174
calorimeters. Hadronic calorimetry is provided by a steel/scintillator-tile calorimeter, seg-mented into three barrel structures within |η| < 1.7, and two copper/LAr hadronic endcap calorimeters. The solid-angle coverage is completed with forward copper/LAr and tung-sten/LAr calorimeter modules optimised for electromagnetic and hadronic measurements, respectively.
The muon spectrometer is composed of separate trigger and high-precision tracking chambers, measuring the deflection of muons in a magnetic field generated by superconduct-ing air-core toroids. The precision chamber system covers the region |η| < 2.7 with three layers of monitored drift tubes, complemented by cathode strip chambers in the forward re-gion, where the particle flux is highest. The muon trigger system covers the range |η| < 2.4 with resistive plate chambers in the barrel, and thin-gap chambers in the endcap regions.
A two-level trigger system is used to select interesting events [42]. The level-1 trigger is implemented in hardware and uses a subset of detector information to reduce the event rate to a design value of at most 100 kHz. This is followed by the software-based trigger level, the high-level trigger, which reduces the event rate further to about 1 kHz.
3 Data and simulated event samples
The data used in this analysis were recorded with the ATLAS detector during the 2015 and 2016 pp-collision runs at √s = 13 TeV and correspond to a total integrated luminosity of 36.1 fb−1. The data are required to satisfy a number of criteria that ensure that the ATLAS detector was in good operating condition. A number of Monte Carlo (MC) simulation samples are used to model the background and signal processes for this search.
For the W0 and Z0 processes, simulated events were generated with MadGraph5
aMC@NLO (MG5 aMC) 2.2.2 [43] at leading-order (LO) accuracy using the NNPDF 2.3
LO parton density function (PDF) set [44]. The parton shower and hadronisation were simulated with Pythia 8.186 [45] using the A14 set [46] of tuned parameters (“tune”) together with the NNPDF 2.3 LO PDF set. Events were generated for a range of resonance masses from 500 to 5000 GeV, assuming a zero natural width. Higgs boson decays into b¯b and c¯c pairs were simulated, with a relative branching fraction B(h → c¯c)/B(h → b¯b) = 0.05 fixed to the SM prediction [47].
Events for the gluon-gluon fusion production of A bosons were generated at LO accu-racy using the same set-up as for the W0and Z0samples. The b-quark associated production of A bosons was simulated with MG5 aMC 2.2.3 using next-to-leading-order (NLO) matrix elements with massive b-quarks and the CT10F4 NLO PDF set [48]. The parton shower and hadronisation were simulated with Pythia 8.210 [49]. Events were generated for a range of A boson masses from 220 to 2000 GeV assuming a zero natural width. For the A boson signals, only decays of the Higgs boson into a b¯b pair were generated.
For the interpretation of the A → Zh search in the context of 2HDMs, the masses of the H± and H bosons are assumed to be equal to the mass of the A boson. The cross-sections were calculated using up to next-to-next-to-leading-order (NNLO) QCD correc-tions for gluon-gluon fusion and b-quark associated production in the five-flavour scheme as implemented in Sushi [50–53]. For the b-quark associated production, a cross-section
JHEP03(2018)174
in the four-flavour scheme was also calculated as described in refs. [54,55] and the results were combined with the five-flavour scheme calculation following ref. [56]. The A boson width and the branching fractions for A → Zh and h → b¯b have been calculated using 2HDMC [57, 58]. The procedure for the calculation of the cross-section and branching fractions as well as the choice of the 2HDM parameters follows ref. [9].
The production of W and Z bosons in association with jets was simulated with Sherpa 2.2.1 [59] using the NNPDF 3.0 NNLO PDF set [60] for both the matrix element calculation and the dedicated parton-shower tuning developed by the Sherpa authors. The event generation utilises Comix [61] and OpenLoops [62], for the matrix element calcu-lation, matched to the Sherpa parton shower using the ME+PS@NLO prescription [63]. The matrix elements were calculated for up to two additional partons at NLO and for three and four partons at LO in QCD. The cross-sections for W /Z+jets were calculated at NNLO accuracy [64].
The tt process was simulated with Powheg-Box v2 [65–67] interfaced to
Pythia 6.428 [68]. The CT10 PDF set [48] was used in the calculation of the matrix ele-ments, while the parton shower used the Perugia 2012 tune [69] with the CTEQ6L1 PDF set [70]. The cross-section was calculated at NNLO accuracy including the resummation of next-to-next-to-leading logarithmic (NNLL) soft gluon terms with Top++2.0 [71–77]. The predicted transverse momentum spectra of top quarks and the tt system were reweighted to the corresponding NNLO parton-level spectra [78].
The production of single top quarks (t-channel, s-channel, and W t) was simulated using the Powheg-Box event generator with the CT10 PDF set. The shower and hadro-nisation was simulated using the same event generator and set-up as for the tt process. The cross-section for the t- and s-channel single-top-quark production was calculated at NLO accuracy using Hathor v2.1 [79,80], while for the W t process an approximate NNLO cal-culation was used [81]. The top mass is set fixed to 172.5 GeV in the tt and single-top-quark samples.
Diboson events (W W , W Z, ZZ) were simulated using the Sherpa 2.1.1 event gen-erator using the CT10 PDFs. Matrix elements were calculated for up to one (ZZ) or no (W W , W Z) additional partons at NLO and up to three additional partons at LO, and the cross-sections were calculated at NLO accuracy.
Finally, the SM processes V h(h → bb), tth, ttW , and ttZ are included in the total background estimation. The q ¯q → Zh and q ¯q → W h processes were simulated at LO with Pythia 8.186 using the NNPDF 2.3 LO PDF set and the A14 tune. The gg → Zh process was simulated at NLO using the Powheg-Box v2 event generator with the CT10 PDF set. The modelling of the shower, hadronisation and underlying event was provided by Pythia 8.186 using the AZNLO tune [82] with the same PDF set as for the matrix element calculation. The cross-sections for the W h and Zh processes were taken from ref. [9]. The tth and ttV samples were generated at NLO accuracy with MG5 aMC 2.3.2 interfaced to Pythia 8.210. The NNPDF 3.0 NLO PDF set was used in the matrix element calculation while for the parton shower the A14 tune was used with the NNPDF 2.3 LO PDF set.
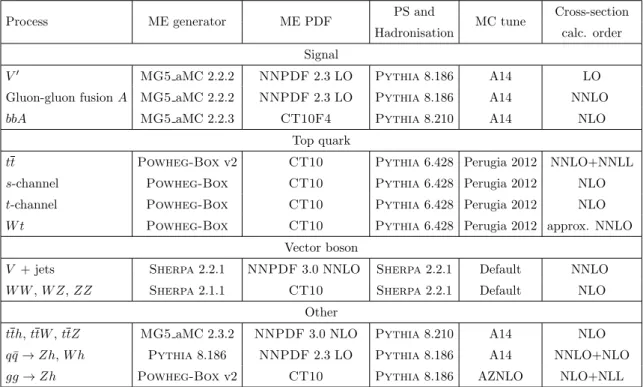
A summary of event generators used for the simulation of signal and background processes is shown in table 1.
JHEP03(2018)174
Process ME generator ME PDF PS and MC tune Cross-section
Hadronisation calc. order
Signal
V0 MG5 aMC 2.2.2 NNPDF 2.3 LO Pythia 8.186 A14 LO
Gluon-gluon fusion A MG5 aMC 2.2.2 NNPDF 2.3 LO Pythia 8.186 A14 NNLO
bbA MG5 aMC 2.2.3 CT10F4 Pythia 8.210 A14 NLO
Top quark
tt Powheg-Box v2 CT10 Pythia 6.428 Perugia 2012 NNLO+NNLL
s-channel Powheg-Box CT10 Pythia 6.428 Perugia 2012 NLO
t-channel Powheg-Box CT10 Pythia 6.428 Perugia 2012 NLO
W t Powheg-Box CT10 Pythia 6.428 Perugia 2012 approx. NNLO
Vector boson
V + jets Sherpa 2.2.1 NNPDF 3.0 NNLO Sherpa 2.2.1 Default NNLO
W W , W Z, ZZ Sherpa 2.1.1 CT10 Sherpa 2.2.1 Default NLO
Other
tth, ttW , ttZ MG5 aMC 2.3.2 NNPDF 3.0 NLO Pythia 8.210 A14 NLO
q ¯q → Zh, W h Pythia 8.186 NNPDF 2.3 LO Pythia 8.186 A14 NNLO+NLO
gg → Zh Powheg-Box v2 CT10 Pythia 8.186 AZNLO NLO+NLL
Table 1. Event generators used for the simulation of the signal and background processes. The acronyms ME and PS are used for matrix element and parton shower, respectively.
All simulated event samples include the effect of multiple pp interactions in the same and neighbouring bunch crossings (pile-up) by overlaying simulated minimum-bias events on each generated signal or background event. The minimum-bias events were simulated with the single-, double- and non-diffractive pp processes of Pythia 8.186 using the A2
tune [83] and the MSTW2008 LO PDF [84]. For all MadGraph and Powheg
sam-ples, the EvtGen v1.2.0 program [85] was used for the bottom and charm hadron decays. The generated samples were processed using the Geant-based ATLAS detector simula-tion [86,87] and the same event reconstruction algorithms were used as for the data.
4 Event reconstruction
This search makes use of the reconstruction of multi-particle vertices, the identification and the kinematic properties of reconstructed electrons, muons, τ leptons, jets, and the determination of missing transverse momentum.
Collision vertices are reconstructed from at least two ID tracks with transverse mo-mentum pT > 400 MeV. The primary vertex is selected as the one with the highestP p2T, calculated considering all associated tracks.
Electrons are reconstructed from ID tracks that are matched to energy clusters in the electromagnetic calorimeter. The clusters are reconstructed using the standard ATLAS sliding-window algorithm, which clusters calorimeter cells within fixed-size η/φ rectan-gles [88]. Electron candidates are required to satisfy requirements for the electromagnetic shower shape, track quality, and track-cluster matching; these requirements are applied
JHEP03(2018)174
using a likelihood-based approach. The “Loose” and “Tight” working points defined in ref. [89] are used.
Muons are identified by matching tracks found in the ID to either full tracks or track segments reconstructed in the muon spectrometer (”combined muons”), or by stand-alone tracks in the muon spectrometer [90]. Muons are required to pass identification require-ments based on quality requirerequire-ments applied to the ID and muon spectrometer tracks. The “Loose” and “Medium” identification working points defined in ref. [90] are used in this analysis. The “Loose” working point includes muons reconstructed with the muon spectrometer alone to extend the acceptance to |η| = 2.7.
Electron and muon candidates are required to have a minimum pT of 7 GeV and to lie within a region where there is good reconstruction and identification efficiency (|η| < 2.7 for muons and |η| < 2.47 for electrons). The “Loose” lepton identification criterion has to be fulfilled and all candidates have to originate from the primary vertex. The last condition is satisfied by requiring that the significance of the transverse impact parameter |d0|/σ(d0) is less than 5.0 for electrons (< 3.0 for muons) and |z0sin(θ)| is less than 0.5 mm, where z0 is the longitudinal impact parameter and θ is the polar angle defined in section 2. The lepton candidates are required to be isolated using requirements on the sum of the pT of the tracks lying in a cone around the lepton direction whose size, ∆R, decreases as a function of the lepton pT [91]. The efficiency of the isolation selection is tuned to be larger than 99% in a sample of Z → `+`− decays [88, 90, 92]. The identification and isolation efficiencies of both the electrons and muons are calibrated using a tag-and-probe method in Z → `+`− data events [88,90].
Two types of calorimeter-based jets, “small-R” and “large-R” jets, are used to re-construct Higgs boson candidates over a wide momentum spectrum. Small-R jets are reconstructed from noise-suppressed topological clusters in the calorimeter [93] using the anti-kt [94] algorithm implemented in the FastJet package [95] with a radius parameter R = 0.4 and are required to have a pT > 20 GeV for |η| < 2.5 (central jets) or pT > 30 GeV for 2.5 < |η| < 4.5 (forward jets). To reduce the number of small-R jets originating from pile-up interactions, these jets are required to pass the jet vertex tagger [96] selection, with an efficiency of about 90%, if they are in the range pT< 60 GeV and |η| < 2.4.
Large-R jets are used to reconstruct Higgs boson candidates with high momenta for which the b-quarks are emitted close to each other. They are constructed using the anti-kt algorithm with a radius parameter of R = 1.0 and are trimmed [97] to remove the energy of clusters that originate from initial-state radiation, pile-up interactions or the underlying event. This is done by reclustering the constituents of the initial jet, using the kt algorithm [98, 99], into smaller Rsub = 0.2 subjets and then removing any subjet that has a pTless than 5% of the pT of the parent jet [100]. The jet mass resolution is improved at high momentum using tracking in addition to calorimeter information [101]. Large-R jets are required to have pT> 250 GeV and |η| < 2.0.
The momenta of both the large-R and small-R jets are corrected for energy losses in passive material and for the non-compensating response of the calorimeter. Small-R jets are also corrected for the average additional energy due to pile-up interactions [102,103].
JHEP03(2018)174
[GeV] jj m 0 20 40 60 80 100 120 140 160 180 Events / 5 GeV 0 5 10 15 20 25 30 ATLAS Simulation =500 GeV A , m b b -l + l → Zh → A 2 jets, 2 b-tags ≥ 2 lep.,Standard Jet Calibration (Std.) =16.4 GeV σ -in-jet µ Std. + =14.1 GeV σ -in-jet + PtReco µ Std. + =13.3 GeV σ [GeV] J m 0 20 40 60 80 100 120 140 160 180 Events / 5 GeV 0 5 10 15 20 25 30 35 40 ATLASSimulation =1500 GeV A , m b b -l + l → Zh → A
2 b-tags, 0 add. b-tags 1 large-R jets
≥
2 lep.,
Standard Jet Calibration (Std.) =13.2 GeV σ -in-jet µ Std. + =11.2 GeV σ
Figure 1. Reconstructed mass of the Higgs boson candidates for the (left) resolved and (right) merged event topologies in a sample of simulated signal events with mA = 500 GeV and
mA= 1500 GeV respectively. The different distributions correspond to the different b-jet energy
corrections applied in each case as described in the text. The distributions are fit to the asymmet-ric function described in ref. [108] and the resolution parameter is shown in the plots.
A third type of jet, built from tracks (hereafter referred to as a track-jet), is used in this analysis for the identification of b-jets from decays of boosted Higgs bosons. The jets are built with the anti-kt algorithm with R = 0.2 from at least two ID tracks with pT > 400 MeV associated with the primary vertex, or with a longitudinal impact parameter |z0sin(θ)| < 3 mm [104]. Track-jets are required to have pT > 10 GeV and |η| < 2.5, and are matched to the large-R jets via ghost-association [105].
Small-R jets and track-jets containing b-hadrons are identified with the multivariate MV2c10 b-tagging algorithm [106, 107], which makes use of information about the jet kinematics, the properties of tracks within jets, and the presence of displaced secondary vertices. The algorithm is used at the 70% efficiency working point and provides a factor of 380 (120) in rejecting small-R jets (track-jets) from gluons and light quarks, and a factor of 12 (7) in rejecting small-R jets (track-jets) from c-quarks. Jets satisfying these requirements are referred to as “b-tagged jets”.
To improve the mass resolution of the Higgs boson candidate, dedicated energy cor-rections are applied for b-tagged small-R and large-R jets to account for the semileptonic decays of the b-hadrons. The momentum of the closest muon in ∆R with pT larger than 5 GeV inside the jet cone is added to the jet momentum after removing the energy deposited by the muon in the calorimeter (the muon-in-jet correction) [104]. For this correction, muons are not required to pass the isolation requirements. For small-R jets only, an addi-tional pT-dependent correction, denoted “PtReco”, is applied to the jet four-momentum to account for biases in the response of b-jets, improving the resolution of the dijet mass. This correction is determined from V h(h → b¯b) simulated events by calculating the ratio of the pT of the true b-jets from the Higgs boson decay to the pT of the reconstructed b-tagged jets after the muon-in-jet correction. The resolution of the dijet mass, mjj (mJ), in this process is improved by 18% (22%) for the resolved (merged) Higgs boson reconstruction after these corrections, as shown in figure1.
JHEP03(2018)174
Hadronically decaying τ -lepton candidates (τhad) are identified using small-R jets with pT > 20 GeV and |η| < 2.5, outside the transition region between the barrel and endcap calorimeters (1.37 < |η| < 1.52). These τhad candidates must have either one or three associated tracks and must satisfy the “Medium” identification criterion [109]. They are used in the ν ¯νb¯b channel to reject backgrounds with real hadronic τ -leptons.
The presence of neutrinos in the ν ¯νbb and `±νbb final states can be inferred from a momentum imbalance in the transverse plane. The missing transverse momentum ( ~ETmiss) is calculated as the negative vectorial sum of the transverse momenta of all the muons, electrons, small-R jets, and ID tracks associated with the primary vertex but not associ-ated with any of those leptons and jets [110,111]. To suppress non-collision and multijet backgrounds in the ν ¯νbb channel, an additional track-based missing transverse momentum estimator, ~pTmiss, is built independently as the negative vectorial sum of the transverse momenta of all tracks from the primary vertex.
An overlap-removal algorithm is applied to prevent double counting of the leptons and jets used for the resonance reconstruction. A τ -lepton is removed if the ∆R between the τ -lepton and an electron or a muon is below 0.2. In the case of a muon, the τ -lepton is not removed if the τ -lepton has pTabove 50 GeV and the reconstructed muon is not a combined muon. If a reconstructed muon and electron share the same ID track then the electron is removed. Small-R jets are removed if they are within a cone of size ∆R = 0.2 around an electron or muon that has passed the isolation requirements. To account for semi-muonic b-jet decays, the jet is only removed if it has fewer than three associated tracks, or if more than 70% of the sum of the pT of its associated tracks comes from the muon and pjT/pµT < 2, where pjT (pµT) is the pT of the jet (muon). Next, electrons and muons within a cone of size ∆R = 0.4 around a surviving small-R jet are discarded if their distance from the jet direction is smaller than ∆R = (0.04 + 10 GeV/p`T). The shrinking cone size ensures a high efficiency for boosted topologies. Small-R jets are also removed if they are within ∆R = 0.2 of the axis of a τhad candidate. Finally, large-R jets within ∆R = 1.2 of any surviving electron are removed.
5 Analysis strategy and event selection
The search for the Z0 and A bosons in the Zh → ννbb and Zh → `+`−bb decay modes uses event samples wherein the number of reconstructed charged leptons is exactly zero or two (0-lepton and 2-lepton channels). For the W0 search in the W h → `±νbb channel, events with exactly zero or one charged lepton are used (0-lepton or 1-lepton channels). The lepton selection requirements described in the previous section are applied, using the “Loose” identification working point. The selections outlined below define regions sensitive to the different models.
For the 0-lepton channel, an ETmisstrigger with a threshold of 70 GeV was used to record the data in 2015 runs; the threshold varied between 90 and 110 GeV in 2016 runs due to the increasing instantaneous luminosity. Events are required to have ETmiss > 150 GeV, where ETmiss is reconstructed with fully calibrated leptons and jets. The efficiency of the trigger selection exceeds 80% above 150 GeV. In the 2-lepton channel, events were recorded using a combination of single-lepton triggers with isolation requirements. In 2015, the lowest pT
JHEP03(2018)174
threshold was 24 GeV; in 2016, it ranged from 24 to 26 GeV. Additional triggers without an isolation requirement are used to recover efficiency for leptons with pT > 60 GeV. In the single-electron channel, the same single-electron triggers as in the 2-lepton channel are applied. In the single-muon channel, the same Emiss
T triggers as in the 0-lepton channel are used because they are more efficient than the single-muon triggers for this analysis. For events selected by the lepton triggers, the lepton that satisfied the trigger is required to match a reconstructed electron (muon) with pT > 27 GeV and |η| < 2.47 (|η| < 2.5).
The wide range of resonance masses probed by this search implies that the resonance decay products can be produced with a wide range of transverse momenta. When the Higgs boson has relatively low pT, the b-quarks from its decay can be reconstructed as two small-R jets. As the momentum of the Higgs boson increases, the two b-quarks become more col-limated and a selection using a single large-R jet becomes more efficient. Two different methods are used for the reconstruction of the Higgs boson candidate: a “resolved” category in which two small-R jets are used to build the Higgs boson candidate, and a “merged” cat-egory where the highest-pT(“leading”) large-R jet is selected as the Higgs boson candidate. For the resolved signal region, two small-R jets are required to have an invariant mass (mjj) in the range 110–140 GeV for the 0- and 1-lepton channels and in the range 100–145 GeV for the 2-lepton channel. The latter selection is relaxed to take advantage of the smaller backgrounds in this channel. This dijet candidate is defined by the two leading b-tagged small-R jets when two or more b-tagged jets are present in the event. In the case where only one b-tagged jet is present, the dijet pair is defined by the b-tagged jet and the leading small-R jet in the remaining set. The leading jet in the pair must have pT > 45 GeV. For the merged signal region, a large-R jet is required with mass (mJ) in the range 75 to 145 GeV and at least one associated b-tagged track-jet.
Events which satisfy the selection requirements of both the resolved and merged cat-egories, are assigned to the resolved one, since its better dijet mass resolution and lower background contamination increases the expected sensitivity. Events failing to satisfy both the resolved and merged signal region requirements are assigned to control regions defined in section6, with priority given to the resolved category. This procedure provides a higher sensitivity for resonances of mass near 1 TeV compared to a procedure in which the merged category is prioritised.
Higgs boson candidates with one or two b-tagged jets define the “1 b-tag” or “2 b-tag” categories, respectively. For the merged selection, only one or two leading track-jets associ-ated with the large-R jet are considered in this counting. For the 0- and 2-lepton channels, resolved events with more than two b-tagged jets or merged events with additional b-tagged track-jets not associated with the large-R jet are used to define signal regions sensitive to bbA production. These are labeled as “3+ b-tag” in the resolved category, and “1 b-tag additional b-tag” or “2 b-tag additional b-tag” in the merged category. In the 2-lepton channel, the latter two are merged and labeled as “1+2 b-tag additional b-tag”.
The calculation of the reconstructed resonance mass depends on the decay channel. In the 0-lepton channel, where it is not possible to reconstruct the Zh system fully due to the presence of two neutrinos from the Z boson decay, the transverse mass defined as
mT,V h = q
(Eh
JHEP03(2018)174
is used as the final discriminant. In order to reconstruct the invariant mass of the W h → `±νbb system in the 1-lepton channel, the momentum of the neutrino in the z-direction, pz, is obtained by imposing a W boson mass constraint on the lepton–ETmiss system. In the resulting quadratic equation, the neutrino pz is taken as the real compo-nent in the case of complex solutions, or as the smaller of the two solutions if both solutions are real. The mass resolution of the V h system is improved in the resolved signal regions of all channels by rescaling the four-momentum of the dijet system by 125 GeV/mjj. In the 2-lepton channel, the four-momentum of the dimuon system is scaled by 91.2 GeV/mµµ as well in all signal regions. This helps to address the worse momentum resolution of high-momentum muons which are measured solely by the tracking detectors.
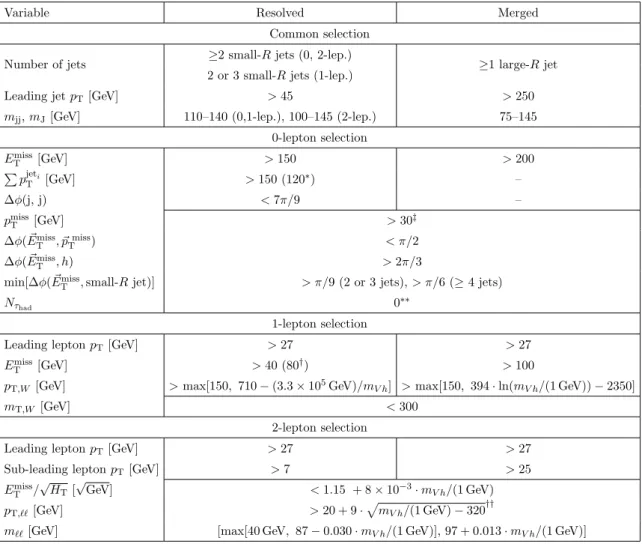
Additional selections are applied for each lepton channel, as outlined below, to reduce the main backgrounds and enhance the signal sensitivity. These selections are summarised in table 2.
For the resolved and merged categories in the 0-lepton channel, the following selections are applied to reduce multijet and non-collision backgrounds to a negligible level:
• pmiss
T > 30 GeV (not applied in the resolved 2 and 3+ b-tag categories); • the azimuthal angle between ~ETmiss and ~pTmiss, ∆φ( ~ETmiss, ~pTmiss) < π/2;
• the azimuthal angle between ~ETmiss and the Higgs boson candidate momentum direc-tion, ∆φ( ~ETmiss, h) > 2π/3;
• the azimuthal angle between ~ETmiss and the nearest small-R jet momentum direction, min[∆φ( ~ETmiss, small-R jet)] > π/9 (for the resolved category with four or more jets, > π/6 is used).
For the resolved category, min[∆φ( ~ETmiss, small-R jet)] is calculated using the small-R jets that constitute the Higgs boson candidate and an additional small-R jet, which is the third leading b-tagged jet (if the event contains at least three b-tagged jets), the leading central jet which is not b-tagged (if the event contains only two b-tagged jets) and the leading forward jet (if the event contains only two central small-R jets). For the merged category, all central and forward small-R jets are used in the min[∆φ( ~ETmiss, small-R jet)] calculation. For the Z0/A search, the tt and W +jets backgrounds are further reduced by rejecting events with at least one identified τhad candidate. This veto is not applied when searching for the W0 boson or in the HVT combined search, because it leads to a loss of signal events in the W h → τ±νb¯b final state.
For the 0-lepton resolved category, two additional selections are applied:
• the scalar sum of the pT of the three leading central small-R jets,P pjetT i, is greater than 150 GeV. In the case where there are only two central small-R jets, the sum of the pT of these two jets and of the leading forward small-R jet, if any, is required to be greater than 120 GeV;
• the azimuthal angle between the two jets used to reconstruct the Higgs boson candi-date, ∆φ(j, j), is required to be less than 7π/9.
JHEP03(2018)174
Variable Resolved Merged
Common selection
Number of jets ≥2 small-R jets (0, 2-lep.) ≥1 large-R jet
2 or 3 small-R jets (1-lep.)
Leading jet pT[GeV] > 45 > 250
mjj, mJ[GeV] 110–140 (0,1-lep.), 100–145 (2-lep.) 75–145
0-lepton selection Emiss T [GeV] > 150 > 200 P pjeti T [GeV] > 150 (120∗) – ∆φ(j, j) < 7π/9 – pmiss T [GeV] > 30‡ ∆φ( ~Emiss T , ~pTmiss) < π/2 ∆φ( ~Emiss T , h) > 2π/3 min[∆φ( ~Emiss
T , small-R jet)] > π/9 (2 or 3 jets), > π/6 (≥ 4 jets)
Nτhad 0
∗∗ 1-lepton selection
Leading lepton pT[GeV] > 27 > 27
Emiss
T [GeV] > 40 (80†) > 100
pT,W [GeV] > max[150, 710 − (3.3 × 10⁵GeV)/mV h] > max[150, 394 · ln(mV h/(1 GeV)) − 2350]
mT,W [GeV] < 300
2-lepton selection
Leading lepton pT[GeV] > 27 > 27
Sub-leading lepton pT[GeV] > 7 > 25
Emiss T / √ HT[ √ GeV] < 1.15 + 8 × 10⁻³· mV h/(1 GeV) pT,``[GeV] > 20 + 9 ·pmV h/(1 GeV) − 320 ††
m``[GeV] [max[40 GeV, 87 − 0.030 · mV h/(1 GeV)], 97 + 0.013 · mV h/(1 GeV)]
Table 2. Topological and kinematic selections for each channel and category as described in the text. (∗)Applies in the case of only two central jets. (∗∗)Tau veto only applied for the Z0/A search.
(†) Tighter threshold (80 GeV) is used for the single-electron channel. (††) Applied only for m Zh ¿
320 GeV. (‡)Not applied in the resolved 2 and 3+ b-tag categories.
Finally, for the merged category, the missing transverse momentum must be larger than 200 GeV.
For the 1-lepton channel, a selection on the transverse momentum of the W boson can-didate (pT,W), which increases as a function of the reconstructed resonance mass, is applied to reduce the contribution of W +jets: pT,W > max[150, 710 − 3.3 × 10⁵GeV/mV h] GeV for the resolved category, while pT,W > max[150, 394 · ln(mV h/(1 GeV)) − 2350] GeV for the merged category. This selection is optimised taking advantage of the larger transverse momentum of W bosons expected to be produced in the decays of high-mass resonances. The tt background is reduced in the resolved category by requiring fewer than four central jets in the event and in the merged category by rejecting events with additional b-tagged track-jets not associated with the large-R jet. For all categories, the transverse mass of the W candidate (mT,W), calculated from the transverse components of the lepton and ETmiss momentum vectors, is required to be less than 300 GeV.
JHEP03(2018)174
In the 1-lepton channel, a significant contribution of multijet events arises mainly from non-prompt leptons from hadron decays and from jets misidentified as electrons. This background is significantly reduced by applying tighter selection requirements on the lepton isolation and identification, as well as on Emiss
T . Muons must satisfy the “Medium”
identification and electrons must satisfy the “Tight” identification requirements. Stringent lepton isolation requirements are applied: the scalar sum of the pT of tracks within a variable-size cone around the lepton (excluding its own track) must be less than 6% of the lepton pT. In addition, in the case of electrons the sum of the transverse energy of the calorimeter energy clusters in a cone of ∆R = 0.2 around the electron must be less than 6% of the electron pT [90,92]. Finally, the ETmiss value is required to be greater than 100 GeV for the merged category and greater than 80 (40) GeV for the resolved category in the electron (muon) channel.
In the 2-lepton channel, same-flavour leptons (ee or µµ) are used. For both the re-solved and merged categories, three kinematic selections are optimised as a function of the resonance mass to reduce the tt and Z+jets backgrounds. Selections on the mass of the dilepton system, max[40 GeV, 87 GeV − 0.030 · mV h] < m`` < 97 GeV + 0.013 · mV h, and on Emiss
T /p(1 GeV) · HT < 1.15 + 8 × 10⁻³ · mV h / (1 GeV) are relaxed for higher-mass resonances to account for resolution effects and smaller backgrounds. The vari-able HT is calculated as the scalar sum of the pT of the leptons and small-R jets in the event. The momentum of the dilepton system (pT,``) is required to be greater than 20 GeV + 9 GeV ·pmV h/(1 GeV) − 320 for mV h greater than 320 GeV. In the resolved dimuon category, an opposite-charge requirement is applied since the probability to mis-reconstruct the charge of individual muons is extremely low. Additionally, in this category the leading muon is required to have |η| less than 2.5. Finally, for the merged category, the sub-leading lepton is required to have pT > 25 GeV and for muons |η| is restricted to be less than 2.5.
6 Background estimation
The background contamination in the signal regions is different for each of the three chan-nels studied. In the 0-lepton channel, the dominant background sources are Z+jets and tt events with a significant contribution from W +jets. In the 1-lepton channel, the largest backgrounds are tt, single-top-quark and W +jets production. In the 2-lepton channel, Z+jets production is the predominant background followed by the tt background. The contribution from diboson, SM V h, tth, and ttV production is small in all three channels. The multijet background, due to semileptonic hadron decays or misidentified jets, is found to be negligible in the 0- and 2-lepton channels after applying the event selections described in section 5. In the 1-lepton channel, the multijet background remains significant only in the resolved 1 b-tag category. All background distribution shapes except those for mul-tijet are estimated from the samples of simulated events with normalisations of the main backgrounds estimated from the data; the multijet shape and normalisation is determined using data.
JHEP03(2018)174
The W/Z+jets simulated event samples are split into different components. In the resolved category, the samples are split according to the true flavour of the two small-R jets forming the Higgs boson candidate. In the merged category, they are split according to the true flavour of the one or two leading track-jets associated with the large-R jet. The true jet flavour is determined by counting true heavy-flavour hadrons with pT > 5 GeV within the cone of the reconstructed jet. If a true b-hadron is found, the jet is labelled as a b-jet, otherwise if a true c-hadron is found the jet is labelled as a c-jet. If neither a true b-hadron nor a true c-hadron is associated with the reconstructed jet, it is labelled as a light jet. For large-R jets with only one track-jet, the true hadrons are counted within this track-jet. Based on this association scheme, the W/Z+jets simulated event samples are split into six components: W/Z+bb, W/Z+bc, W/Z+bl, W/Z+cc, W/Z+cl and W/Z+ll; in this notation l refers to a light jet. In the statistical analysis described in section 8, the components W/Z+bb, W/Z+bc, and W/Z+cc are treated as a single component denoted by W/Z+(bb, bc, cc). The combination of W/Z+bl and W/Z+cl is denoted by W/Z+(bl, cl). For the HVT, Z0, and A boson interpretations, the normalisations of the largest components Z+(bb, bc, cc) and Z+(bl, cl) are determined from data. In the A boson interpretation, the Z+(bb, bc, cc) background normalisation in the 3+ b-tag region is determined from this region independently. The normalisations of W +(bb, bc, cc) and W +(bl, cl) are determined from data for the W0 and HVT interpretations.
The normalisation of the tt background is determined from the fits to data separately for the 0-, 1-, and 2-lepton channels. In the 0-lepton channel, only the signal regions are used in the fit. In the 1- and 2-lepton channels, dedicated control regions enhanced in tt events are used in addition to the signal regions. In the 1-lepton channel, resolved events in the sidebands of the mjjdistribution between 50 GeV and 200 GeV (excluding the signal region with 110 < mjj< 140 GeV) are primarily composed of tt and W +jets events. These control regions are included in the fit for the 1 and 2 b-tag categories. In the 2-lepton channel, a tt control region is defined using resolved events with different-flavour (eµ), oppositely charged leptons, and without the ETmiss/√HT requirement. The tt purity of this selection is greater than 90%. This region combining the 1 and 2 b-tag events is used in the A, Z0, and HVT interpretations; for the A interpretation, a control region with eµ events and 3+ b-tags is also included in the fit to provide an independent constraint on tt production with associated heavy-flavour jets.
The shape of the multijet background in the 1-lepton channel is estimated from a sample of data events orthogonal to the signal regions, the anti-isolated lepton region. In the muon channel, this region is defined by events where the sum of the transverse mo-mentum of tracks in a cone of ∆R = 0.2 around the muon is between 6% and 15% of the muon pT. In the electron channel, this region is defined by events where the sum of the calorimeter energy deposits in a cone of ∆R = 0.2 around the electron is larger than 6% of the electron pT; this region is defined after applying the track isolation requirement described in section4. A template shape for the multijet background is extracted from the anti-isolated lepton region after removing the contribution from the simulated electroweak and top-quark backgrounds. In this subtraction, the normalisation of the simulated elec-troweak and top-quark backgrounds is estimated by fitting them to data in the region
JHEP03(2018)174
ETmiss > 200 GeV where the contribution from multijet events is negligible. In the signal and control regions used in the statistical analysis, the multijet normalisation is determined by fitting the ETmiss multijet template and the ETmiss combined template of the electroweak and top-quark backgrounds to data in the 1 and 2 b-tag categories separately. Using this method, the multijet contribution is estimated to be less than 6% in all signal and control regions and is included in the statistical analysis.
7 Systematic uncertainties
Two types of systematic uncertainties, experimental and modelling, affect the reconstruc-tion of the mV hand mT,V hobservables. Experimental uncertainties arise due to the trigger selection, the reconstruction, identification, energy/momentum, mass, and resolution for the leptons, jets and missing transverse momentum. Modelling uncertainties result in shape and normalisation uncertainties of the different MC samples used to model the signal and backgrounds. These stem from uncertainties in the matrix element calculation, the choice of parton shower and hadronisation models and their free parameters, the PDF set and the choice of renormalisation and factorisation scales.
The largest experimental systematic uncertainties are associated with the calibration and resolution of the small-R and large-R jet energy, the calibration and resolution of the large-R jet mass, and the determination of the jet b-tagging efficiency and misidentifica-tion rate. The uncertainties in the small-R jet energy scale have contribumisidentifica-tions from in situ calibration studies, from the dependency on the pile-up activity and on the flavour composition of jets [103, 112]. The small-R jet uncertainties are propagated to the Emiss
T measurement. The uncertainty in the scale and resolution of large-R jet energy and mass is estimated by comparing the ratio of calorimeter-based to track-based measurements in dijet data and simulation [100,101]. The flavour tagging efficiency and its uncertainty for b-jets and c-jets is estimated in t¯t and W + c-jet events, respectively, while the light-jet misidentification rate and uncertainty is determined using dijet events [106,107,113,114]. Other experimental systematic uncertainties with a smaller impact are those in the lepton energy and momentum scales, in lepton reconstruction and identification efficiency, and in the efficiency of the triggers. Finally, a global normalisation uncertainty of 3.2% is as-signed due to the luminosity measurement from a preliminary calibration of the luminosity scale using x–y beam-separation scans performed in August 2015 and May 2016, following a methodology similar to that detailed in ref. [115]. Experimental uncertainties have an impact on the shape of the mass distributions and account for possible migration of events across the different regions.
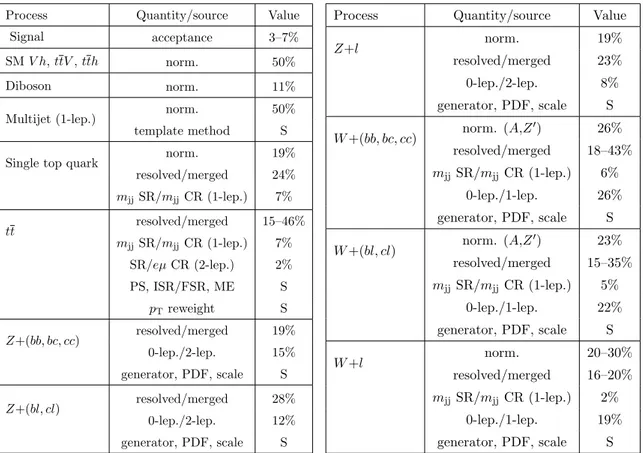
Modelling uncertainties are assigned to each signal and background process and lead to variations in the normalisation and in the case of main backgrounds also in the shape of the templates in the different regions. In addition, for all MC samples, the statistical uncertainty arising from the number of simulated events is considered by introducing shape variations determined from the uncertainty in each bin of the mV hor mT,V h distributions. The modelling uncertainties considered are shown in table 3and described below.
JHEP03(2018)174
Process Quantity/source Value
Signal acceptance 3–7%
SM V h, ttV , tth norm. 50%
Diboson norm. 11%
Multijet (1-lep.) norm. 50%
template method S
Single top quark norm. 19%
resolved/merged 24% mjjSR/mjjCR (1-lep.) 7% tt resolved/merged 15–46% mjjSR/mjjCR (1-lep.) 7% SR/eµ CR (2-lep.) 2% PS, ISR/FSR, ME S pTreweight S Z+(bb, bc, cc) resolved/merged 19% 0-lep./2-lep. 15% generator, PDF, scale S Z+(bl, cl) resolved/merged 28% 0-lep./2-lep. 12% generator, PDF, scale S
Process Quantity/source Value
Z+l norm. 19% resolved/merged 23% 0-lep./2-lep. 8% generator, PDF, scale S W +(bb, bc, cc) norm. (A,Z 0) 26% resolved/merged 18–43% mjjSR/mjjCR (1-lep.) 6% 0-lep./1-lep. 26% generator, PDF, scale S W +(bl, cl) norm. (A,Z 0) 23% resolved/merged 15–35% mjjSR/mjjCR (1-lep.) 5% 0-lep./1-lep. 22% generator, PDF, scale S W +l norm. 20–30% resolved/merged 16–20% mjjSR/mjjCR (1-lep.) 2% 0-lep./1-lep. 19% generator, PDF, scale S
Table 3. Relative systematic uncertainties in the normalisation, cross-region extrapolation, and shape of the signal and background processes included in the fits described in the text. An “S” indicates a shape variation is included for the sources listed, “/” indicates a ratio of two regions, and “norm.” is the sum of cross-section and acceptance variations. A range of values means the value depends on the lepton channel. Parentheses indicate when the uncertainty applies only to a given fit or a given region.
For the signal processes, the uncertainties in the acceptance were derived by considering the following variations: the renormalisation and factorisation scales were varied by a factor of two, the nominal PDF set was replaced by the MSTW2008 LO PDF set and the tuned parameters were varied according to the variations derived from the eigentune method [46]. For both the A and V0 signals, the total variations are less than 3% at resonance masses above 500 GeV. The variations increase to 7% for the A boson masses below 500 GeV.
The modelling uncertainties affecting tt and single-top-quark processes are derived as follows [116]. A variation of the parton shower, hadronisation, and the underlying-event model is obtained by replacing Pythia 6.428 by Herwig++ (version 2.7.1) [117] with the UE-EE-5 tune and the CTEQ6L1 PDF set [70]. To assess potential differences in the matrix element calculation, a comparison is made to a sample where Powheg is replaced by MG5 aMC [43]. A comparison is also made to samples with smaller and larger amount of initial- and final-state radiation (ISR/FSR) by changing the renormalisation and factorisation scales by a factor of two and switching to the corresponding low- and high-radiation Perugia 2012 tunes. Finally, the difference between the nominal and corrected
JHEP03(2018)174
distributions due to the top-quark and tt pT reweighting described in section3 is included as a symmetrised shape uncertainty.
Similarly, for W/Z+jets backgrounds, the following comparisons have been performed. The PDF set in the nominal samples was replaced by the alternative PDF sets: the hundred NNPDF 3.0 NNLO replicas, including the sets resulting from variations of αS [60], the
MMHT2014 NNLO set, and the CT14 NNLO PDF set [118]. The scale uncertainties are
estimated by comparing samples where the renormalisation and factorisation scales were modified by a factor of two. Finally, a comparison was made to a sample generated using MG5 aMC v2.2.2 interfaced to Pythia 8.186 and using the A14 tune together with the NNPDF 2.3 LO PDF set [43,49,119].
For the tt, single-top-quark, and W/Z+jets backgrounds, the acceptance differences that affect the relative normalisation across regions with a common background normali-sation are estimated by summing in quadrature the relative yield variations between the different regions. These uncertainties are assigned to all regions used in the fit as shown in table 4 and across the different lepton channels as shown in table3.
For the multijet background included in the 1-lepton channel, a 50% uncertainty in the normalisation is estimated from the fit to the ETmiss distribution described in section6. Also, a shape variation is included to account for uncertainties in the determination of the template in the anti-isolated lepton region, arising from differences in the trigger scheme between isolated and anti-isolated regions and uncertainties in the normalisation of the top-quark and electroweak backgrounds in this region.
Finally, for the remaining small backgrounds only a normalisation uncertainty is as-signed. For the diboson backgrounds a normalisation uncertainty of 11% is applied [120]. For the SM V h, ttV , and tth production, a 50% uncertainty is assigned which covers the uncertainty in the cross-sections.
8 Results
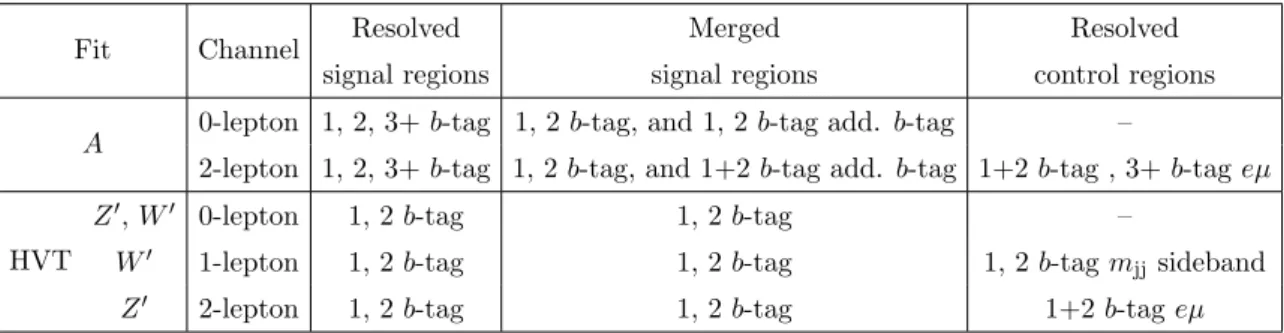
In order to test for the presence of a massive resonance, the mT,V h and mV h templates obtained from the signal and background simulated event samples are fit to data using a binned maximum-likelihood approach based on the RooStats framework [121–123]. A total of five different fits are performed according to the signal interpretation: Z0, W0, HVT, A in gluon-gluon fusion, and A in b-quark associated production. The list of channels and regions used for the different fits is shown in table 4.
The fits are performed on the mT,V h distribution in the 0-lepton channel and the mV h distribution in the 1- and 2-lepton channels using a binning of the distributions chosen to optimise the search sensitivity while minimising statistical fluctuations. As described in section 6, the normalisations of the tt, Z+(bb, bc, cc), and Z+(bl, cl) backgrounds are free parameters in all fits, as are the normalisations of W +(bb, bc, cc) and W +(bl, cl) in the W0 and HVT fits. The systematic uncertainties described in section 7 are incorporated in the fit as nuisance parameters with correlations across regions and processes taken into account. The signal normalisation is a free parameter in the fit. In order to account for migrations of signal events across different channels due to lepton reconstruction and
JHEP03(2018)174
Fit Channel Resolved Merged Resolved
signal regions signal regions control regions A 0-lepton 1, 2, 3+ b-tag 1, 2 b-tag, and 1, 2 b-tag add. b-tag –
2-lepton 1, 2, 3+ b-tag 1, 2 b-tag, and 1+2 b-tag add. b-tag 1+2 b-tag , 3+ b-tag eµ
HVT
Z0, W0 0-lepton 1, 2 b-tag 1, 2 b-tag –
W0 1-lepton 1, 2 b-tag 1, 2 b-tag 1, 2 b-tag mjjsideband
Z0 2-lepton 1, 2 b-tag 1, 2 b-tag 1+2 b-tag eµ
Table 4. A list of the signal and control regions (separated by commas below) included in the statistical analysis of the A and HVT model hypotheses. The notation 1+2 b-tag indicates the 1 and 2 b-tag regions are combined, and add. b-tag indicates the regions with additional b-tags not associated with the large-R jet.
selection inefficiencies, the Zh → `+`−bb (W h → `±νbb) signal samples are included in the 1(0)-lepton categories.
The total uncertainty in the signal yield is dominated by different sources of systematic uncertainty depending on the mass of the resonance used in the fit. The uncertainties in the W/Z+(bb, bc, cc) shape and normalisation, tt normalisation, and in the flavour tagging efficiencies constitute the dominant sources of systematic uncertainty for low-mass reso-nances. For all interpretations, the statistical uncertainty dominates for resonances above 1 TeV. The uncertainties in the large-R jet mass resolution and in the track-jet b-tagging efficiency constitute the dominant systematic uncertainties at high masses.
The expected and observed event yields after the HVT fit are shown in table 5. The mT,V h and mV hdistributions after the HVT fit are shown in figures2and3. Similar distri-butions are obtained from the W0, Z0 and A fits with background yields consistent within the uncertainties. The mass distributions for the resolved 3+ b-tag category and the merged categories with additional b-tagged jets, used in the A boson fits, are shown in figure4.
As no significant excess over the background prediction is observed, upper limits at the 95% CL are set on the production cross-section times the branching fraction for each model. The limits are evaluated using a modified frequentist method known as CLs [124] and the profile-likelihood-ratio test statistic [125] using the asymptotic approximation.
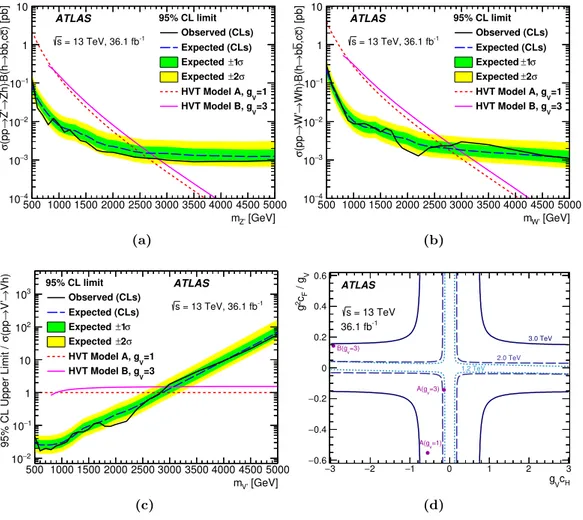
The 95% CL upper limits on the production cross-section multiplied by the branching fraction for W0→ W h and Z0→ Zh and the sum of branching fractions B(h → bb)+B(h → cc), which is fixed to 60.6% [47], are shown in figure 5(a) and figure 5(b) as a function of the resonance mass. The existence of W0 and Z0 bosons with masses mW0 < 2.67 TeV and
mZ0 < 2.65 TeV, respectively, are excluded for the HVT benchmark Model A with coupling
constant gV= 1 [25]. For Model B with coupling constant gV = 3 [25], the corresponding excluded masses are mW0 < 2.82 TeV and mZ0 < 2.83 TeV.
To study the scenario in which the masses of charged and neutral resonances are degenerate, a likelihood fit over all the signal regions and control regions is performed. The 95% CL upper limit on the combined signal strength for the processes W0 → W h and Z0 → Zh, assuming mW0 = mZ0, relative to the HVT model predictions, is shown in
JHEP03(2018)174
The exclusion contours in the HVT parameter space {gVcH, (g2/gV)cF} for resonances of mass 1.2 TeV, 2.0 TeV and 3.0 TeV are shown in figure5(d) where all three lepton channels are combined, taking into account the branching fractions to W h and Zh from the HVT model prediction. Here, the parameter cFis assumed to be the same for quarks and leptons, including third-generation fermions, and other parameters involving more than one heavy vector boson, gVcVVV, gV2cVVhh and cVVW, are assumed to have negligible contributions to the overall cross-sections for the processes of interest.
Figures 6(a) and 6(b) show the 95% CL upper limits on the production cross-section of the A boson times its branching fraction to Zh and the branching fraction of h → bb as a function of the resonance mass. Upper limits are placed separately for a signal arising from pure gluon-gluon fusion production (figure 6(a)) and from pure b-quark associated production (figure6(b)). In the search for the A boson with b-quark associated production, a mild excess of events is observed around 440 GeV, mainly driven by the dimuon channel in the resolved category with 3+ b-tags. The local significance of this excess with respect to the background-only hypothesis is estimated to be 3.6 σ, and the global significance, accounting for the look-elsewhere effect [126] is estimated to be 2.4 σ.
The data are also interpreted in terms of limits at 95% CL on the 2HDM parameters tan(β) and cos(β − α). The admixture of gluon-gluon fusion and b-quark associated pro-duction, and the variation of the A and h boson widths and branching fractions are taken into account according to the predictions of the different models. In this interpretation, the mT,V h and mV h distributions of the simulated signal events are smeared according to a Breit-Wigner function with a width predicted by the parameters of the model. This pro-cedure has been verified to produce the same line-shape as the one including non-resonant and interference effects for widths ΓA/mA< 10%.
Figure 7 shows the excluded parameter space for a resonance mass of mA= 300 GeV in four 2HDM types: I, II, Lepton-Specific, and Flipped. Greater sensitivity is observed at high tan(β) for the Type-II and Flipped models, due to an increased cross-section for b-quark associated production. The narrow regions with no exclusion power in Type-I and Type-II at low tan(β) that are far from cos(β − α) = 0 are caused by the vanishing branching fraction of h → bb.
Figure 8 shows the parameter exclusion for the four models in the tan(β)–mA plane for cos(β − α) = 0.1. For the interpretation in Type-II and Flipped 2HDMs, the b-quark associated production is included in addition to the gluon-gluon fusion production. The shape of the expected exclusions is determined by the interplay of the expected cross-section limit, which decreases as a function of mA, and the signal production cross-section times the A → Zh branching fraction at a given mA and tan(β). This branching fraction decreases significantly at mA = 350 GeV due to the opening of the A → t¯t channel, but increases again at higher mA, maintaining similar sensitivity into this mA region. The variable tan(β) controls the admixture of the gluon-gluon fusion and b-quark associated production thereby affecting the rate at which the signal cross-section falls as a function of mA, which leads to a varying sensitivity as a function of tan(β). The excesses or deficits in the data visible in figure 6are also reflected in figure 8.
JHEP03(2018)174
0-lepton Resolved Merged
1 b-tag 2 b-tag 3+ b-tag 1 b-tag 2 b-tag 1 b-tag 2 b-tag
add. b-tag add. b-tag
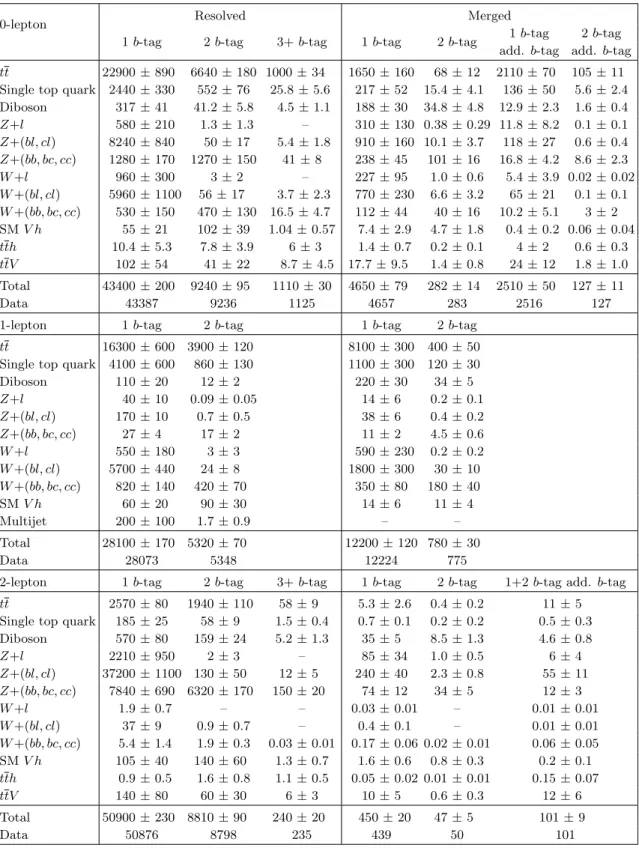
tt 22900 ± 890 6640 ± 180 1000 ± 34 1650 ± 160 68 ± 12 2110 ± 70 105 ± 11
Single top quark 2440 ± 330 552 ± 76 25.8 ± 5.6 217 ± 52 15.4 ± 4.1 136 ± 50 5.6 ± 2.4
Diboson 317 ± 41 41.2 ± 5.8 4.5 ± 1.1 188 ± 30 34.8 ± 4.8 12.9 ± 2.3 1.6 ± 0.4 Z+l 580 ± 210 1.3 ± 1.3 – 310 ± 130 0.38 ± 0.29 11.8 ± 8.2 0.1 ± 0.1 Z+(bl, cl) 8240 ± 840 50 ± 17 5.4 ± 1.8 910 ± 160 10.1 ± 3.7 118 ± 27 0.6 ± 0.4 Z+(bb, bc, cc) 1280 ± 170 1270 ± 150 41 ± 8 238 ± 45 101 ± 16 16.8 ± 4.2 8.6 ± 2.3 W +l 960 ± 300 3 ± 2 – 227 ± 95 1.0 ± 0.6 5.4 ± 3.9 0.02 ± 0.02 W +(bl, cl) 5960 ± 1100 56 ± 17 3.7 ± 2.3 770 ± 230 6.6 ± 3.2 65 ± 21 0.1 ± 0.1 W +(bb, bc, cc) 530 ± 150 470 ± 130 16.5 ± 4.7 112 ± 44 40 ± 16 10.2 ± 5.1 3 ± 2 SM V h 55 ± 21 102 ± 39 1.04 ± 0.57 7.4 ± 2.9 4.7 ± 1.8 0.4 ± 0.2 0.06 ± 0.04 tth 10.4 ± 5.3 7.8 ± 3.9 6 ± 3 1.4 ± 0.7 0.2 ± 0.1 4 ± 2 0.6 ± 0.3 ttV 102 ± 54 41 ± 22 8.7 ± 4.5 17.7 ± 9.5 1.4 ± 0.8 24 ± 12 1.8 ± 1.0 Total 43400 ± 200 9240 ± 95 1110 ± 30 4650 ± 79 282 ± 14 2510 ± 50 127 ± 11 Data 43387 9236 1125 4657 283 2516 127
1-lepton 1 b-tag 2 b-tag 1 b-tag 2 b-tag
tt 16300 ± 600 3900 ± 120 8100 ± 300 400 ± 50
Single top quark 4100 ± 600 860 ± 130 1100 ± 300 120 ± 30
Diboson 110 ± 20 12 ± 2 220 ± 30 34 ± 5 Z+l 40 ± 10 0.09 ± 0.05 14 ± 6 0.2 ± 0.1 Z+(bl, cl) 170 ± 10 0.7 ± 0.5 38 ± 6 0.4 ± 0.2 Z+(bb, bc, cc) 27 ± 4 17 ± 2 11 ± 2 4.5 ± 0.6 W +l 550 ± 180 3 ± 3 590 ± 230 0.2 ± 0.2 W +(bl, cl) 5700 ± 440 24 ± 8 1800 ± 300 30 ± 10 W +(bb, bc, cc) 820 ± 140 420 ± 70 350 ± 80 180 ± 40 SM V h 60 ± 20 90 ± 30 14 ± 6 11 ± 4 Multijet 200 ± 100 1.7 ± 0.9 – – Total 28100 ± 170 5320 ± 70 12200 ± 120 780 ± 30 Data 28073 5348 12224 775
2-lepton 1 b-tag 2 b-tag 3+ b-tag 1 b-tag 2 b-tag 1+2 b-tag add. b-tag
tt 2570 ± 80 1940 ± 110 58 ± 9 5.3 ± 2.6 0.4 ± 0.2 11 ± 5
Single top quark 185 ± 25 58 ± 9 1.5 ± 0.4 0.7 ± 0.1 0.2 ± 0.2 0.5 ± 0.3
Diboson 570 ± 80 159 ± 24 5.2 ± 1.3 35 ± 5 8.5 ± 1.3 4.6 ± 0.8 Z+l 2210 ± 950 2 ± 3 – 85 ± 34 1.0 ± 0.5 6 ± 4 Z+(bl, cl) 37200 ± 1100 130 ± 50 12 ± 5 240 ± 40 2.3 ± 0.8 55 ± 11 Z+(bb, bc, cc) 7840 ± 690 6320 ± 170 150 ± 20 74 ± 12 34 ± 5 12 ± 3 W +l 1.9 ± 0.7 – – 0.03 ± 0.01 – 0.01 ± 0.01 W +(bl, cl) 37 ± 9 0.9 ± 0.7 – 0.4 ± 0.1 – 0.01 ± 0.01 W +(bb, bc, cc) 5.4 ± 1.4 1.9 ± 0.3 0.03 ± 0.01 0.17 ± 0.06 0.02 ± 0.01 0.06 ± 0.05 SM V h 105 ± 40 140 ± 60 1.3 ± 0.7 1.6 ± 0.6 0.8 ± 0.3 0.2 ± 0.1 tth 0.9 ± 0.5 1.6 ± 0.8 1.1 ± 0.5 0.05 ± 0.02 0.01 ± 0.01 0.15 ± 0.07 ttV 140 ± 80 60 ± 30 6 ± 3 10 ± 5 0.6 ± 0.3 12 ± 6 Total 50900 ± 230 8810 ± 90 240 ± 20 450 ± 20 47 ± 5 101 ± 9 Data 50876 8798 235 439 50 101
Table 5. The predicted and observed event yields in the signal regions defined in the text. The yields in the 1 and 2 b-tag regions correspond to the HVT fit for a signal of mass 1.5 TeV. In the 3+ b-tag and 1 and 2 b-tag with additional b-tags regions, the yields are from the fit using the A boson produced in association with b-quarks as signal with a mass of 1.5 TeV. The quoted uncertainties are the statistical and systematic uncertainties combined in quadrature after the fit. The uncertainties in the individual background predictions are larger than the total background
JHEP03(2018)174
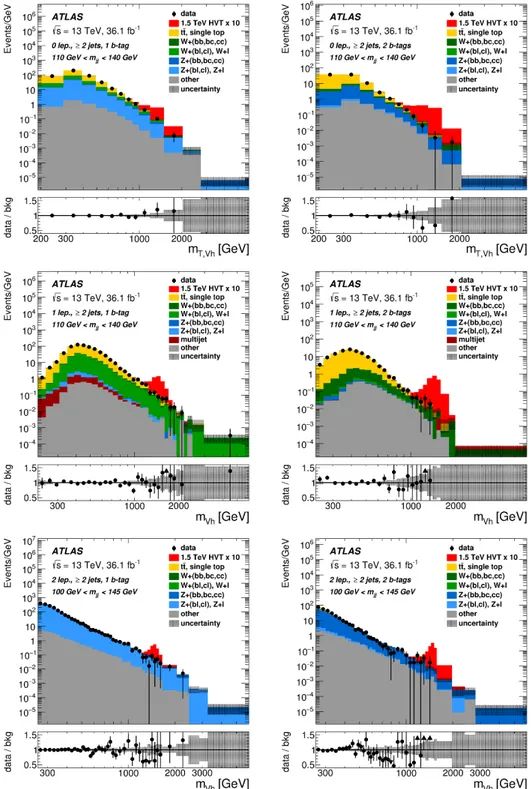
Figure 2. Event distributions of mT,V h for the 0-lepton channel, and mV h for the 1-lepton and
2-lepton channels in the resolved categories. The quantity on the vertical axis is the number of data events divided by the bin width in GeV. The background prediction is shown after a background-only maximum-likelihood fit to the data. The signal for the benchmark HVT Model A with mV0 =
1.5 TeV is normalised to 10 times the theoretical cross-section. The background uncertainty band shown includes both the statistical and systematic uncertainties after the fit added in quadrature. The lower panels show the ratio of the observed data to the estimated SM background.
JHEP03(2018)174
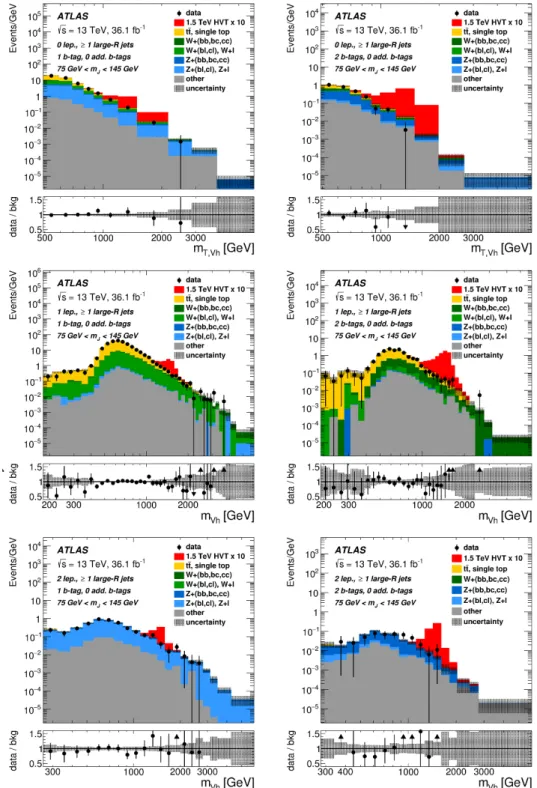
Figure 3. Event distributions of mT,V h for the 0-lepton channel, and mV h for the 1-lepton
and 2-lepton channels in the merged categories. The quantity on the vertical axis is the num-ber of data events divided by the bin width in GeV. The background prediction is shown after a background-only maximum-likelihood fit to the data. The signal for the benchmark HVT Model A with mV0 = 1.5 TeV is normalised to 10 times the theoretical cross-section. The background
uncer-tainty band shown includes both the statistical and systematic uncertainties after the fit added in quadrature. The lower panels show the ratio of the observed data to the estimated SM background.
JHEP03(2018)174
Figure 4. Event distributions of mT,V hfor the 0-lepton channel and mV hfor the 2-lepton channel
after a background-only fit to the categories used in the search for the A boson produced in associa-tion with b-quarks. The quantity on the vertical axis is the number of data events divided by the bin width in GeV. The distribution for an A boson with mass of 500 GeV (1.5 TeV) is shown for illustra-tion in the resolved (merged) regions normalised using a cross-secillustra-tion of 5 pb. The background un-certainty band shown includes both the statistical and systematic uncertainties after the fit added in quadrature. The lower panels show the ratio of the observed data to the estimated SM background.
JHEP03(2018)174
[GeV] Z’ m 500 1000 1500 2000 2500 3000 3500 4000 4500 5000 ) [pb] c ,c b b → B(h⋅ Zh) → Z’ → (pp σ 4 − 10 3 − 10 2 − 10 1 − 10 1 10 ATLAS -1 = 13 TeV, 36.1 fb s 95% CL limit Observed (CLs) Expected (CLs) σ 1 ± Expected σ 2 ± Expected =1 V HVT Model A, g =3 V HVT Model B, g (a) [GeV] W’ m 500 1000 1500 2000 2500 3000 3500 4000 4500 5000 ) [pb] c ,c b b → B(h⋅ Wh) → W’ → (pp σ 4 − 10 3 − 10 2 − 10 1 − 10 1 10 ATLAS -1 = 13 TeV, 36.1 fb s 95% CL limit Observed (CLs) Expected (CLs) σ 1 ± Expected σ 2 ± Expected =1 V HVT Model A, g =3 V HVT Model B, g (b) [GeV] V’ m 500 1000 1500 2000 2500 3000 3500 4000 4500 5000 Vh) → V’ → (pp σ 95% CL Upper Limit / 2 − 10 1 − 10 1 10 2 10 3 10 ATLAS -1 = 13 TeV, 36.1 fb s 95% CL limit Observed (CLs) Expected (CLs) σ 1 ± Expected σ 2 ± Expected =1 V HVT Model A, g =3 V HVT Model B, g (c) H c V g 3 − −2 −1 0 1 2 3 V / gF c 2 g 0.6 − 0.4 − 0.2 − 0 0.2 0.4 0.6 ATLAS = 13 TeV s -1 36.1 fb 1.2 TeV 2.0 TeV 3.0 TeV =1) v A(g =3) v A(g =3) v B(g (d)Figure 5. Upper limits as a function of the resonance mass at the 95% CL for (a) the production cross-section of Z0 times its branching fraction to Zh and the branching fraction B(h → b¯b, c¯c) and (b) the production cross-section of W0times its branching fraction to W h and the branching fraction B(h → b¯b, c¯c). (c) Upper limits at the 95% CL for the scaling factor of the production cross-section for V0 times its branching fraction to W h/Zh in Model A. The production cross-sections predicted by Model A and Model B are shown for comparison in (a)–(c). (d) Observed 95% CL exclusion contours in the HVT parameter space {gVcH, (g2/gV)cF} for resonances of mass 1.2 TeV, 2.0 TeV
and 3.0 TeV. The areas outside the curves are excluded. Also shown are the benchmark model parameters A(gV= 1), A(gV= 3) and B(gV= 3).
JHEP03(2018)174
[GeV] A m 200 400 600 800 1000 1200 1400 1600 1800 2000 ) [pb] b b → B(h⋅ Zh) → A → (pp σ 3 − 10 2 − 10 1 − 10 1 10 Observed (CLs) Expected (CLs) σ 1 ± Expected σ 2 ± Expected b b → Zh , h → A gluon-gluon fusion ATLAS -1 = 13 TeV, 36.1 fb s 95% CL limit(a) Pure gluon-gluon fusion production
[GeV] A m 200 400 600 800 1000 1200 1400 1600 1800 2000 ) [pb] b b → B(h⋅ Zh) → A b b → (pp σ 3 − 10 2 − 10 1 − 10 1 10 Observed (CLs) Expected (CLs) σ 1 ± Expected σ 2 ± Expected b b → Zh , h → A A b b ATLAS -1 = 13 TeV, 36.1 fb s 95% CL limit
(b) Pure b-quark associated production
Figure 6. Upper limits at the 95% CL on the product of the production cross-section for pp → A and the branching fractions for A → Zh and h → bb evaluated by combining the 0-lepton and 2-lepton channels. The possible signal components of the data are interpreted assuming (a) pure gluon-gluon fusion production, and (b) pure b-quark associated production.
JHEP03(2018)174
(a) 2HDM Type-I (b) 2HDM Type-II
(c) 2HDM Lepton-specific (d) 2HDM Flipped
Figure 7. The interpretation of the cross-section limits in the context of the various 2HDM types as a function of the parameters tan(β) and cos(β − α) for mA= 300 GeV: (a) Type-I , (b) Type-II,
(c) Lepton-specific, and (d) Flipped. Variations of the natural width up to ΓA/mA= 10% have been
taken into account. For the interpretation in Type-II and Flipped 2HDM, the b-quark associated production is included in addition to the gluon-gluon fusion production.
JHEP03(2018)174
(a) 2HDM Type-I (b) 2HDM Type-II
(c) 2HDM Lepton-specific (d) 2HDM Flipped
Figure 8. The interpretation of the cross-section limits in the context of 2HDMs of Type (a) I, (b) II, (c) Lepton-specific, and (d) Flipped, as a function of the parameters tan(β) and mA for
cos(β − α) = 0.1. Variations of the natural width up to ΓA/mA = 10% have been taken into