JHEP05(2018)077
Published for SISSA by SpringerReceived: November 10, 2017 Revised: February 14, 2018 Accepted: April 30, 2018 Published: May 11, 2018
Measurement of differential cross sections and
W
+
/W
−
cross-section ratios for W boson production
in association with jets at
√
s = 8 TeV with the
ATLAS detector
The ATLAS collaboration
E-mail:
atlas.publications@cern.ch
Abstract: This paper presents a measurement of the W boson production cross section
and the W
+/W
−cross-section ratio, both in association with jets, in proton-proton
col-lisions at
√
s = 8 TeV with the ATLAS experiment at the Large Hadron Collider. The
measurement is performed in final states containing one electron and missing transverse
momentum using data corresponding to an integrated luminosity of 20.2 fb
−1.
Differen-tial cross sections for events with at least one or two jets are presented for a range of
observables, including jet transverse momenta and rapidities, the scalar sum of transverse
momenta of the visible particles and the missing transverse momentum in the event, and
the transverse momentum of the W boson. For a subset of the observables, the differential
cross sections of positively and negatively charged W bosons are measured separately. In
the cross-section ratio of W
+/W
−the dominant systematic uncertainties cancel out,
im-proving the measurement precision by up to a factor of nine. The observables and ratios
selected for this paper provide valuable input for the up quark, down quark, and gluon
parton distribution functions of the proton.
Keywords: Hadron-Hadron scattering (experiments)
ArXiv ePrint:
1711.03296
JHEP05(2018)077
Contents
1
Introduction
2
2
ATLAS detector
3
3
Simulated event samples
4
4
Data selection and event analysis
5
4.1
Electron reconstruction and identification
5
4.2
Jet selection
6
4.3
Event selection
7
4.4
Background estimation
7
5
Correction for detector effects
9
6
Systematic uncertainties
11
7
Theoretical predictions
15
7.1
NNLO predictions
15
7.2
NLO predictions
15
7.3
LO predictions
17
7.4
Non-perturbative corrections
17
8
Cross-section results
18
8.1
Jet multiplicity distribution
18
8.2
Distributions for N
jets≥ 1
18
8.3
Distributions for N
jets≥ 2
22
9
Conclusion
25
A Additional cross-section distributions
27
A.1 Jet multiplicity and distributions for events with N
jets≥ 2
27
A.2 Pseudorapidity of the electron
27
A.3 W
+and W
−cross sections
27
JHEP05(2018)077
1
Introduction
With the large samples of proton-proton collision data available from the Large Hadron
Collider (LHC), the measurement of the production of a W boson in association with jets
allows precise tests of perturbative quantum chromodynamics (pQCD). In recent years,
numerous theoretical advances have been made including calculations for up to five
ad-ditional jets at next-to-leading-order (NLO) [
1
–
3
] and calculations for one additional jet
at next-to-next-to-leading-order (NNLO) [
4
,
5
], as well as merging approaches for NLO
predictions of different jet multiplicities [
6
–
8
] and new parton shower approaches [
9
,
10
].
The theoretical predictions have undergone rigorous scrutiny using data from the ATLAS,
CMS and LHCb experiments [
11
–
16
] with proton-proton collisions at the LHC and from
the CDF and DØ experiments with proton-antiproton collisions at the Tevatron [
17
–
20
].
These results comprise a wide range of measurements of differential cross sections of
ob-servables, which are reconstructed from jets and leptonic decay products of the W boson.
Detailed measurements of specific processes such as electroweak W boson production [
21
],
small-angle emission of a W boson radiating from an energetic jet [
22
] and production in
association with heavy-flavour quarks [
23
–
28
] complement these results. All of the studies
mentioned here focus on jet production over a range of energy scales and attempt to probe
pQCD to the statistical limits of the available data.
Using data corresponding to an integrated luminosity of 20.2 fb
−1at
√
s = 8 TeV, this
paper presents the results for W + jets production in final states containing one electron
and missing transverse momentum, focusing on events with one or two additional jets.
The data are measured for W production as well as for W
+and W
−production and the
cross-section ratio of W
+/W
−as a function of the number of jets (N
jets). For events with
at least one jet, the differential cross sections are shown as a function of the scalar sum
of the transverse momenta of electron, neutrino and jets (H
T), the transverse momentum
(p
T) of the W boson, and the p
Tand rapidity of the most energetic jet (leading jet). These
observables are sensitive to higher-order terms in the prediction as well as the parton
distribution functions (PDFs). For events with at least two jets, the differential cross
sections are shown for W boson production and include distributions as a function of
the p
Tand rapidity of the second leading jet, the dijet angular separation, and the dijet
invariant mass. These observables are sensitive to hard parton radiation at large angles
and different matrix-element/parton-shower matching schemes.
The results for W + jets production presented here are a useful test of jet production
with energetic jets as well as jets with large rapidities. As in a previous ATLAS
mea-surement using data at
√
s = 7 TeV [
11
], the systematic uncertainties are larger than the
statistical uncertainty of the data. The new measurements are based on an independent
dataset, at a higher centre-of-mass energy and with larger integrated luminosity. The
anal-ysis has improved event selections to reduce backgrounds from top quark production —
an important improvement since the increase in cross section with centre-of-mass energy
is greater for top quark production than for W boson production. Several new sets of
pre-dictions and new measurements of the p
Tof the W boson in addition to other observables
JHEP05(2018)077
In the ratio of W
+to W
−production, many of the experimental and theoretical
uncertainties cancel out, making it a more precise test of the theoretical predictions. In
addition, differential cross section measurements of W
+and W
−production and their
ratio are sensitive to the PDFs for up and down quarks. The measurement of separate
W
+and W
−cross sections as well as the W
+/W
−cross section ratio is new compared to
the previous ATLAS measurement using data at 7 TeV [
11
]. In previous measurements of
W production for inclusive jet multiplicities [
29
], the W
+and W
−asymmetry probes the
momentum fraction of the parton, x, in the range of 10
−3. x . 10
−1. For events with
at least one jet, a charge ratio measurement is sensitive to higher values of x, potentially
accessing x ∼ 0.1–0.3 [
30
].
The valence quark PDFs in this range are currently best
constrained from fixed-target deep-inelastic scattering (DIS) experiments and the Tevatron
W
±asymmetry measurements (see the discussion in ref. [
31
]). The DIS measurements
include effects from the nuclear target that require model-dependent corrections to obtain
nucleon PDFs and the Tevatron results show tension between the different experiments as
well as with the DIS results. It is therefore interesting to include new data, such as the
measurement of the W boson cross sections and W
+and W
−cross-section ratios presented
here, in PDF fits to improve the precision of valence quark and gluon PDFs at high x.
2
ATLAS detector
The ATLAS experiment [
32
] at the LHC is a multi-purpose particle detector with a
forward-backward symmetric cylindrical geometry and a near 4π coverage in solid angle.
1It consists
of an inner tracking detector surrounded by a thin superconducting solenoid, providing a
2 T axial magnetic field, electromagnetic and hadronic calorimeters, and a muon
spectrom-eter. The inner detector covers the pseudorapidity range |η| < 2.5. It consists of silicon
pixel, silicon microstrip, and transition radiation tracking detectors. Lead/liquid-argon
(LAr) sampling calorimeters provide electromagnetic (EM) energy measurements with high
granularity. A hadron (steel/scintillator-tile) calorimeter covers the central pseudorapidity
range (|η| < 1.7). The endcap and forward regions are instrumented with LAr
calorime-ters for EM and hadronic energy measurements up to |η| = 4.9. The muon spectrometer
surrounds the calorimeters and includes a system of precision tracking chambers and fast
detectors for triggering. Three large air-core toroidal superconducting magnets, each with
eight coils, provide the magnetic field for the muon system. In 2012, a three-level trigger
system was used to select events. The first-level trigger was implemented in hardware and
used a subset of the detector information to reduce the accepted event rate to at most
75 kHz. This was followed by two software-based trigger levels that together reduced the
accepted event rate to 400 Hz on average depending on the data-taking conditions.
1
ATLAS uses a right-handed coordinate system with its origin at the nominal interaction point (IP) in the centre of the detector and the z-axis along the beam pipe. The x-axis points from the IP to the centre of the LHC ring, and the y-axis points upwards. Cylindrical coordinates (r, φ) are used in the transverse plane, φ being the azimuthal angle around the z-axis. The pseudorapidity is defined in terms of the polar angle θ as η = − ln tan(θ/2). The rapidity, y, is defined as 1
2ln[(E + pz)/(E − pz)], where E denotes the
energy of the jet and pz the momentum component of the jet along the beam direction. Angular distance
JHEP05(2018)077
3
Simulated event samples
Simulated event samples are used for most of the background estimates, for the correction
of the signal yield for detector effects and in comparison to the measured cross sections. The
ATLAS detector simulation [
33
] is performed using GEANT4 [
34
] and the simulated events
are reconstructed and analysed using the same analysis chains as for data. Additional
predictions that are only compared to the final measurements are described in section
7
.
Samples of W → eν and Z → ee events with associated jets were generated with
Alpgen v2.14 [
35
] and with Sherpa v1.4.1 [
36
,
37
]. The Alpgen event generator was
also used to simulate W → τ ν and Z → τ τ production. For the Alpgen samples, events
were produced with up to five additional partons in the final state from the matrix element.
Pythia v6.426 [
38
] was used for the parton showering, hadronisation and underlying event,
based on the Perugia 2011C set of tuned parameters (tune) [
39
], where the parton shower
uses a dipole shower with a p
T-ordered evolution variable. For electromagnetic final-state
radiation and the decay of τ -leptons, Photos [
40
] and Tauola [
41
] were used, respectively.
Double counting of parton emissions between the Alpgen matrix element and the Pythia
parton shower calculations was removed through the MLM matching scheme [
35
]. The
proton structure is described by the CTEQ6L1 PDF set [
42
].
The Alpgen samples
include a matrix element calculation of W boson production in association with massive
heavy-flavour partons, W + c, W + c¯
c and W + b¯
b in addition to the light-flavour jet
production. Overlap between heavy-flavour quarks originating from the matrix element
and those originating from the parton shower was removed. For the Sherpa samples,
events were produced with up to four additional partons in the final state from the matrix
element and include a model of the parton shower, the hadronisation and the underlying
event. The ME+PS@LO prescription [
43
] is used to combine different parton multiplicities
from the matrix element and the parton shower. The Sherpa event generator uses the
CKKW matching scheme [
44
] and its own model of electromagnetic final-state radiation
based on the Yennie-Frautschi-Suura method [
45
]. Massive c- and b-quarks are also included
and the PDF set used is CT10 [
46
].
The Alpgen+Pythia 6 samples for W + jets production provide the best description
of data and are used as the main signal prediction throughout this measurement. The
Sherpa samples supply an alternative prediction and are used to estimate some of the
systematic uncertainties.
Top quark pair production (t¯
t) was simulated with the Powheg-Box r2129 [
47
] event
generator (referred to here as Powheg) interfaced to Pythia v6.426 using the Perugia
2011C tune and the CT10 PDF set. The h
dampparameter, which effectively regulates
high-p
Temission in Powheg was set to the top quark mass of 172.5 GeV. Single top quark
production in the s-, t- and W t- channels was modelled by Powheg and showered with
Pythia v6.426 (v6.427 for the t-channel) using the Perugia 2011C tune. The PDF set is
CT10 (with a fixed 4-flavour scheme for t-channel production). Diboson processes (W W ,
W Z and ZZ) were simulated using Herwig v6.520.2 [
48
] with the AUET2 tune [
49
] and
the CTEQ6L1 PDF set.
All simulated samples are normalised using their respective inclusive cross sections at
higher orders in pQCD. The W and Z predictions are scaled to the NNLO calculation
JHEP05(2018)077
obtained with Dynnlo v1.5 [
50
,
51
] and the MSTW2008 PDF set [
52
] (requiring m
``>
60 GeV in case of Z production). The production of top quarks is normalised using the
prediction at NNLO+NNLL precision from the Top++2.0 program for t¯
t [
53
–
59
], to the
calculations in refs. [
60
–
62
] for single top quarks, and for diboson production to the NLO
calculations in ref. [
63
].
The simulated events were overlaid with additional proton-proton interactions
(pile-up) in the same and neighbouring crossings of proton bunches. These were generated with
Pythia v8.160 [
64
] with the average number of interactions per bunch crossing matched
to that measured in data. To achieve better agreement with data, the efficiencies for the
electron triggering, reconstruction, identification, and isolation, as well as the efficiencies
for the tagging or mis-tagging of heavy- and light-flavour jets, and the simulated vertex
position were corrected in the simulated events.
4
Data selection and event analysis
The data used in this analysis were recorded during the 2012 proton-proton collision run
at a centre-of-mass energy of 8 TeV. Crossings of proton bunches occurred every 50 ns and
the collisions achieved a peak instantaneous luminosity of 7.7 × 10
33cm
−2s
−1. The mean
number of simultaneous inelastic proton-proton interactions was hµi = 20.7. After the
application of data-quality requirements, the total integrated luminosity is 20.2 fb
−1with
an uncertainty of 1.9% [
65
].
Events are selected for analysis by requiring that they satisfy a set of single-electron
trigger criteria for an isolated electron with a transverse momentum above 24 GeV or an
electron with transverse momentum greater than 60 GeV. Within this trigger algorithm
the isolation momentum is defined as the sum of the transverse momenta of reconstructed
charged-particle tracks with p
T> 1 GeV in a cone of size ∆R < 0.2 around the electron
(excluding the track of the electron). An electron trigger candidate is considered to be
isolated if the isolation momentum is less than 10% of the electron’s transverse
momen-tum. The threshold of the lower-p
Ttrigger is sufficiently low to ensure that electrons
reconstructed with p
T> 25 GeV by the offline algorithms are selected with close to their
maximum efficiency of about 96% for central electrons. The higher-p
Ttrigger compensates
for inefficiencies due to the isolation criteria applied.
Events must have at least one reconstructed vertex with at least three associated tracks,
each with a p
Tgreater than 400 MeV. The vertex with the largest
P p
2Tof associated tracks
is considered to be the primary vertex.
4.1
Electron reconstruction and identification
Electrons are reconstructed from energy clusters in the EM calorimeter that are matched to
a track reconstructed in the inner detector. The electron is required to have p
T> 25 GeV
and |η| < 2.47 (excluding the transition region between barrel and endcap calorimeters of
1.37 < |η| < 1.52) and match the online electron, which passed the trigger criteria. Each
electron must satisfy a set of identification criteria in order to suppress misidentification
JHEP05(2018)077
of photons or jets. Electrons must pass the tight selection, following the definition
pro-vided in ref. [
66
]. This includes requirements on the shower shape in the electromagnetic
calorimeter, the leakage of the shower into the hadronic calorimeter, the number of hits
measured along the track in the inner detector, the amount of transition radiation in the
transition radiation tracker, and the quality of cluster-track matching as well as criteria
to ensure that the reconstructed electron does not originate from a converted photon. A
gaussian sum filter track refitting algorithm is used to improve the estimated electron track
parameters. The electron is required to originate from the primary vertex by using the
following criteria related to the electron track. The transverse impact parameter, d
0, must
be smaller than five times its uncertainty (|d
0|/σ
d0< 5) and |z
0· sin θ| must be less than
0.5 mm, where z
0is the longitudinal impact parameter and θ is the polar angle of the
electron with respect to the beam direction.
In order to further suppress background from misidentified objects such as jets, the
electron is required to be isolated using tracking-based and calorimeter-based criteria. The
sum of the transverse momenta of tracks with p
T> 400 MeV, excluding the electron track,
in a radius of ∆R = 0.3 around the electron must be smaller than 7% of the electron’s
p
T. Furthermore, the sum of transverse energies of topological clusters [
67
] lying within
a radius of ∆R < 0.3 around the electron centre and excluding the core area, must be
smaller than 14% of the electron’s p
T. The calorimeter-based isolation is corrected for two
effects: soft energy deposits in the isolation cone due to pile-up, using an ambient energy
density approach [
68
], and for high-energy electrons, the energy leakage of the electron’s
energy from the core into the surrounding isolation cone.
4.2
Jet selection
Jets are reconstructed using the anti-k
talgorithm [
69
,
70
] with a radius parameter R = 0.4
and topological clusters of energy depositions in the calorimeter as input. The
topolog-ical clusters are calibrated with the local cluster weighting method [
71
] to account for
the hadronic and electromagnetic activity inside the clusters. Jets are then calibrated to
the hadronic jet energy scale (JES), by applying p
T- and η-dependent factors that are
determined from a combination of simulated events and in situ methods [
72
–
74
]. These
factors include corrections for inactive material in the detector, out-of-cone effects, pile-up
contributions estimated using a jet-area-based approach [
75
], as well as a global
sequen-tial correction [
76
]. The latter corrects for differences between quark- and gluon-initiated
jets and the punch-through of a jet into the muon system. Events with jets arising from
detector noise or non-collision effects [
77
] are rejected.
Jets are required to have p
T> 30 GeV and a rapidity of |y| < 4.4. Jets from additional
proton-proton interactions are suppressed by requiring that more than 50% of the total
summed scalar p
Tof the tracks associated with the jet must originate from tracks that are
associated with the primary vertex [
78
]. This requirement is applied to jets that are within
the acceptance of the tracking detectors, |η| < 2.4, and have a p
Tlower than 50 GeV. Less
than 5% of non-pile-up jets are misidentified by this criterion. To avoid double counting
with the selected electron, jets within ∆R = 0.2 of the electron are removed.
JHEP05(2018)077
Jets containing b-hadrons are identified using a neural-network-based algorithm
(MV1) [
79
], which exploits information from the track impact parameters, secondary
ver-tex location and decay topology. The operating point used for this analysis corresponds
to an overall 60% efficiency for heavy-flavour jets in t¯
t events and a less than 2% mis-tag
rate for light-flavour jets in dijet events. The b-tagged jets must have p
T> 20 GeV and
|η| < 2.5.
4.3
Event selection
Events must contain one electron satisfying the selection criteria specified above. If the
event contains a second electron that satisfies the medium identification criteria and has
p
T> 20 GeV and |η| < 2.47 (excluding 1.37 < |η| < 1.52), the event is rejected. This
reduces the contribution from Z boson production. To remove events where a jet is near
the electron, the selected electron must be separated from any jet by ∆R > 0.4, otherwise
the event is not considered. To suppress the background from t¯
t events, events with at
least one b-tagged jet are also rejected. The application of a b-tagged jet veto reduces the
t¯
t background for events with three or more associated jets by more than a factor of about
two compared to the previous ATLAS measurement [
11
].
Events are required to have a missing transverse momentum (E
missT
) and a transverse
mass (m
T) consistent with the decay of a W boson.
The missing transverse
momen-tum [
80
] is calculated as the negative vector sum of the transverse momenta of calibrated
electrons, photons [
81
], hadronically decaying τ -leptons [
82
], jets and muons [
83
], as well
as additional low-momentum tracks which are associated with the primary vertex but
are not associated with any other E
missTcomponent. The transverse mass is defined as
m
T=
p2p
eTp
νT(1 − cos (φ
e− φ
ν)), where p
νTand φ
νof the neutrino correspond to that
from the vector of the missing transverse energy (E
Tmiss). Events in this analysis must have
E
Tmiss> 25 GeV and m
T> 40 GeV. The set of selection criteria defines the signal region
for this measurement.
The transverse momentum of the W boson is defined as the absolute value of the
vectorial sum of the transverse momentum component of the selected electron and E
missT.
The measurement of W
+and W
−production is performed by selecting events according
to the charge of the electron.
4.4
Background estimation
The major backgrounds to W boson production with decays into the electron plus neutrino
final state are W → τ ν, Z → ee, Z → τ τ , t¯
t (mainly t¯
t → b¯
bq ¯
q
0eν), single-top-quark,
diboson (W W , W Z, ZZ), and multijet events. Most of these background events contain
an isolated, energetic electron in the final state. In the case of W → τ ν and Z → τ τ ,
an electron can be present in the final state via τ → ν
τν
¯
ee. For the multijet background,
an electron can be identified in the final state via three main modes: a light-flavour jet is
misidentified as an electron, a bottom- or charm-hadron within a jet decays into an electron
or an electron from a photon conversion passes the selection. In all cases, the event must
also contain E
Tmissfrom either a mismeasurement of the deposited energy or from neutrinos
in heavy-flavour decays.
JHEP05(2018)077
Njets 0 1 2 3 4 5 6 7 W → eν 94 % 86 % 75 % 67 % 57 % 47 % 40 % 35 % Multijet 3 % 8 % 15 % 16 % 16 % 16 % 14 % 14 % t¯t < 1 % < 1 % 1 % 6 % 16 % 27 % 36 % 43 % Single t < 1 % < 1 % 1 % 1 % 2 % 2 % 2 % 1 % W → τ ν 2 % 2 % 2 % 2 % 2 % 1 % 1 % 1 % Diboson < 1 % < 1 % 1 % 1 % 1 % 1 % < 1 % < 1 % Z → ee < 1 % 3 % 5 % 6 % 6 % 6 % 5 % 5 % Z → τ τ < 1 % < 1 % < 1 % < 1 % < 1 % < 1 % < 1 % < 1 % Total predicted 54 310 000 7 611 700 2 038 000 478 640 120 190 30 450 7430 1735 ±22 000 ±4000 ±1700 ±720 ±320 ±150 ±63 ±20 Data observed 56 342 232 7 735 501 2 070 776 486 158 120 943 29 901 7204 1641Table 1. Signal and background contributions in the signal region for different jet multiplicities as percentages of the total number of predicted events, as well as the total numbers of predicted and observed events. The uncertainty in the total predicted number of events is statistical only.
For events with less than four jets, the largest background is multijet events, whereas
for five jets and above, t¯
t events dominate. An overview of the background contributions
is given in table
1
. For events with one (two) jets, the multijet background constitutes 8%
(15%) of the total number of events and all other backgrounds are less than 6% (10%).
The use of tracks in the E
Tmisscalculation to estimate the low-momentum contributions,
instead of using soft energy deposits in the calorimeter, substantially suppresses the multijet
background, in particular for one-jet events. At high jet multiplicities, the number of
W + jets events is less than the sum of all backgrounds, and for seven or more jets, the
t¯
t background alone is larger than the signal. However, compared to previous ATLAS
W + jets publications, which did not include a veto on b-tagged jets, the t¯
t background is
reduced from more than 60% of events with five jets to less than 30%.
All backgrounds with the exception of the multijet background are estimated using
simulations and are normalised to the integrated luminosity of the data using the cross
sections as detailed in section
3
. For the t¯
t simulation, an additional normalisation factor
of 1.086 is applied to account for an observed difference in the overall normalisation with
respect to the data; this offset is also observed in other t¯
t measurements [
84
].
The modeling of t¯
t production in the simulation is cross-checked using a t¯
t-enriched
data sample, which is selected by requiring events with four or more jets, at least one
b-tagged jet, and all other signal region selection criteria, and has a purity for t¯
t events of
greater than 90%. The background contributions are estimated using the same procedure
as in the signal region. For the kinematic observables studied here, the t¯
t simulation agrees
well with the data. The additional normalisation factor applied to the t¯
t simulation was
determined with this data sample.
For the multijet background, a data-driven method is used to determine both the total
number of events in the signal region and the shape of the background for each differential
distribution. The number of multijet background events is estimated by fitting, for each jet
JHEP05(2018)077
multiplicity, the E
Tmissdistribution in the data (without the E
Tmissrequirement, but all other
signal region requirements applied) to a sum of two templates: one for the multijet
back-ground and another which includes the signal and all other backback-grounds. The normalisation
of both templates is allowed to vary freely. The shape of the multijet template is obtained
from data, while the second template is obtained from simulation. The multijet-enriched
data sample used to extract the multijet template is acquired using a dedicated electron
trigger, an inverted electron identification criterion, and an inverted isolation criterion. The
electron trigger is equivalent to the one used for the signal region, but does not contain
an isolation requirement. The inverted identification requires that the electron passes the
medium criteria but fails the tight criteria, and the inverted isolation that the sum of the p
Tof tracks in a cone of ∆R = 0.3 around the electron, excluding the electron track, is larger
than 7% of the electron’s p
T. To increase the number of events in the multijet-enriched
sample the electron impact parameter criteria are not applied. The multijet-enriched data
sample is statistically independent from the signal region and any contribution from the
signal or other backgrounds to this sample is subtracted using simulation.
The E
Tmissfit is performed in the range of 15 GeV to 75 GeV for each jet multiplicity
and separately for the W , W
+and W
−production selections. The fit results are used
to determine the number of multijet events in the signal region for each selection. For
events with six or more jets (five or more jets for the W
−event selection) where the
statistical uncertainties in the multijet template are large, the multijet contribution is
extracted from a fit of the E
missTdistribution with these multiplicities combined.
For
the differential distributions, the shape of the multijet contribution is determined from
the multijet-enriched data sample and scaled to the total number of multijet events as
extracted from the fit.
In figure
1
, the data are compared to the signal and background predictions as a
function of the exclusive jet multiplicity, the H
T, and the transverse momentum and the
rapidity of the leading jet. The data, in general, agree with the predictions within the
experimental uncertainties.
5
Correction for detector effects
The yield of W + jets events is determined by subtracting the estimated background
contri-butions from the event counts in data. Using simulated samples, the districontri-butions are then
corrected for detector effects to the fiducial phase space that is defined in table
2
. Here, the
electron definition is based on final-state electrons from the W boson decay and includes
the contributions from photons, which are radiated within a ∆R = 0.1 cone around the
electron direction (dressed electron). The E
Tmissis determined from the transverse
mo-mentum of the neutrino from the W boson decay and is also used in the calculation of
m
T. Particle-level jets are obtained using an anti-k
talgorithm with a radius parameter of
R = 0.4. The jets are clustered using final-state particles (except muons and neutrinos)
with a decay length of cτ > 10 mm as input and the dressed electron is excluded as a jet.
The jets are required to have p
T> 30 GeV and |y| < 4.4. If a jet is within ∆R = 0.4 from
JHEP05(2018)077
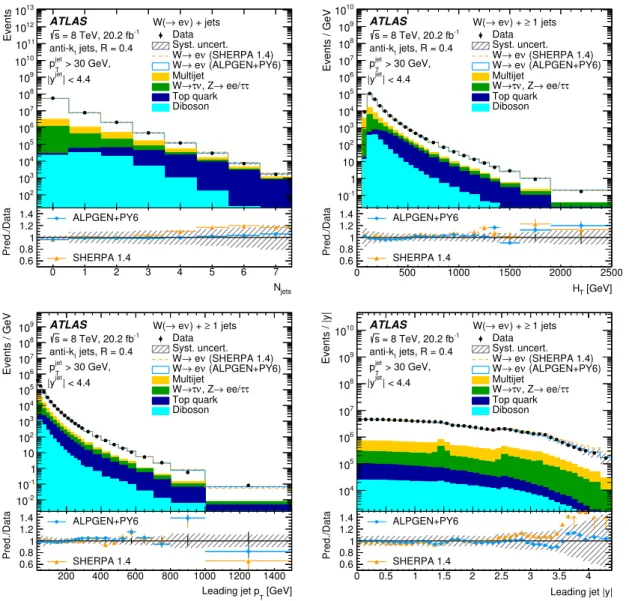
Events 2 10 3 10 4 10 5 10 6 10 7 10 8 10 9 10 10 10 11 10 12 10 13 10 Data Syst. uncert. (SHERPA 1.4) ν e → W (ALPGEN+PY6) ν e → W Multijet τ τ ee/ → , Z ν τ → W Top quark Diboson ATLAS -1 = 8 TeV, 20.2 fb s jets, R = 0.4 t anti-k > 30 GeV, jet T p | < 4.4 jet |y ) + jets ν e → W( jets N 0 1 2 3 4 5 6 7 Pred./Data 0.6 0.8 1 1.2 1.4 ALPGEN+PY6 SHERPA 1.4 0 500 1000 1500 2000 2500 Events / GeV -1 10 1 10 2 10 3 10 4 10 5 10 6 10 7 10 8 10 9 10 10 10 Data Syst. uncert. (SHERPA 1.4) ν e → W (ALPGEN+PY6) ν e → W Multijet τ τ ee/ → , Z ν τ → W Top quark Diboson ATLAS -1 = 8 TeV, 20.2 fb s jets, R = 0.4 t anti-k > 30 GeV, jet T p | < 4.4 jet |y 1 jets ≥ ) + ν e → W( [GeV] T H 0 500 1000 1500 2000 2500 Pred./Data 0.6 0.8 1 1.2 1.4 ALPGEN+PY6 SHERPA 1.4 200 400 600 800 1000 1200 1400 Events / GeV -2 10 -1 10 1 10 2 10 3 10 4 10 5 10 6 10 7 10 8 10 9 10 Data Syst. uncert. (SHERPA 1.4) ν e → W (ALPGEN+PY6) ν e → W Multijet τ τ ee/ → , Z ν τ → W Top quark Diboson ATLAS -1 = 8 TeV, 20.2 fb s jets, R = 0.4 t anti-k > 30 GeV, jet T p | < 4.4 jet |y 1 jets ≥ ) + ν e → W( [GeV] T Leading jet p 200 400 600 800 1000 1200 1400 Pred./Data 0.6 0.8 1 1.2 1.4 ALPGEN+PY6 SHERPA 1.4 0 0.5 1 1.5 2 2.5 3 3.5 4 Events / |y| 4 10 5 10 6 10 7 10 8 10 9 10 10 10 Data Syst. uncert. (SHERPA 1.4) ν e → W (ALPGEN+PY6) ν e → W Multijet τ τ ee/ → , Z ν τ → W Top quark Diboson ATLAS -1 = 8 TeV, 20.2 fb s jets, R = 0.4 t anti-k > 30 GeV, jet T p | < 4.4 jet |y 1 jets ≥ ) + ν e → W(Leading jet |y|
0 0.5 1 1.5 2 2.5 3 3.5 4 Pred./Data 0.6 0.8 1 1.2 1.4 ALPGEN+PY6 SHERPA 1.4
Figure 1. Distribution of events passing the W + jets signal selection as a function of the exclu-sive jet multiplicity (upper left), the HT (upper right), the leading jet’s pT (lower left), and the
leading jet’s rapidity (lower right). The lower panels display the ratio of the predictions for signal plus background to data using either Alpgen+Pythia 6 (blue) or Sherpa 1.4 (orange) as the signal simulation. The statistical uncertainty of the data is shown as black error bars and the total uncertainty in the prediction as the hatched band. The latter consists of the systematic uncer-tainties, including the uncertainty due to the luminosity, and the statistical uncertainties from the predictions and the data-driven multijet estimate.
The correction procedure uses the Alpgen+Pythia 6 simulation of W + jets
produc-tion and corrects for selecproduc-tion efficiencies and resoluproduc-tion effects. Migraproduc-tions between bins
that occur during the reconstruction of events are corrected for using an iterative Bayesian
unfolding method [
85
,
86
] with two iterations. In addition corrections for events that are
outside the fiducial region but are reconstructed within the signal region or events that
are not reconstructed due to detector inefficiencies are included. The correction procedure
includes an extrapolation from the signal region, which has a veto on events with b-tagged
JHEP05(2018)077
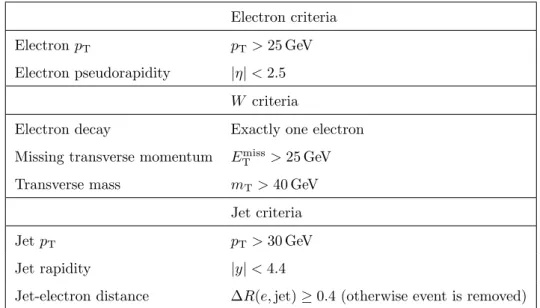
Electron criteriaElectron pT pT> 25 GeV
Electron pseudorapidity |η| < 2.5 W criteria
Electron decay Exactly one electron Missing transverse momentum ETmiss> 25 GeV Transverse mass mT> 40 GeV
Jet criteria
Jet pT pT> 30 GeV
Jet rapidity |y| < 4.4
Jet-electron distance ∆R(e, jet) ≥ 0.4 (otherwise event is removed)
Table 2. Kinematic criteria defining the fiducial phase space for the W → eν final state in association with jets.
jets, to the fiducial region, which does not. W boson production in association with
c-and b-quarks is 18% of the combined fiducial cross section for N
jets≥ 1. This reduces by
only 2% in the signal region from the b-tagged jet veto because, in events with one jet,
contributions from W + c production are larger and these contributions are only slightly
affected by this veto. The extrapolation therefore has a small effect compared to other
corrections, such as the one accounting for the electron identification efficiency.
For differential distributions, the unfolding is performed in two dimensions, one of
which is always the jet multiplicity. In this way, migrations between jet multiplicity bins,
which can be large, are considered. Migrations in E
Tmisscompose a large part of the
correc-tion in and out of the fiducial region, in particular for zero-jet events, and are accounted
for by the procedure. Other migrations, for example those in m
Tare also included but are
small. Differential cross sections for a given jet multiplicity, such as N
jets≥ 1, are obtained
by summing over the contributing jet multiplicities in the two-dimensional result.
The W
+and W
−distributions are unfolded independently following the same
proce-dure. The ratio of W
+to W
−cross sections is calculated from these unfolded distributions,
taking correlations into account. All uncertainties of a statistical nature, such as the
sta-tistical uncertainty of the data, the stasta-tistical uncertainty of simulated samples used in the
background estimate, or the uncertainty from limited sample size of the signal simulation
used in the unfolding are treated as uncorrelated between bins and between W
+and W
−production. All other systematic uncertainties are treated as fully correlated between bins
and between the production of W
+and W
−bosons.
6
Systematic uncertainties
The dominant sources of systematic uncertainty in the cross-section measurement for events
with at least one jet are the jet energy scale (JES) and the jet energy resolution (JER).
JHEP05(2018)077
The systematic uncertainties as a function of the number of jets in the W cross section
and the W
+/W
−cross-section ratio measurements are summarised in tables
3
–
4
.
The JES systematic uncertainties are determined by a combination of data-driven in
situ techniques and simulation-based approaches [
72
–
74
,
76
]. They are propagated through
the analysis as 18 independent components and account for systematic uncertainties in the
in situ measurements, pile-up-corrections to the jet energies, jet punch-through to the
muon system, effects due to the light quark or gluon origin of the jets, b-tagged jet energy
calibration and other smaller effects. The uncertainty in the JES varies as a function of the
jet p
Tand η and is approximately 3.5% for central jets with p
T> 30 GeV and decreases
to about 1% for central jets with p
T> 100 GeV. For forward jets, the JES uncertainty
is almost twice as large as for central jets, mainly due to the uncertainties in the
jet-η-intercalibration [
73
]. In the analysis, jet energies are shifted in simulated events by the
size of the JES uncertainty component, and the event selection, including a recalculation
of E
Tmissand m
T, is re-evaluated. The full analysis chain, which includes the background
estimates and the unfolding, is repeated and the change in the cross section with respect
to the nominal is taken as the systematic uncertainty. For a given source, the average of
the up and down variations is taken as the symmetric uncertainty. The impact of the JES
uncertainties on the cross section ranges from 8% to 55% for N
jets≥ 1 to N
jets≥ 7 but
decreases for the W
+/W
−cross-section ratio to below 1% and up to 17% for N
jets≥ 1
to N
jets≥ 6. This method of propagating the systematic uncertainties is used for all
other uncertainties except for uncertainties due the unfolding procedure itself. The total
systematic uncertainty is the sum in quadrature of the individual uncertainties.
The uncertainty of the JER is also determined through data-driven in situ techniques
and includes a dedicated estimate of effects from electronic noise in the calorimeter and
pile-up [
72
]. It is propagated through the analysis by smearing the energies of simulated
jets, thereby degrading the jet resolution. For central jets, the JER uncertainty is small
— about 2% for jets with a p
Tof 30 GeV — but increases for jets in the forward region.
In the W + jets cross section, this translates to uncertainties of 9% to 20% for N
jets≥ 1 to
N
jets≥ 7. In the W
+/W
−cross-section ratio, the impact of the JER uncertainty decreases
to values of less than 1% to 5% for N
jets≥ 1 to N
jets≥ 6.
Additional experimental systematic uncertainties considered in this analysis include
uncertainties in the b-tagged jet identification efficiencies [
79
,
87
,
88
], uncertainties due to
the low-momentum tracks in the E
Tmisscalculation [
80
], and uncertainties in the electron
energy scale, energy resolution and scale factors used to correct trigger, reconstruction,
identification, and isolation efficiencies in the simulation [
66
,
89
]. For the W
+and W
−cross sections and their ratio, the charge misidentification for electrons in the simulation is
adjusted by randomly flipping the charge so that the overall misidentification rate matches
that in the data.
The uncertainty due to this correction is small.
An uncertainty of
1.9% [
65
] in the integrated luminosity is applied to the signal predictions and all background
estimates that are determined from simulation. The effect of the small relative uncertainty
of the LHC proton beam energy [
90
] is negligible and is not included here.
The multijet background estimate is affected by uncertainties due to the choice of
tem-plate and fit procedure. The uncertainty in the shape of the multijet temtem-plate is estimated
JHEP05(2018)077
by varying separately both the inverted isolation criteria and the inverted identification of
the electron used to select the multijet-enriched data sample. The influence of the signal
template in the E
Tmissfit is determined by using the Sherpa simulation instead of
Alp-gen+Pythia 6 for the modelling of W + jets production. The impact due to statistical
uncertainties in the templates is evaluated by creating a thousand pseudo-data samples
drawn from the templates and refitting the data with each. Uncertainties due to the fit
procedure are estimated by varying the lower and upper bound of the fit range separately,
as well as changing the binning used in the fit. The statistical uncertainty in the fit
param-eters is also included. The uncertainty in the W cross section from these sources ranges
from less than 1% to about 12% for N
jets≥ 0 to N
jets≥ 7; the largest contributions to
the uncertainty are due to the fit range variation, the modification of the inverted
elec-tron identification, the choice of W + jets generator, and, at higher jet multiplicities, the
statistical uncertainties. The uncertainty in the W
+/W
−cross-section ratio ranges from
less than 1% to 27% for N
jets≥ 0 to N
jets≥ 6 and is larger than that of the W boson
measurement due to statistical uncertainties from the fit as well as the inverted electron
identification and the fit range uncertainties that do not fully cancel out in the ratio.
Uncertainties from the background estimates that are derived using simulation include
theoretical uncertainties in the cross section and the statistical uncertainty of the
sim-ulated samples. The theoretical uncertainties are evaluated for t¯
t and single top quark
production by simultaneously varying the cross section by ±6.8% [
53
–
62
], for diboson
pro-duction (W W , W Z, ZZ) by simultaneously varying the cross section by ±7% [
91
] and for
Z production by varying the cross section by ±5% [
92
]. For the t¯
t estimate, the
normal-isation factor, as discussed in section
4
, is also removed and the difference is taken as an
uncertainty. Additional uncertainties in the modelling of the shape of the distributions are
not considered. Backgrounds from single top quark, diboson and Z boson production are
small, and the impact of the cross-section uncertainties is minimal, therefore any modelling
uncertainties are negligible. For the t¯
t background, the theoretical uncertainties only have
a noticeable effect in the N
jetsdistribution for events with 5–7 jets where t¯
t production is
a significant contribution. The impact of t¯
t background modelling uncertainties is
cross-checked by comparing to an alternative t¯
t prediction from MC@NLO+Herwig [
93
]. The
results from this prediction are well covered by other uncertainties, except for in events
with N
jets≥ 7 where this prediction is known to have large differences from the data in the
t¯
t-enriched data sample. The combined impact of the non-multijet background uncertainty
sources ranges from less than 1% to 22% for N
jets≥ 0 to N
jets≥ 7 for the W cross section,
and from 1% to 12% for N
jets≥ 0 to N
jets≥ 6 in the W
+/W
−cross-section ratio. The
dominant sources of uncertainty are those related to the t¯
t normalisation.
In addition to the experimental uncertainties in the b-tagged jet identification
efficien-cies, a theoretical uncertainty in the cross section of W production in association with
c-and b-quark jets is considered. This accounts for any mismodelling in the extrapolation
from the signal region, which includes a veto of events with b-tagged jets, to the fiducial
region, which has no such veto. The uncertainty in these cross sections is applied by scaling
the W + c contribution by a factor of 1.8 and the sum of the W + c¯
c and W + b¯
b
contri-butions by a factor of 0.5. These factors are obtained by comparing the data to the signal
JHEP05(2018)077
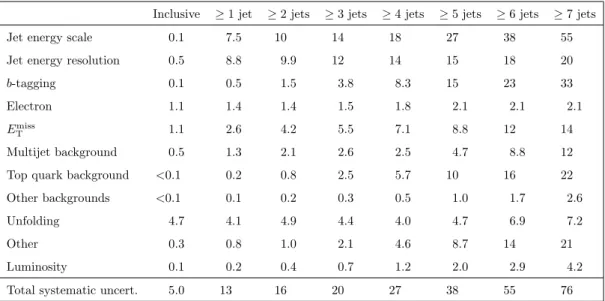
Inclusive ≥ 1 jet ≥ 2 jets ≥ 3 jets ≥ 4 jets ≥ 5 jets ≥ 6 jets ≥ 7 jets
Jet energy scale 0.1 7.5 10 14 18 27 38 55
Jet energy resolution 0.5 8.8 9.9 12 14 15 18 20
b-tagging 0.1 0.5 1.5 3.8 8.3 15 23 33
Electron 1.1 1.4 1.4 1.5 1.8 2.1 2.1 2.1
Emiss
T 1.1 2.6 4.2 5.5 7.1 8.8 12 14
Multijet background 0.5 1.3 2.1 2.6 2.5 4.7 8.8 12
Top quark background <0.1 0.2 0.8 2.5 5.7 10 16 22
Other backgrounds <0.1 0.1 0.2 0.3 0.5 1.0 1.7 2.6
Unfolding 4.7 4.1 4.9 4.4 4.0 4.7 6.9 7.2
Other 0.3 0.8 1.0 2.1 4.6 8.7 14 21
Luminosity 0.1 0.2 0.4 0.7 1.2 2.0 2.9 4.2
Total systematic uncert. 5.0 13 16 20 27 38 55 76
Table 3. Relative systematic uncertainties in the measured W + jets cross sections in percent as a function of the inclusive jet multiplicity. The uncertainty from b-tagging includes the uncertainties in the b-tagged jet identification and misidentification efficiencies as well as the impact of W +c, c¯c, b¯b cross sections in the extrapolation from the signal region to the fiducial region. Other backgrounds summarises the impact of Z and diboson cross sections as well as the statistical uncertainty in the background estimates. Other combines uncertainties in the pile-up modelling and the impact of matching jets to the primary vertex.
Inclusive ≥ 1 jet ≥ 2 jets ≥ 3 jets ≥ 4 jets ≥ 5 jets ≥ 6 jets
Jet energy scale <0.1 0.3 1.2 2.3 3.9 9.2 17
Jet energy resolution 0.1 0.7 1.6 2.5 2.6 3.0 4.6
b-tagging <0.1 0.2 0.5 1.5 4.2 9.4 17
Electron 0.1 0.1 0.1 0.1 0.5 0.5 0.5
Emiss
T 0.1 0.8 1.9 2.8 3.8 5.5 6.1
Multijet background 0.3 1.2 2.9 3.2 5.9 15 27
Top quark background <0.1 0.1 0.3 1.2 3.3 7.0 12
Other backgrounds <0.1 0.1 0.2 0.3 0.7 1.7 2.8
Unfolding 0.6 0.5 0.6 0.7 1.3 1.8 2.7
Other <0.1 0.1 0.3 0.9 2.4 6.4 13
Luminosity <0.1 <0.1 0.1 0.2 0.5 1.1 1.8
Total systematic uncert. 0.7 1.8 4.1 5.9 10 23 41
Table 4. Relative systematic uncertainties in the measured (W++ jets)/(W−+ jets) cross-section ratio in percent as a function of the inclusive jet multiplicity. The uncertainty from b-tagging includes the uncertainties in the b-tagged jet identification and misidentification efficiencies as well as the impact of W +c, c¯c, b¯b cross sections in the extrapolation from the signal region to the fiducial region. Other backgrounds summarises the impact of Z and diboson cross sections as well as the statistical uncertainty in the background estimates. Other combines uncertainties in the pile-up modelling and the impact of matching jets to the primary vertex.
JHEP05(2018)077
and background predictions using a heavy flavour-enriched W + jets data sample, which
requires events with at least one b-tagged jet and one or two additional jets. The impact
on the measured cross section is below 2% for all jet multiplicities and in both the W cross
section and the W
+/W
−cross-section ratio.
The uncertainties due to the unfolding result from imperfections in the modelling of
W + jets predictions as well as the size of the simulated sample used. The impact of the
former is evaluated by repeating the unfolding using input from the Sherpa generator
in-stead of the Alpgen+Pythia 6 generator and also by using input from Alpgen+Pythia
6 where the true distribution in the unfolding matrix is reweighted to provide a better
de-scription of the data at reconstructed level. The dependence due to the size of the simulated
sample is derived using pseudo-experiments and the spread of the results is taken as an
uncertainty. The impact on the measured cross section ranges from 0.5% to 3%.
7
Theoretical predictions
The measured cross sections for W + jets production are compared to a number of
theo-retical predictions at NNLO, NLO, and leading order (LO) in perturbative QCD, which
are summarised in table
5
. These predictions, with the exception of the NNLO results,
are computed in the same phase space as the measurement, defined in table
2
. In general,
the NNLO and NLO predictions include theoretical uncertainties due to the choice of scale
and the PDFs, while the LO predictions include only statistical uncertainties.
7.1
NNLO predictions
The W + jets predictions at NNLO are calculated using the N
jettiprogram [
4
,
5
], which
uses the so-called N-jettiness subtraction technique to control the infrared singularities
of the final-state partons. This calculation uses a renormalisation and factorisation scale
choice of µ
o=
q
m
2W+ Σ(p
jT)
2and CT14 NNLO PDFs. All the kinematic selections listed
in table
2
are applied except for the jet rapidity requirement, which is |y| < 2.5 for the
leading jet for this calculation. In order to compare the N
jettiresults to the data, the
ratio of events selected using a leading jet rapidity criterion of |y| < 4.4 to events using a
criterion of |y| < 2.5 is estimated with the Alpgen+Pythia 6 simulation as a function
of each differential observable and applied as a correction to the N
jettiresults. The size
of this correction is around 10% to 15% at low p
Tof the W boson and of the jets as well
as at low H
Tand decreases to zero at around 200 GeV to 250 GeV in p
T(and at around
500 GeV for H
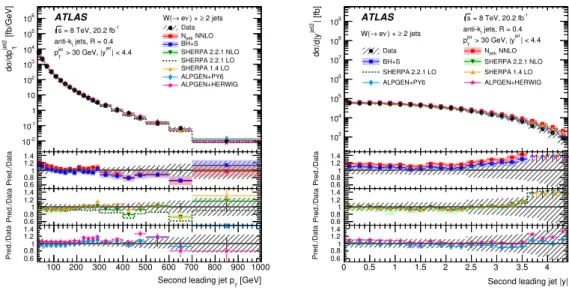
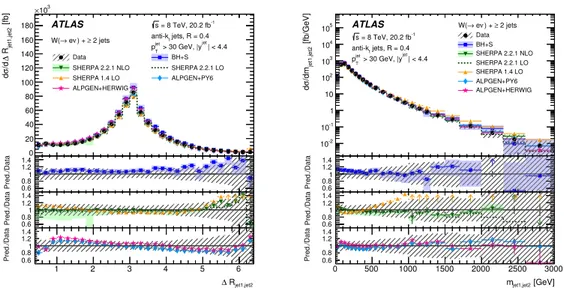
T). For the differential cross section as function of the second leading jet’s
rapidity, the correction is approximately constant at 10%. Uncertainties in this correction
factor include statistical uncertainties from the Alpgen+Pythia 6 sample and the change
in the correction when using the Sherpa 1.4.1 generator. The theoretical uncertainties in
the NNLO prediction are obtained by multiplying and dividing µ
oby a factor of two.
7.2
NLO predictions
The BlackHat+Sherpa predictions (abbreviated to BH+S in the figures) include NLO
calculations for W + jets production with up to five additional jets [
1
–
3
]. The BlackHat
JHEP05(2018)077
Program Order Nmax
partons PDF set NPC PS Comments
in αS at highest order
Njetti NNLO 1 CT14 X Not shown for Njets,
∆Rjet1,jet2and mjet1,jet2
BlackHat+Sherpa NLO 1, 2 or 3 CT10 X
MCFM 6.8 NLO 1 CT10
+ 3 more
X Figure7only
Powheg+Pythia 8 NLO 1 CT14 X Figure7only
Sherpa 2.2.1 NLO 2 CT10 X Including NLO EW
cor-rections in figure7
Sherpa 2.2.1 LO 2 (3) NNPDF 3.0 X
Alpgen+Pythia 6 LO 5 CTEQ6L1 (LO) X
Alpgen+Herwig LO 5 CTEQ6L1 (LO) X
Sherpa 1.4.1 LO 4 CT10 X
Table 5. Summary of theoretical predictions, including the maximum number of partons at the highest order in αSused in this analysis, the PDF set used, if non-perturbative corrections (NPC)
are applied and if a modelling of the parton shower (PS) is included and additional comments. The maximum number of partons in between parentheses is only used in the estimate of systematic uncertainties in the NPC. NLO electroweak (EW) corrections are applied to the prediction at NLO in αSonly.
program provides the NLO virtual matrix element corrections while Sherpa calculates the
tree-level diagrams and provides the phase-space integration. Focusing on events with one
or two jets, only calculations at NLO for W + 1-jet, W + 2-jets, and W + 3-jets production
are used for the corresponding measured jet multiplicity. These predictions use the CT10
NLO PDF set and the choice of renormalisation and factorisation scale is H
T0/2, where H
T0is the scalar sum of the transverse momenta of the W boson and the jets. The theoretical
uncertainties considered include uncertainties due to the PDF error set and uncertainties
due to the choice of scale, which are evaluated by independently varying the renormalisation
and factorisation scales up and down by a factor of two. For W + 1-jet production, the
BlackHat+Sherpa matrix elements are also used in the exclusive sums approach [
94
],
in which NLO information from W + 2-jet production is utilised. Through this approach,
additional contributions from higher multiplicity final states can be included in contrast
to the standard fixed-order prediction. This is useful for observables that are sensitive to
higher parton multiplicities.
The MCFM calculation in this paper predicts W + jets production with one jet at
NLO [
95
,
96
], with a second jet, if present, at LO accuracy as the real emission correction
in the NLO calculation. Renormalisation and factorisation scales are set to H
T/2. Four
choices of PDF sets are shown: CT10, HERAPDF 1.5 [
97
], MSTW 2008 and NNPDF
2.3 [
98
], which are all at NLO. These predictions include uncertainties due to the PDF
error set, the value of α
Sand the choice of scales, which are evaluated in the same way
as above.
The Sherpa 2.2.1 generator is used to calculate W + jets production at NLO for up
to two associated jets and at LO for a third jet. This calculation includes matching with
a parton shower, hadronisation, and modelling of the underlying event. The PDF set
JHEP05(2018)077
used is CT10 and the scale is set to H
T0/2. These predictions include uncertainties due
to the PDF error set and the choice of scale, which are evaluated in the same way as
above. The corresponding LO prediction from the same Sherpa version is given in addition
for comparison. In the figures, the LO prediction is shown without any uncertainties.
Sizeable NLO corrections to the cross section from electroweak (EW) emissions are expected
especially at large transverse momentum of the produced W bosons in association with one
or two jets [
99
]. The NLO EW corrections are determined with the same set-up as the
NLO QCD-only Sherpa 2.2.1 predictions.
The Powheg r2129 results (abbreviated to PWHG+PY8 in the figures) are calculated
at NLO for W production in association with one jet [
47
]. This is interfaced to the parton
shower of Pythia 8 [
100
] and combined using the MiNLO technique [
6
]. The CT14 PDF
set [
31
] is used for the Powheg calculation, and the PDF set CTEQ6L1 together with the
tune AZNLO [
101
] for the parton shower. The Powheg predictions of the overall cross
section are corrected by a factor of 1.1 for events with N
jets≥ 1, as indicated in the figures,
to match the total integrated number of events in the data. Only statistical uncertainties
are included.
7.3
LO predictions
Predictions from the multi-leg LO generators Alpgen and Sherpa (version 1.4.1) are
com-pared to the data. The details of these predictions are described in section
3
. In addition
to the Alpgen predictions showered with Pythia 6 (abbreviated to ALPGEN+PY6 in
the figures), a prediction using an alternative parton shower model from Herwig [
48
] with
Jimmy [
102
] for the underlying event is shown. This prediction uses the same PDF as
Alpgen+Pythia 6, but a different tune: AUET2 [
49
]. Only statistical uncertainties are
shown. Theoretical uncertainties are large for LO calculations.
7.4
Non-perturbative corrections
The N
jetti, BlackHat+Sherpa, and MCFM results do not include non-perturbative
ef-fects from hadronisation and the underlying event. These corrections are computed for
each bin with Sherpa 2.2.1 [
37
] combining matrix element calculations with up to two
parton emissions at LO in pQCD. The calculation uses the NNPDF 3.0 PDF set and
dynamic renormalisation and factorisation scales determined by the CKKW scale-setting
procedure. The corrections are typically around 2–3% and are applied to the predictions for
all measured distributions. Statistical uncertainties in these corrections and the systematic
uncertainty, defined by the envelope of variations of the starting scale of the parton shower,
the recoil scheme, the mode of shower evolution and the number of emitted partons from
the matrix element, are included in the respective theory uncertainties. For the W
+/W
−predictions, no non-perturbative corrections are required as these effects cancel out in the
ratio. The impact of QED radiation, which is considered as part of the dressed-electron
definition in the measured cross sections, on the parton-level theoretical predictions is
investigated using Sherpa 2.2.1 with the same set-up as the NLO Sherpa predictions
described above and found to be very small. No correction for this effect is applied.
JHEP05(2018)077
8
Cross-section results
The measured cross sections for W → eν production and the cross-section ratios of
W
+/W
−, obtained from separate measurement of W
+and W
−production, are shown
for the jet multiplicity distributions as well as for distributions with N
jets≥ 1. For
dis-tributions with N
jets≥ 2, only the cross sections for W → eν production are shown. All
results are compared to the set of predictions discussed in section
7
.
8.1
Jet multiplicity distribution
The cross section for W production and the ratio of W
+/W
−for different inclusive jet
multiplicities are shown in figure
2
. Overall the data agree with the predictions within
the experimental uncertainties. At higher multiplicities, the LO Sherpa predictions start
to diverge from the data, while the NLO Sherpa predictions provide a much better
de-scription of the data. The Alpgen predictions are shown for two different parton shower
models, both of which are consistent with the data within the experimental
uncertain-ties. The trends for all predictions are the same for the distributions of the W
+and W
−cross sections as well as the exclusive jet multiplicities (see appendix
A
). For the ratio of
W
+/W
−, agreement between the data and the predictions is much improved, indicating
that theoretical mismodelling related to jet emission cancels out in the ratio. The Alpgen
predictions, which perform very well for the cross-section measurement have an offset in the
W
+/W
−cross-section ratio for events with one jet, which is outside of the experimental
uncertainties. This is present for both parton shower models, thereby indicating a problem
in the matrix element calculation or an incorrect u/d ratio in the LO PDF.
8.2
Distributions for N
jets≥ 1
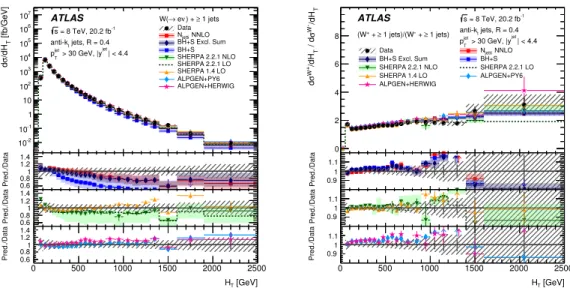
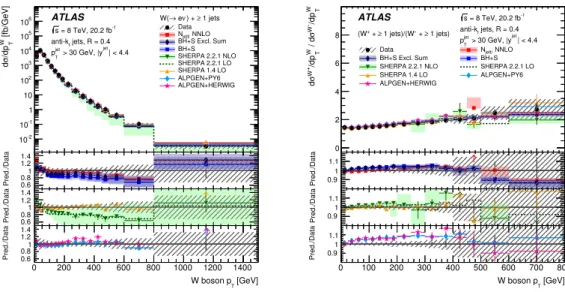
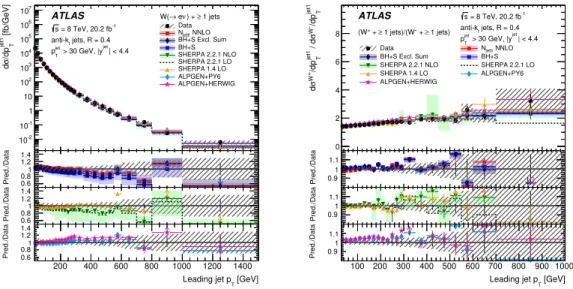
The differential cross section for W production and the ratio of W
+/W
−as a function of H
Tare shown in figure
3
for N
jets≥ 1. The H
Tdistribution is a very important test of pQCD as
the higher values are sensitive to higher jet multiplicities and topologies such as qq → qq
0W
(dijet production with a W boson emitted from one of the initial or final state quarks). The
LO predictions of Sherpa and Alpgen, which both include multiple jets in the matrix
element calculation describe the data best, although these predictions have large theoretical
uncertainties. The BlackHat+Sherpa predictions underestimate the data at large values
of H
T. This is expected since, at these large values of H
T, contributions from additional jets
are important, which are only partially present in this calculation. The predictions from
the BlackHat+Sherpa exclusive sums method and from the NNLO N
jetticalculation,
which include an additional jet emission at NLO, provide better agreement with the data.
These effects cancel out to a large extent in the ratio of W
+/W
−. At the largest measured
values of H
T, where the measured cross section is small, the total experimental uncertainty
in the W
+/W
−cross-section ratio increases due to larger statistical uncertainties in the
data and some systematic uncertainties that do not fully cancel out in the ratio.
The distribution of the p
Tof the W boson is potentially sensitive to the parton
dis-tributions in the proton. For N
jets≥ 1, figure
4
shows the differential cross section as a
JHEP05(2018)077
) [pb] jets (W+N σ -2 10 -1 10 1 10 2 10 3 10 4 10 5 10 6 10 7 10 8 10 Data BH+S Excl. Sum BH+S SHERPA 2.2.1 NLO SHERPA 2.2.1 LO SHERPA 1.4 LO ALPGEN+PY6 ALPGEN+HERWIG ATLAS -1 = 8 TeV, 20.2 fb s jets, R = 0.4 t anti-k | < 4.4 jet > 30 GeV, |y jet T p ) + jets ν e → W( Pred./Data 0.60.8 1 1.2 1.4 Pred./Data 0.6 0.81 1.2 1.4 jets N 0 ≥ ≥1 ≥2 ≥3 ≥4 ≥5 ≥6 ≥7 Pred./Data 0.6 0.81 1.2 1.4 ) jets +N-(W σ ) / jets +N + (W σ 0 2 4 6 8Data BH+S Excl. Sum BH+S SHERPA 2.2.1 NLO SHERPA 2.2.1 LO SHERPA 1.4 LO ALPGEN+PY6 ALPGEN+HERWIG ATLAS -1 = 8 TeV, 20.2 fb s jets, R = 0.4 t anti-k | < 4.4 jet > 30 GeV, |y jet T p + jets) + jets)/(W + (W Pred./Data 0.9 1 1.1 Pred./Data 0.9 1 1.1 jets N 0 ≥ ≥1 ≥2 ≥3 ≥4 ≥5 ≥6 Pred./Data 0.9 1 1.1
Figure 2. Cross section for the production of W bosons (left) and the W+/W− ratio (right)
for different inclusive jet multiplicities. For the data, the statistical uncertainties are indicated as vertical bars, and the combined statistical and systematic uncertainties are shown by the hatched bands. The uppermost panel in each plot shows the differential cross sections, while the lower panels show the ratios of the predictions to the data. The theoretical uncertainties on the predictions are described in the text. The arrows on the lower panels indicate points that are outside the displayed range. 0 500 1000 1500 2000 2500 [fb/GeV] T /dH σ d -2 10 -1 10 1 10 2 10 3 10 4 10 5 10 6 10 7 10 Data NNLO jetti N BH+S Excl. Sum BH+S SHERPA 2.2.1 NLO SHERPA 2.2.1 LO SHERPA 1.4 LO ALPGEN+PY6 ALPGEN+HERWIG ATLAS -1 = 8 TeV, 20.2 fb s jets, R = 0.4 t anti-k | < 4.4 jet > 30 GeV, |y jet T p 1 jets ≥ ) + ν e → W( 0 500 1000 1500 2000 2500 Pred./Data 0.60.8 1 1.2 1.4 0 500 1000 1500 2000 2500 Pred./Data 0.60.8 1 1.2 1.4 [GeV] T H 0 500 1000 1500 2000 2500 Pred./Data 0.6 0.81 1.2 1.4 0 500 1000 1500 2000 2500 T /dH -W σ / d T /dH + W σ d 0 2 4 6 8
Data Njetti NNLO
BH+S Excl. Sum BH+S SHERPA 2.2.1 NLO SHERPA 2.2.1 LO SHERPA 1.4 LO ALPGEN+PY6 ALPGEN+HERWIG ATLAS s = 8 TeV, 20.2 fb-1 jets, R = 0.4 t anti-k | < 4.4 jet > 30 GeV, |y jet T p 1 jets) ≥ + 1 jets)/(W ≥ + + (W 0 500 1000 1500 2000 2500 Pred./Data 0.9 1 1.1 0 500 1000 1500 2000 2500 Pred./Data 0.9 1 1.1 [GeV] T H 0 500 1000 1500 2000 2500 Pred./Data 0.9 1 1.1
Figure 3. Differential cross sections for the production of W bosons (left) and the W+/W− ratio (right) as a function of HTfor events with Njets≥ 1. The last bin in the left figure includes values
beyond the shown range. For the data, the statistical uncertainties are indicated as vertical bars, and the combined statistical and systematic uncertainties are shown by the hatched bands. The uppermost panel in each plot shows the differential cross sections, while the lower panels show the ratios of the predictions to the data. The theoretical uncertainties on the predictions are described in the text. The arrows on the lower panels indicate points that are outside the displayed range.