This content has been downloaded from IOPscience. Please scroll down to see the full text.
Download details:
IP Address: 130.238.171.188
This content was downloaded on 15/11/2016 at 08:00
Please note that terms and conditions apply.
You may also be interested in:
A search for an excited muon decaying to a muon and two jets in pp collisions at $\sqrt{s}\;=\;8\;{\rm{TeV}}$ with the ATLAS detector
G Aad, B Abbott, J Abdallah et al.
Status of Higgs boson searches at the beginning of the LHC era A Sopczak
CMS Physics Technical Design Report, Volume II: Physics Performance The CMS Collaboration
Top quark physics in hadron collisions Wolfgang Wagner
Measurement of the cross-section of high transverse momentum vector bosons reconstructed as single jets and studies of jet substructure in pp collisions at $\sqrt{s}$ = 7 TeV with the ATLAS detector G Aad, T Abajyan, B Abbott et al.
Search for excited electrons and muons in TeV proton–proton collisions with the ATLAS detector G Aad, T Abajyan, B Abbott et al.
Search for scalar leptoquarks in pp collisions at
= 13 TeV with the ATLAS experiment
View the table of contents for this issue, or go to the journal homepage for more 2016 New J. Phys. 18 093016
PAPER
Search for scalar leptoquarks in pp collisions at
p
ffiffiffi
s
=13TeV with
the ATLAS experiment
The ATLAS Collaboration
Keywords: leptoquark, ATLAS, LHC
Abstract
An inclusive search for a new-physics signature of lepton-jet resonances has been performed by the
ATLAS experiment. Scalar leptoquarks, pair-produced in pp collisions at
s
=13 TeV at the large
hadron collider, have been considered. An integrated luminosity of 3.2 f b
−1, corresponding to the full
2015 dataset was used. First
(second) generation leptoquarks were sought in events with two electrons
(muons) and two or more jets. The observed event yield in each channel is consistent with Standard
Model background expectations. The observed
(expected) lower limits on the leptoquark mass at 95%
confidence level are 1100 and 1050 GeV (1160 and 1040 GeV) for first and second generation
leptoquarks, respectively, assuming a branching ratio into a charged lepton and a quark of 100%.
Upper limits on the aforementioned branching ratio are also given as a function of leptoquark mass.
Compared with the results of earlier ATLAS searches, the sensitivity is increased for leptoquark masses
above 860 GeV, and the observed exclusion limits confirm and extend the published results.
Contents
1. Introduction 1
2. The ATLAS detector 3
3. Signal and background simulations 3
4. Physics object definition 4
5. Dataset and event selection 5
6. Analysis strategy: signal, control and validation regions 5
7. Background estimation 6
8. Sources of systematic uncertainties 7
9. Results 9
10. Summary and conclusions 11
1. Introduction
The large hadron collider(LHC) Run 2 has provided the possibility to study pp collisions at 13 TeV centre-of-mass energy for thefirst time, and has thus opened a new discovery window for physics beyond the standard model(SM). The presented analysis is an inclusive search for new physics phenomena resulting in final state signatures of lepton-jet resonances in thefirst 3.2 f b−1of 13 TeV data collected by the ATLAS detector. Such phenomena may not have been kinematically accessible at the lower Run 1 centre-of-mass energy of 8 TeV. As a benchmark signal model, scalar leptoquarks decaying to jets and leptons were used.
OPEN ACCESS
RECEIVED
20 May 2016
REVISED
15 July 2016
ACCEPTED FOR PUBLICATION
2 August 2016
PUBLISHED
7 September 2016
Original content from this work may be used under
the terms of theCreative
Commons Attribution 3.0 licence.
Any further distribution of this work must maintain attribution to the author(s) and the title of the work, journal citation and DOI. Article funded
by SCOAP3
.
Leptoquarks(LQs) feature in a number of theories [1–7] which extend the SM, such as grand unified theories
and models with quark and lepton substructure. LQs possess non-zero baryon and lepton numbers and their existence would provide a connection between quarks and leptons. This could help explain the observed similarity of the quark and lepton sectors in the SM. LQs carry a colour-triplet charge and a fractional electric charge[8]. They can be scalar or vector bosons and they decay directly to lepton–quark pairs. The analysis
presented in this paper focuses on the pair production of scalar leptoquarks.
A single Yukawa coupling(lℓ) governs the interaction strength between a scalar LQ and a given quark (q)
and lepton(ℓ) pair. A Feynman diagram showing a LQ decay is shown in figure1. The couplings are determined by two free parameters of the model: the branching ratio into charged leptons,β, and the coupling parameter, λ. The coupling to a charged lepton and a quark is given bylℓ= b l, the coupling to a neutrino and a quark by
ln = 1-b l. The pair-production cross section of leptoquarks in pp collisions is largely insensitive to the
coupling values, since the basic processes of LQ pair-production are gluon fusion and quark–antiquark annihilation. Example LO diagrams are shown infigure2. At a centre-of-mass energy of s =13 TeV, gluon fusion is the dominant process. For LQ masses(mLQ) up to a few hundred GeV, it contributes up to 95% of the
total cross section. Above mLQ= 1.5 TeV, the contribution from quark–antiquark annihilation amounts to
about 30%[9]. Therefore, the parameter of interest — apart from the LQ mass — is the branching ratio β.
The signal benchmark model for LQ production used in this analysis is the minimal Buchmüller–Rückl– Wyler model(mBRW) [10]. In this approach a number of constraints are imposed on the LQ properties. Lepton
number and baryon number are separately conserved to prevent fast proton decay. The LQ couplings are also considered to be purely chiral. Furthermore, it is assumed that LQs belong to three generations(first, second and third) which interact only with lepton–quark pairs within the same generation. With this assumption, lepton-flavour violation is suppressed. However, in a more generic picture of leptoquarks, a LQ may couple to a quark and a lepton belonging to different generations[11]. Although the results of this search were not explicitly
interpreted in this type of model, the event selections used were designed to retain sensitivity to leptoquark models in which decays intofirst or second generation leptons and bottom-quarks (b) are possible.
Previous searches for pair-produced LQs have been performed by the ATLAS and CMS collaborations[12– 24] at s=7 and 8 TeV. The existence of scalar LQs with masses up to 1050 and 1000 GeV (forb = 1) for
first-Figure 1. Feynman diagram showing the Yukawa couplinglℓ= b lbetween a leptoquark, a lepton(ℓ) and a quark (q).
Figure 2. Dominant leading-order Feynman diagrams for the pair production of scalar leptoquarks from gluon fusion and quark–antiquark annihilation.
and second-generation scalar LQs, respectively, is excluded at 95% confidence level (CL) by ATLAS [20] in a study
performed at s=8 TeV using 20 f b−1of integrated luminosity. The CMS experiment similarly excluded first-and second-generation scalar leptoquarks up to masses of 1010 GeV first-and 1080 GeV(forb = 1), respectively [21].
In this paper, searches for the pair-production of leptoquarks of thefirst (LQ1) and second (LQ2)
generations, based on events containing exactly two electrons or muons and at least two jets(denoted by eejj and
mmjj, respectively), are reported. In order to keep the search as inclusive as possible, it was not required that the charges of the two leptons in an event must be opposite. Similarly, no selections on the jetflavour were introduced so as not to exclude possibleLQ ebandLQ bm decays.
2. The ATLAS detector
The ATLAS experiment[25] is a multi-purpose detector with a forward-backward symmetric cylindrical
geometry and nearly 4π coverage in solid angle225. The three major sub-components of ATLAS are the tracking detector, the calorimeter and the muon spectrometer(MS). Charged-particle tracks and vertices are
reconstructed by the inner detector(ID) tracking system, comprising silicon pixel (including the newly installed innermost pixel layer), and microstrip detectors covering the pseudorapidity range ∣ ∣h <2.5, and a straw tube tracker that covers ∣ ∣h <2.0. The ID is immersed in a homogeneous 2 T magnetic field provided by a solenoid. Electron, photon, jet andτ lepton energies are measured with sampling calorimeters. The ATLAS calorimeter system covers a pseudorapidity range of ∣ ∣h <4.9. Within the region ∣ ∣h <3.2, electromagnetic calorimetry is provided by barrel and endcap high-granularity lead/liquid argon (LAr) calorimeters, with an additional thin LAr presampler covering ∣ ∣h <1.8, to correct for energy loss in material upstream of the calorimeters. Hadronic calorimetry is provided by a steel/scintillator-tile calorimeter, segmented into three barrel structures within ∣ ∣h <1.7, and two copper/LAr hadronic endcap calorimeters. The forward region (3.1 < ∣ ∣h <4.9) is instrumented by a LAr calorimeter with copper(electromagnetic) and tungsten (hadronic) absorbers.
Surrounding the calorimeters is a MS with superconducting air-core toroids, providing bending powers of 3 Tm in the barrel and 6 Tm in the endcaps. The MS includes a system of precision tracking chambers providing coverage over ∣ ∣h <2.7. Three stations of precision tracking chambers are used to measure the curvature of tracks. The MS also contains detectors with triggering capabilities over ∣ ∣h <2.4 to provide fast muon identification and momentum measurements.
The ATLAS two-level trigger system is used to select events considered in this paper. Thefirst-level trigger is hardware-based while the second, high-level trigger is implemented in software and employs algorithms similar to those used offline in the full event reconstruction.
3. Signal and background simulations
The PYTHIA8.160[26] Monte Carlo (MC) model, based on leading-order (LO) matrix-element calculations
supplemented with parton showers, was used with the ATLASA14[27] set of tuned parameters (tune) for the
underlying event, together with the NNPDF23LO[28] parton distribution functions (PDFs), to produce
simulated samples of pair-producedfirst- and second-generation scalar LQs. Leptoquarks of the first (second) generation decay toe e uu+ - ¯(m m+ -cc¯) final states. Samples were produced for LQ masses in the range of 500–1500 GeV. As was also done in the previous ATLAS publication [20], the value of the coupling parameter λ
was set to 0.01´4pa, whereα is the fine-structure constant. This value of λ determines the leptoquark natural width, which is less than 100 MeV and is smaller than the detector resolution for the reconstruction of leptoquark mass. It also leads to a LQ lifetime sufficiently small such that LQs in the mass range considered in this work would decay promptly. Next-to-leading-order(NLO) calculations [9] of the cross sections for scalar
leptoquark pair-production were used to normalise the signal samples.
The dominant SM backgrounds arise from processes which can produce afinal state containing two reconstructed high transverse momentum(pT) leptons (electrons or muons) and jets. Simulated samples were
made of Drell–Yan production (qq¯Z g*ℓ ℓ+ -) and the production oftt¯, diboson(WW, WZ, and ZZ) and single top-quarks in association with a W boson.
Drell–Yan events with associated jets were simulated using the SHERPA2.1.1[29] generator. Matrix elements
were calculated for up to two partons at NLO and four partons at LO using the COMIX[30] and OPENLOOPS[31]
matrix-element generators and merged with the SHERPAparton shower[32] using the ME+PS@NLO
225
ATLAS uses a right-handed coordinate system with its origin at the nominal interaction point(IP) in the centre of the detector and the z-axis along the beam pipe. The x-axis points from the IP to the centre of the LHC ring, and the y-axis points upward. Cylindrical coordinates (r,f)are used in the transverse plane,f being the azimuthal angle around the z-axis. The pseudorapidity is defined in terms of the polar angleθ ash= -ln tan(q 2 .)
prescription[33]. The CT10 PDF set [34] was used in conjunction with dedicated parton-shower tuning
developed by the authors of SHERPA[32].
For the generation oftt¯and single top quarks in the Wt channel, the POWHEG-BOXv2 generator[35–38]
with the CT10 PDF set in the matrix-element calculations was used. For both processes the parton shower, fragmentation, and the underlying event were simulated using PYTHIA6.428[39] with the PERUGIA2012 tune [40] and using the CTEQ6L1 PDF set[41]. The top-quark mass was set to 172.5 GeV. The EVTGENv1.2.0 program[42] was used to simulate the bottom and charm hadron decays.
Diboson processes with four charged leptons, three charged leptons+ one neutrino or two charged leptons and two neutrinos were simulated using the SHERPA2.1.1 generator. Matrix elements contain all diagrams with four electroweak vertices. They were calculated for up to one(4ℓ, ℓ2 +2n) or zero partons ( ℓ3 +1n) at NLO and up to three partons at LO using the COMIXand OPENLOOPSmatrix element generators and merged with the SHERPAparton shower using the ME+PS@NLO prescription. Diboson processes with one of the bosons decaying hadronically and the other leptonically were simulated using the same SHERPAversion.
All samples of simulated events include the effect of multiple proton–proton interactions in the same or neighbouring bunch crossings(pile-up) which were modelled by overlaying simulated minimum-bias events on each generated signal and background event. These multiple interactions were simulated with the soft QCD processes of PYTHIA8.186[26] using tune A2 [43] and the MSTW2008LO PDF set [44]. The number of overlaid
events was chosen to match the average number of interactions per pp bunch crossing observed in the data as it evolved throughout the data-taking period(giving an average of 14 interactions per crossing for the whole data-taking period). The SM background samples were processed through the GEANT4-based detector simulation [45,46], while a fast simulation using a parameterisation of the performance of the calorimeters [47] and
GEANT4 for the other parts of the detector was used for the signal samples and some samples used for studies of systematic uncertainties. The standard ATLAS reconstruction software was used for both simulated and collision data.
Estimates of the cross sections of background processes were taken from the following theoretical predictions. Single-top production was calculated at NLO+next-to-next-to-leading-logarithm (NNLL) accuracy[48]. Estimates of Drell–Yan andtt¯production cross sections at NLO[29] and NLO+NNLO [49]
accuracy, respectively, were used.
4. Physics object definition
The electron energy was measured using its associated cluster of electromagnetic-calorimeter cells with significant energy deposits, whereas the direction was determined by the track associated with this cluster. To identify and select electrons, requirements were placed on the shape of the cluster, on the quality of the associated track, and on the degree of matching between the track and cluster. Electron candidates must have transverse energyET>30GeVand∣ ∣h < 2.47. Electron candidates associated with clusters in the transition
region between the barrel and endcap calorimeters(1.37 < ∣ ∣h <1.52) were not considered. All electrons must be reconstructed with a cluster-based or a combined cluster- and track-based algorithm[50]. Furthermore, the
impact parameters of the electron track relative to the beam line were required to satisfy ∣d0 s <d0∣ 5and ∣z sin0 q <∣ 0.5 mm, where d0, sd0and z0are the transverse impact parameter, its uncertainty, and the
longitudinal impact parameter, respectively. In addition, electron isolation requirements were imposed on the summed transverse momentum of tracks(transverse energy of clusters) in a cone around the electron track (cluster barycentre). The radius of the cone around the track is D =R 10 GeV pTforpT >50 GeVand 0.2 otherwise226. For the cluster isolation, afixed cone radius size of 0.2 is used. The efficiency of these isolation criteria is higher than 99%. The reconstruction efficiency is higher than 98% in most regions of transverse momentum and pseudorapidity. The identification efficiency varies between 75% and 92%, rising as a function ofET[51]. All of these efficiencies refer to the efficiency for a single electron, independent of the specific event
topology.
Muon tracks were reconstructed independently in the ID and the MS. These muon tracks were required to have a minimum number of associated hits in each system and to satisfy geometrical and momentum matching criteria. The two tracks were then used as input to a combinedfit which takes into account the energy loss in the calorimeter and multiple-scattering effects[52]. To improve momentum resolution and ensure a reliable
measurement at very high momenta, muon tracks were required to have at least three hits in each of the three precision chambers in the MS. Tracks which traverse precision chambers with poor alignment were rejected. Finally, measurements of charge over momentum, performed independently in the ID and MS, were required to agree within seven standard deviations of the sum in quadrature of the uncertainties in the corresponding ID
226Here,
( h) ( f)
D =R D 2+ D 2is a cone defined by differences in pseudorapidity and azimuthal angle. p
and MS measurements. Muon candidates were required to have pT>40 GeV and ∣ ∣h <2.5. Those falling in the
overlap region of the MS barrel and endcap(1.01<∣ ∣h <1.10) were rejected due to the potential
pTmismeasurement resulting from relative barrel-endcap misalignment. Muon candidates were required to
fulfil ∣d0 sd0∣<3 and ∣z sin0 q∣<0.5mm. In order to reduce the background from light- and heavy-hadron decays within jets, muons were required to fulfil isolation requirements. The track-based isolation variable used is the sum of the transverse momenta of the tracks in a cone around the muon of size D =R 10 GeV/pTm, excluding the muon itself and withpTmin GeV. The isolation efficiency is greater than 99%. The efficiency for
reconstructing and identifying muons using the criteria described above is typically greater than 80% for the transverse momentum and pseudorapidity selections used in this work[53]. As for electrons, these efficiencies
refer to single objects.
The anti-ktalgorithm[54] with a radius parameter R=0.4 was used to reconstruct jets from energy clusters in
the calorimeter[55]. Jet calibration is performed using energy- and η-dependent correction factors derived from
simulations together with further corrections from in situ measurements. The jets used in this work must satisfy pT>50 GeV and ∣ ∣h <2.8. Further selections were applied to ensure that all jets considered are well measured [56].
A description of the jet energy scale(JES) measurement and its associated systematic uncertainties can be found in [57]. Jet-flavour tagging techniques were not used in this paper and, as a consequence, good sensitivity was
maintained for LQ decays into a lepton plus any quarkflavour barring the top quark.
Ambiguities in the object identification during reconstruction, i.e. when a reconstructed object matched multiple object identification hypotheses (electron, muon, jet), were resolved in the following way. First, electrons were removed if they shared their track with a muon. In a second step, ambiguities between electrons and jets were removed; if the two objects had D <R 0.2 the jet was rejected; if0.2< D <R 0.4 the electron was rejected. Finally, muon-jet ambiguities were resolved as follows: if the muon and jet were closer than D =R 0.4 the jet was rejected if it has less than three tracks, otherwise the muon was rejected. For the definition of signal and control regions(see section6) only objects remaining after this procedure were considered.
5. Dataset and event selection
Proton–proton collision data at a centre-of-mass energy of s=13 TeV, collected by the ATLAS detector at the
LHC during 2015, were used. After applying data quality criteria, the dataset corresponds to an integrated luminosity of 3.2 f b−1.
Events considered in the search were selected by the ATLAS two-level trigger system[58]. In the eejj channel,
a two-electron trigger was used with anETthreshold of 17 GeV for each electron. The mmjj search used events
selected by either of two single-muon triggers. Thefirst trigger has a muon pTthreshold of 26 GeV and
additional requirements on its properties. In particular, it requires the muon to be isolated, which leads to a loss in efficiency at high pT. To retain a high trigger efficiency in the region of high pT, the second trigger, which has a
pTthreshold of 50 GeV but no additional requirements, was used. The trigger efficiencies for the eejj and mmjj
searches exceed 90% for the object kinematics considered in this analysis.
Multiple pp interactions during bunch crossings lead to events containing a number of reconstructed vertices. The primary vertex of the event is defined as that vertex with the largest sum of squared transverse momenta of its associated tracks. Events which contain a primary vertex with at least two associated tracks satisfying
>
pT,track 0.4 GeV were selected. Furthermore, MC events were given a per-event weight to correct for differences
in the distribution of the average number of pp interactions per bunch crossing between data and simulation. Only events with exactly two charged leptons and at least two jets were considered for this analysis. Scale factors were applied as event weights to correct the MC description of lepton trigger, reconstruction, identification, isolation and impact-parameter cut efficiencies. A description of the derivation of the scale factors, obtained by comparing data and MC predictions in dedicated studies, can be found in[50,59].
6. Analysis strategy: signal, control and validation regions
The analysis presented here used signal(SR), control (CR) and validation (VR) regions to optimise signal significance and to constrain the normalisation of the main background sources. The latter are Drell–Yan events containingZ g*e e ,+ - m m+ -+jets processes (hereafter termed DY+jets) andtt¯events in which both top quarks decay leptonically. The signal, control and validation regions were defined using the following
discriminating observables:
• The dilepton invariant mass:mℓℓ.
• The minimum invariant mass of the two lepton–jet pairs in an event,mLQmin. The lepton–jet pairs were chosen
such that the invariant mass difference between them was smallest. The lower mass of the two combinations was chosen as the discriminating variable following dedicated sensitivity studies.
The signal region was defined by requiringmℓℓ>130 GeV and ST>600 GeV. The cut onmℓℓwas chosen
to reduce the DY+jets background. The cut on STwas optimised by maximising the discovery significance [60]
for LQs with masses between 500 and 1500 GeV, i.e. by performing a likelihoodfit (described in more detail at the end of this section) using themLQmindistribution defined above for STvalues between 0 and 3 TeV in steps of
100 GeV. This study showed that there is little dependence of the optimised STvalue on the LQ mass when using
the shape information of the mass spectrum. It was confirmed that the approach used in previous results, i.e. a cut-and-count analysis in several signal regions defined by varying cuts on the three variables mentioned above, does not give better sensitivity.
The signal selection efficiency is defined as the fraction of all simulated signal events, generated across the full phase space, that survive the trigger and thefinal SR selection. For leptoquarks of the first (second) generation, the overall selection efficiency rises from around 62% to 71% (38% to 43%) as the mass increases from 500 to 1500 GeV. The lower efficiency for second-generation leptoquarks is due to the muon track requirements, which demand hits in three MS stations, and which are needed to give an optimal momentum resolution at high pTfor this analysis.
Three non-overlapping control regions with negligible signal contamination were defined. Differences in the predicted and observed event yields in these regions were used to evaluate scale factors which were used to
normalise the MC predictions for thett¯and DY+jets backgrounds in the SRs. The two DY+jets CRs — one for the
eejjand one for the mmjj channel— were defined by requiring at least two jets and exactly two same-flavour leptons with a dilepton invariant mass restricted to a window around the Z boson mass:70<mℓℓ <110 GeV. Thett¯
control region requires at least two jets, exactly one muon and exactly one electron: these events were selected with the same single-muon triggers as described in section5. This control region is common to both channels.
Validation regions were used to verify that data and MC predictions agree in a phase space close to the signal regions, but still with a negligible signal contamination. This was achieved by applying the same selection as for the signal region, but inverting the cut on ST, i.e. allowing only values below 600 GeV. The requirements for the
various regions are collected in table1.
For the statistical analysis, a profile-likelihood fit of signal plus background templates to the data was performed using the HistFitter package[61]. Systematic uncertainties, which are discussed in section8, were incorporated into the likelihood as constrained nuisance parameters. Thefit was performed in the CRs and the SR simultaneously and was used to extract normalisation factors, i.e. scaling corrections to the event yields predicted by theoretical cross-section calculations, described in section3. In the CRs, only the event yield was used to extract the dominant background(tt¯and DY+jets) normalisation factors. In the SR, both the
normalisation and the shape ofmLQmindistribution were used in thefit to extract the signal normalisation factor.
The templates of themLQminshape consisted of ten bins: six bins of 100 GeV width from 0 to 600 GeV and four
bins of 200 GeV width that cover the range up to 1.4 TeV. The template for the signal was derived from MC predictions. For the background templates, MC predictions as well as data-driven techniques were used, as detailed in the following section.
7. Background estimation
Normalisation factors for the MC predictions of the two main SM backgrounds(DY+jets andtt¯) were estimated with afit to the data, as described in section6. In total, four normalisation factors were calculated: one each fortt¯ and DY+jets events in both the electron and muon channels.
Table 1. Definition of control, signal and validation regions. In all regions, at least two jets were required.
Region Channel #e #μ mℓℓ(GeV) ST(GeV)
¯ tt CR Both 1 1 — — DY+jets CR eejj 2 0 [70, 110] — mmjj 0 2 SR eejj 2 0 >130 >600 mmjj 0 2 VR eejj 2 0 >130 <600 mmjj 0 2
Smaller background contributions arise from the production of a single top quark in the Wt channel, diboson events andZtt+jets events. These were estimated purely from simulation, i.e. their normalisation
was not a free parameter in the combinedfit.
Misidentified or non-prompt leptons originating from hadron decays or photon conversions can arise in multi-jet events, single top production in the s- or t-channel, W+jets andtt¯events(with at least one top quark decaying hadronically). This fake-lepton background is negligible in the mmjjchannel. In the eejjchannel it was evaluated using the same data-driven method as in[62]. This method was used to evaluate the migration of
events among four different data samples: the nominal SR and three analogous samples selected with modified electron selection criteria. The migration between different regions can be described by a matrix, the elements of which are functions of the proportions of true and fake electrons. As a simplification of [62], the fake and real
rates were evaluated as a function of pTonly, since they were observed to be independent ofη within the required
accuracy. They were considered to be the same for all electron candidates in an event. The fake background estimation suffers from low statistical precision. Its statistical uncertainty was treated as one source of the systematic uncertainty in the total background modelling.
Figure3shows the dilepton invariant mass for pairs of electrons(a) and muons (b) in events containing exactly two reconstructed same-flavour leptons and at least two reconstructed jets, following the selections given in section5. This selection stage is also referred to as preselection. The predictions of various background sources are compared with the data. The hatched bands show the total systematic uncertainty in the background prediction. Within the uncertainties, agreement between data and simulation is observed. Normalisation factors for the MC predictions for DY+jets andtt¯events are not applied in the plot.
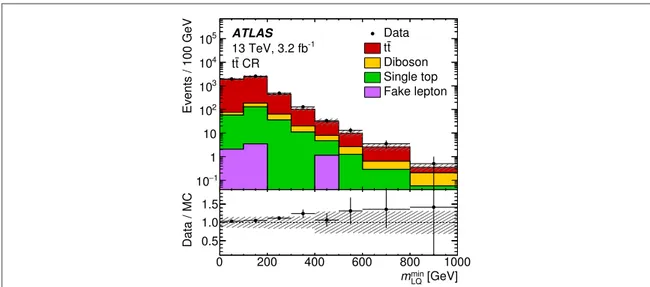
Figure4shows the spectrum of the minimum reconstructed lepton–jet mass in thett¯control region before thefit. Within uncertainties, the data and MC distributions are consistent.
8. Sources of systematic uncertainties
The following sources of systematic uncertainty were considered:
• The uncertainty in the integrated luminosity is 5%. It was derived following a methodology similar to that detailed in[63], from a calibration of the luminosity scale using x–y beam-separation scans performed in
August 2015. This uncertainty affects the predicted signal event yield and those background rates for which theoretical estimates are used.
• The JES uncertainty depends on the pTand η of the jet and on the pile-up conditions in an event. A further
uncertainty in the jet energy resolution was taken into account. These sources each correspond to
uncertainties in the jet energy of up to 3%. The largest resulting uncertainty in the background event yields is
Figure 3. Dilepton invariant mass for pairs of(a) electrons and (b) muons in events containing exactly two reconstructed same-flavour leptons and at least two reconstructed jets. Data are compared to the background prediction. The DY+jets and ¯tt expectations are shown without the normalisation factors from thefit described in section6. The hatched bands show the total systematic uncertainty in the background prediction.
about 10% in the control regions. In the signal region, the uncertainty in the event yields amounts to at most 5% for the background and less than 1% for the signal.
• The uncertainty in the lepton trigger efficiency scale factors is around 2% for the kinematic region considered here.
• Differences between the MC and data in the efficiency of the isolation requirement on the selected muons correspond to uncertainties of 1%–5% on the scale factor to correct the MC prediction. Other muon-related uncertainties arise from the momentum scale, resolution, and quality criteria and typically affect the muon event yields by around 1% in all regions for both signal and background.
• Uncertainties in the electron energy scale, identification and isolation affect the electron event yields by up to 2% in all regions for both signal and background.
• Uncertainties due to choices that have to be made in the event generation which affect final-state observables were estimated for the two major background sources:tt¯and DY+jets. These modelling uncertainties refer to e.g. possible differences in the generation of the hard scattering, scale dependencies, the parton shower and hadronisation and fragmentation models. Differences in the background modelling can change the event yields(total normalisation) in the CRs. Moreover, there is an uncertainty in the shape of themLQmindistribution
in the signal region due to background modelling effects. This was estimated as one uncertainty permLQmin-bin
in the signal region and propagated to the normalisation factor by thefit. The uncertainties were treated as uncorrelated between different bins.
The impact of modelling uncertainties infinal-state predictions fortt¯processes was quantified by comparing various simulated samples: differences due to the parton shower as well as the hadronisation and
fragmentation model were estimated by comparing the nominal sample to one that uses HERWIG++ [64],
effects of additional or reduced radiation were estimated by varying the parton-shower and scale parameters within PYTHIA, and an alternative generator(AMC@NLO[65] with HERWIG++) was used to estimate differences in the hard scatter generation. The total uncertainty in the predictedtt¯event yield varies between 14%(in thett¯CR) to about 30% (in the signal regions).
Modelling uncertainties for the DY+jets background were assessed with different approaches, simulation-based, as well as data-driven in different regions of phase space. The baseline estimate used events from the DY +jets control region with SThigher than 600 GeV. In this region, the shapes of both themLQminand ST
distributions are very similar to those in the signal region, which differs only by the cut on the dilepton invariant mass. This cut was found to not affect the shapes of the other discriminating variables. The difference between the data and the background prediction in this region was used as an estimate of the modelling uncertainty.
The result was cross-checked using simulated samples in which the renormalisation, factorisation and resummation scales, as well as the scale for matrix element and parton shower matching, were independently varied up and down by a factor of two. Within the statistical uncertainties resulting from the limited number
Figure 4. Minimum reconstructed lepton–jet invariant mass in the ¯tt control region. Data are compared to the background prediction. The ¯tt prediction is shown without the normalisation factor from thefit described in section6. The hatched bands show the total systematic uncertainty in the background prediction.
of events in these samples, the estimate from the data-driven approach was confirmed. The result is a 10% uncertainty in the DY+jets event yield in the control regions and 20% in eachmLQminbin in the signal region. • PDF uncertainties on thett¯and DY+jets normalisation as well as themLQminshape amount to less than 4% and
do not affect thefinal result given the large modelling uncertainties described above.
• The effects of higher-order contributions on the signal cross section were estimated by varying the QCD renormalisation and factorisation scales, set to a common value, up and down by a factor of two, as done in [9]. One half of the difference between the predicted cross section for the increased and reduced scale choice is
used as the cross section uncertainty for a given mass. This uncertainty lies in the the range 12%–17% for the mass points considered in this paper.
• The impact of theoretical uncertainties related to the parton-shower algorithm and multiple-interactions tune were evaluated by varying the corresponding parameters, as specified in [66]. This leads to an uncertainty in
signal acceptance of up to 2%.
• The uncertainty in the signal cross section due to the choice of PDF set was calculated as the envelope of the predictions of 40 different CTEQ6.6NLO error sets [9]. The uncertainty ranges from 11% at mLQ=500 GeV
to 34% at mLQ=1500 GeV. The predicted signal acceptance was studied using NNPDF23LO [28], CT14 [67]
and MMHT14[68] PDF sets. The acceptance is very insensitive to the choice of parton distribution function;
the systematic uncertainty from this source is less than 1%.
9. Results
The results are consistent with SM expectations. The normalisation factors obtained in thefit described in section6are summarised in table2. Similar results are obtained in the two channels and the normalisation factors are found to be compatible with unity within the uncertainties. The reliability of extrapolating the background predictions from the control regions to the signal region was checked in the VRs defined in
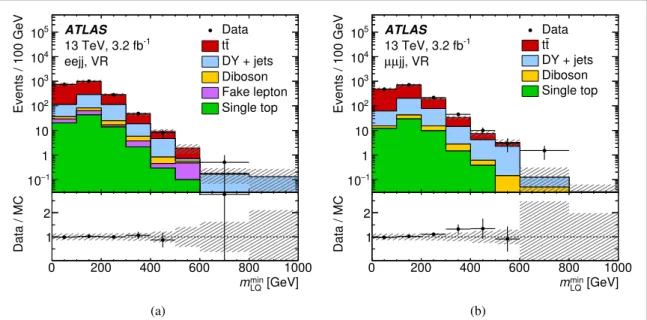
section6. The distribution ofmLQminin the two validation regions is compared to the background prediction after thefit in figure5. Within the uncertainties, the predictions are compatible with the observed data.
Table 2. Normalisation factors for the main backgrounds obtained from the combinedfit in each of the channels. Channel DY+jets tt¯ eejj 0.9±0.1 1.0±0.1
mmjj 0.9±0.1 1.0-+0.10.2
Figure 5. Minimum reconstructed lepton–jet invariant mass in the validation regions for pairs of (a) electrons and (b) muons. Data are compared to the background prediction. The DY+jets and ¯tt expectations are scaled by the normalisation factors obtained from the fit described in section6. The hatched bands show the total systematic uncertainty in the background prediction.
The observed and expected event yields in the signal regions for the eejj and the mmjj channels, after thefits, are shown in tables3and4, respectively. The values in these tables are intended to illustrate the sensitivity independent of a specific signal hypothesis and thus, in this case, the fit was performed using only the control regions as input. The resultingfit parameters (DY+jets andtt¯normalisation factors and values of the nuisance parameters) were transferred to the signal region, using appropriate transfer factors based on the MC models. The different contributions to the background do not necessarily exactly sum to the total quoted number of background events owing to the rounding scheme used. The dominant experimental systematic uncertainties in the background prediction arise from uncertainties on corrections to the simulated electron and muon trigger efficiencies and the JES; the latter source gives an uncertainty of 2%–4% in the signal region. The luminosity uncertainty of 5% contributes for simulated backgrounds not constrained by thefit (diboson and single-top production). The theoretical uncertainties after the fit range from 3% to 12% for the DY+jets background and from 3% to 16% for thett¯background. The globalfit takes correlations of the nuisance parameters into account, which results in the uncertainty in the total background being smaller than the quadratic sum of the
uncertainties in the separate components. The contribution ofZtt+jets to the background is negligible and not shown in the tables.
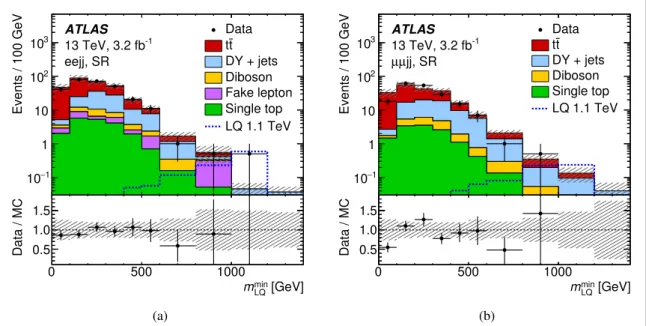
Figure6shows the SR distribution ofmLQmincompared to background predictions based on the combinedfit in the CRs and the SR. The signal prediction for a LQ of mass 1.1 TeV is also shown. The wider signal shape in the muon channel compared to the electron channel is due the worsening of the muon momentum resolution with increasing momentum. Again, no significant deviation from the SM predictions was observed. Limits on the LQ
Table 3. Observed and predicted event yields in the signal and control regions in theeejjchannel. The background prediction with its total uncertainty after thefit is shown. The fit is performed using only the control regions as input. The lower part of the table shows the separate contribu-tions from the different background processes and their total uncertainty after thefit. In addition, the expected signal event yields forb = 1and LQ masses of 500, 1000, and 1500 GeV are given.
SR CR DY+jets CR ¯tt
Observed events 279 20328 5194
Total background events 300±30 20300±200 5200±50 Fitted DY+jets events 74±7 19100±200 <0.01 Fitted ¯tt events 190±30 1060±10 4840±40 MC predicted diboson events 12.5±0.6 63±3 115±6 MC predicted single-top events 20±1 42±2 230±10 Estimated fake-lepton events 9±4 120±10 6±3 MC exp. signal events(mLQ=500 GeV) 1000±100 26±4 <0.01
MC exp. signal events(mLQ=1000 GeV) 13±2 0.03±0.00 <0.01
MC exp. signal events(mLQ=1500 GeV) 0.6±0.1 <0.01 <0.01
Table 4. Observed and predicted event yields in the signal and control regions in themmjjchannel. The background prediction with its total uncertainty after thefit is shown. The fit is performed using only the control regions as input. The lower part of the table shows the separate contribu-tions from the different background processes and their total uncertainty after thefit. Where no number is given, the contribution is found to be negligible. In addition, the expected signal event yields forb = 1and LQ masses of 500, 1000, and 1500 GeV are given.
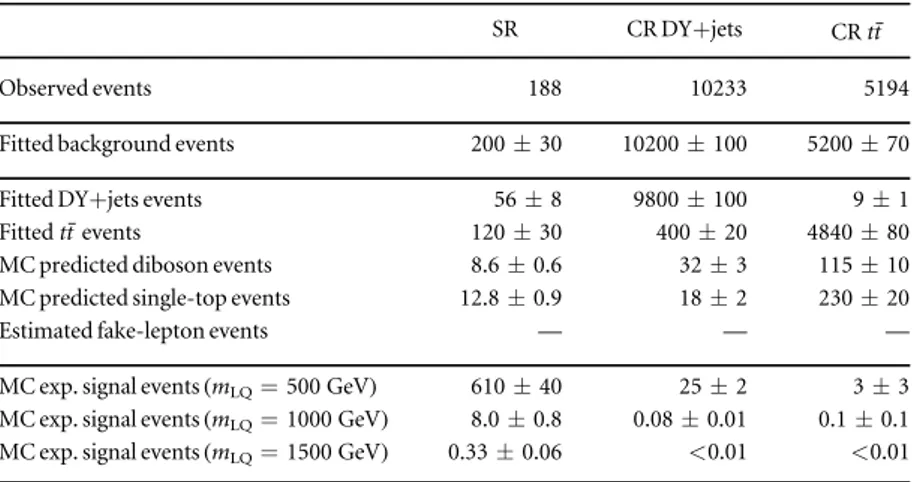
SR CR DY+jets CR ¯tt
Observed events 188 10233 5194
Fitted background events 200±30 10200±100 5200±70 Fitted DY+jets events 56±8 9800±100 9±1 Fitted ¯tt events 120±30 400±20 4840±80 MC predicted diboson events 8.6±0.6 32±3 115±10 MC predicted single-top events 12.8±0.9 18±2 230±20
Estimated fake-lepton events — — —
MC exp. signal events(mLQ=500 GeV) 610±40 25±2 3±3
MC exp. signal events(mLQ=1000 GeV) 8.0±0.8 0.08±0.01 0.1±0.1
signal strength were derived using pseudo-experiments and following a modified frequentistCLsmethod[69].
Apart from the luminosity uncertainty(5%), dominant uncertainties in the signal event yields arise from lepton scale factors and are of the order of 2%–5% at low masses and up to 10% at high masses.
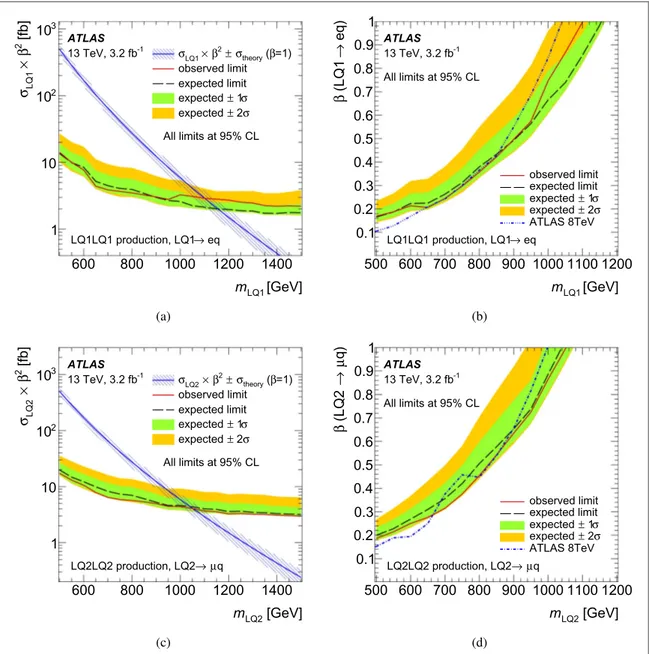
Infigure7, limits on the cross section times branching ratio are shown on the left, for leptoquarks of thefirst (second) generation in the top (bottom) plot. The expected limit is depicted by the dashed line; the uncertainty bands result from considering all sources of systematic as well as statistical uncertainties. The observed limit is given by the solid line. The NLO pair-production cross section forb = 1is shown as a line with a shaded band representing the uncertainties. The shaded band around it illustrates the uncertainties in the theoretical
prediction due to PDF and scale uncertainties. The intersection of this line with the cross-section limits yields the lower limit on the leptoquark mass for a value ofb = 1. These observed(expected) limits are found to be 1100 (1160 GeV) and 1050 GeV (1040 GeV) for first- and second-generation LQs, respectively. The observed limit for each channel is stronger than the previous bound[20] by 50 GeV. The expected limits are improved by 110 GeV
for thefirst-generation search and by 40 GeV in the second generation search. The theoretical cross section was scaled byb2and then used to obtain the limits on the branching ratio as a function of the LQ mass shown on the
right offigure7. Below LQ masses of 650 GeV, the limits onβ are weaker than those obtained at 8 TeV centre-of-mass energy, which are shown as the dashed–dotted line, owing to the much lower integrated luminosity collected in 2015 and the effects of background at lower LQ masses. At high masses(above 900GeV), however, the gain in the production cross section at 13 TeV compensates for the smaller luminosity and stronger bounds than at 8 TeV are obtained. In the intermediate mass region, the results are comparable. Mass limits for various values ofβ are summarised in table5.
10. Summary and conclusions
Searches forfirst- and second-generation scalar leptoquarks, pair-produced in pp collisions at 13 TeV centre-of-mass energy, have been performed with the ATLAS detector at the LHC. An integrated luminosity of 3.2f b−1of
data was used. No significant excess above the SM background expectation was observed in either channel. The results were interpreted in the framework of the mBRW model. Mass-dependent limits were derived on the pair-production cross section times the square of the branching ratio(b2) and on β. Forb = 1, the observed
(expected) LQ mass limits at 95% CL are 1100 and 1050 GeV (1160 and 1040 GeV) for first- and second-generation leptoquarks, respectively. The observed bounds are more stringent than the previous ATLAS limits by 50 GeV in each channel. This analysis is thefirst result at 13 TeV using the Run 2 data collected by the ATLAS experiment in a program of high precision inclusive searches for resonant signatures involving a lepton and a jet.
Figure 6. Distribution of the minimum reconstructed LQ candidate mass, mLQmin, in the signal region of(a) the first-generation
leptoquark search and(b) the second-generation search. Data are compared to the background prediction. The DY+jets and ¯tt expectations are scaled by the normalisation factors obtained from thefit described in section6. The signal expectation for a LQ of mass 1.1 TeV is also shown. The hatched bands show the total systematic uncertainty in the background prediction.
Acknowledgments
We thank CERN for the very successful operation of the LHC, as well as the support staff from our institutions without whom ATLAS could not be operated efficiently. We acknowledge the support of ANPCyT, Argentina;
Figure 7. The cross-section limits(a) on scalar LQ pair production times the square of the branching ratio as a function of mass and (b) limits on the branching ratio as a function of mass forfirst-generation leptoquarks. Analogous limits are shown for second-generation leptoquarks in(c) and (d). Expected and observed limits are also shown. The uncertainty bands on the expected limit represent all sources of systematic and statistical uncertainty. On the left, the expected NLO production cross section(β=1.0) for scalar leptoquark pair-production and its corresponding theoretical uncertainty due to the choice of PDF set and renormalisation/ factorisation scale are also included. The observed limit from the 8 TeV analysis is also shown on plots(b) and (d) [20].
Table 5. Expected and observed 95% CL lower limits onfirst- and second-generation leptoquark masses for different assumptions ofβ.
β 95% CL limit on
mLQ1(GeV) mLQ2(GeV)
Expected Observed Expected Observed
1.00 1160 1100 1040 1050
0.75 1050 1000 950 960
0.50 900 900 800 830
YerPhI, Armenia; ARC, Australia; BMWFW and FWF, Austria; ANAS, Azerbaijan; SSTC, Belarus; CNPq and FAPESP, Brazil; NSERC, NRC and CFI, Canada; CERN; CONICYT, Chile; CAS, MOST and NSFC, China; COLCIENCIAS, Colombia; MSMT CR, MPO CR and VSC CR, Czech Republic; DNRF and DNSRC, Denmark; IN2P3-CNRS, CEA-DSM/IRFU, France; GNSF, Georgia; BMBF, HGF, and MPG, Germany; GSRT, Greece; RGC, Hong Kong SAR, China; ISF, I-CORE and Benoziyo Center, Israel; INFN, Italy; MEXT and JSPS, Japan; CNRST, Morocco; FOM and NWO, Netherlands; RCN, Norway; MNiSW and NCN, Poland; FCT, Portugal; MNE/IFA, Romania; MES of Russia and NRC KI, Russian Federation; JINR; MESTD, Serbia; MSSR, Slovakia; ARRS and MIZŠ Slovenia; DST/NRF, South Africa; MINECO, Spain; SRC and Wallenberg Foundation, Sweden; SERI, SNSF and Cantons of Bern and Geneva, Switzerland; MOST, Taiwan; TAEK, Turkey; STFC, United Kingdom; DOE and NSF, United States of America. In addition, individual groups and members have received support from BCKDF, the Canada Council, CANARIE, CRC, Compute Canada, FQRNT, and the Ontario Innovation Trust, Canada; EPLANET, ERC, FP7, Horizon 2020 and Marie Skłodowska-Curie Actions, European Union; Investissements d’Avenir Labex and Idex, ANR, Région Auvergne and Fondation Partager le Savoir, France; DFG and AvH Foundation, Germany; Herakleitos, Thales and Aristeia programmes co-financed by EU-ESF and the Greek NSRF; BSF, GIF and Minerva, Israel; BRF, Norway; Generalitat de Catalunya, Generalitat Valenciana, Spain; the Royal Society and Leverhulme Trust, United Kingdom. The crucial computing support from all WLCG partners is acknowledged gratefully, in particular from CERN and the ATLAS Tier-1 facilities at TRIUMF(Canada), NDGF (Denmark, Norway, Sweden), CC-IN2P3 (France), KIT/ GridKA(Germany), INFN-CNAF (Italy), NL-T1 (Netherlands), PIC (Spain), ASGC (Taiwan), RAL (UK) and BNL(USA) and in the Tier-2 facilities worldwide.
References
[1] Dimopoulos S K and Susskind L 1979 Nucl. Phys. B155 237–52 [2] Dimopoulos S 1980 Technicoloured signatures Nucl. Phys. B168 69–92
[3] Eichten E and Lane K D 1980 Dynamical breaking of weak interaction symmetries Phys. Lett. B90 125–30 [4] Angelopoulos V D et al 1986 Search for new quarks suggested by the superstring Nucl. Phys. B292 59–92 [5] Buchmüller W and Wyler D 1986 Constraints on SU(5)-type leptoquarks Phys. Lett. B177 377–82 [6] Pati J C and Salam A 1974 Lepton number as the fourth color Phys. Rev. D10 275–89
Pati J C and Salam A 1975 Lepton number as the fourth color Phys. Rev. D11 703(erratum) [7] Georgi H and Glashow S 1974 Unity of all elementary particle forces Phys. Rev. Lett.32 438–41 [8] Schrempp B and Schrempp F 1985 Light leptoquarks Phys. Lett. B153 101
[9] Krämer M et al 2005 Pair production of scalar leptoquarks at the CERN LHC Phys. Rev. D71 057503 [10] Buchmüller W, Rückl R and Wyler D 1987 Leptoquarks in lepton–quark collisions Phys. Lett. B191 442–8
Buchmüller W, Rückl R and Wyler D 1999 Leptoquarks in lepton—quark collisions Phys. Lett. B 448 320 (erratum) [11] Olive K A et al 2014 Review of particle physics Chin. Phys. C38 090001
[12] CMS Collaboration 2011 Search for pair production of first-generation scalar leptoquarks in pp collisions at s =7 TeV Phys. Rev. Lett.106 201802
[13] CMS Collaboration 2011 Search for pair production of first-generation scalar leptoquarks in pp collisions at s =7 TeV Phys. Rev. Lett.106 201803
[14] ATLAS Collaboration 2011 Search for pair production of first or second generation leptoquarks in protonproton collisions at =
s 7 TeV using the ATLAS detector at the LHC Phys. Rev. D83 112006
[15] ATLAS Collaboration 2012 Search for first generation scalar leptoquarks in pp collisions at s =7 TeV with the ATLAS detector Phys. Lett. B709 158
[16] ATLAS Collaboration 2012 Search for second generation scalar leptoquarks in pp collisions at s =7 TeV with the ATLAS detector Eur. Phys. J. C72 2151
[17] CMS Collaboration 2012 Search for pair production of first- and second-generation scalar leptoquarks in pp collisions at s =7 TeV Phys. Rev. D86 052013
[18] CMS Collaboration 2013 Search for pair production of third-generation leptoquarks and top squarks in pp collisions at s =7 TeV Phys. Rev. Lett.110 081801
[19] ATLAS Collaboration 2013 Search for third generation scalar leptoquarks in pp collisions at s =7 TeV with the ATLAS detector J. High Energy Phys.JHEP06(2013)033
[20] ATLAS Collaboration 2016 Searches for scalar leptoquarks in pp collisions at s =8 TeV with the ATLAS detector Eur. Phys. J. C76 5 [21] CMS Collaboration 2016 Search for pair production of first and second generation leptoquarks in proton–proton collisions at
=
s 8 TeV Phys. Rev. D93 032004
[22] CMS Collaboration 2012 Search for third-generation leptoquarks and scalar bottom quarks in pp collisions at s =7 TeV J. High Energy Phys.JHEP12(2012)055
[23] CMS Collaboration 2014 Search for pair production of third-generation scalar leptoquarks and top squarks in proton–proton collisions at s=8 TeV Phys. Lett. B739 229
[24] CMS Collaboration 2015 Search for third-generation scalar leptoquarks in the tt channel in proton–proton collisions at s =8 TeV J. High Energy Phys.JHEP07(2015)042
[25] ATLAS Collaboration 2008 The ATLAS experiment at the CERN large hadron collider JINST3 S08003
[26] Sjöstrand T, Mrenna S and Skands P Z 2008 A brief introduction to PYTHIA 8.1 Comput. Phys. Commun.178 852–67
[27] ATLAS Collaboration 2014 ATLAS Pythia 8 tunes to 7 TeV data ATL-PHYS-PUB-2014-021 (http://cdsweb.cern.ch/record/1966419) [28] Ball R D et al 2013 Parton distributions with LHC data Nucl. Phys. B867 244–89
[29] Gleisberg T et al 2009 Event generation with SHERPA 1.1 J. High Energy Phys.JHEP02(2009)007
[31] Cascioli F, Maierhofer P and Pozzorini S 2012 Scattering amplitudes with open loops Phys. Rev. Lett.108 111601
[32] Schumann S and Krauss F 2008 A Parton shower algorithm based on Catani–Seymour dipole factorisation J. High Energy Phys.JHEP03 (2008)038
[33] Höche S et al 2013 QCD matrix elements + parton showers: the NLO case J. High Energy Phys.JHEP04(2013)027 [34] Lai H-L et al 2010 New parton distributions for collider physics Phys. Rev. D82 074024
[35] Nason P 2004 A New method for combining NLO QCD with shower Monte Carlo algorithms J. High Energy Phys.JHEP11(2004)040 [36] Frixione S, Nason P and Oleari C 2007 Matching NLO QCD computations with parton shower simulations: the POWHEG method
J. High Energy Phys.JHEP11(2007)070
[37] Alioli S et al 2010 A general framework for implementing NLO calculations in shower Monte Carlo programs: the POWHEG BOX J. High Energy Phys.JHEP06(2010)043
[38] Re E 2011 Single-top Wt-channel production matched with parton showers using the POWHEG method Eur. Phys. J. C71 1547 [39] Sjöstrand T, Mrenna S and Skands P Z 2006 PYTHIA 6.4 physics and manual J. High Energy Phys.JHEP05(2006)026
[40] Skands P Z 2010 Tuning monte carlo generators: the perugia tunes Phys. Rev. D82 074018
[41] Pumplin J et al 2002 New generation of parton distributions with uncertainties from global QCD analysis J. High Energy Phys.JHEP07 (2002)012
[42] Lange D J 2001 The EvtGen particle decay simulation package Nucl. Instrum. Meth. A462 152
[43] ATLAS Collaboration 2012 Summary of ATLAS Pythia 8 tunes ATL-PHYS-PUB-2012-003 (http://cds.cern.ch/record/1474107) [44] Martin A et al 2009 Parton distributions for the LHC Eur. Phys. J. C63 189
[45] ATLAS Collaboration 2010 The ATLAS simulation infrastructure Eur. Phys. J. C70 823 [46] Agostinelli S et al 2003 GEANT4: a simulation toolkit Nucl. Instrum. Meth. A506 250–303
[47] ATLAS Collaboration 2010 The simulation principle and performance of the ATLAS fast calorimeter simulation FastCaloSim ATL-PHYS-PUB-2010-013http://cds.cern.ch/record/1300517
[48] Frixione S et al 2008 Single-top hadroproduction in association with a W boson J. High Energy Phys.JHEP07(2008)029
[49] Czakon M and Mitov A 2014 Top++: a program for the calculation of the top-pair cross-section at hadron colliders Comput. Phys. Commun.185 2930
[50] ATLAS Collaboration 2014 Electron efficiency measurements with the ATLAS detector using the 2012 LHC proton–proton collision data ATLAS-CONF-2014-032(http://cdsweb.cern.ch/record/1706245)
[51] ATLAS Collaboration 2015 Electron efficiency measurements in 2015 data (http://atlas.web.cern.ch/Atlas/GROUPS/PHYSICS/ PLOTS/EGAM-2015-0 06/index.html)
[52] ATLAS Collaboration 2014 Measurement of the muon reconstruction performance of the ATLAS detector using 2011 and 2012 LHC proton–proton collision data Eur. Phys. J. C74 3130
[53] ATLAS Collaboration 2016 Muon reconstruction performance of the ATLAS detector in proton–proton collision data at s=13 TeV Eur. Phys. J. C 76 292
[54] Cacciari M, Salam G P and Soyez G 2008 Theanti k– tjet clustering algorithm J. High Energy Phys.JHEP04(2008)063
[55] ATLAS Collaboration 2016 Topological cell clustering in the ATLAS calorimeters and its performance in LHC Run 1 arXiv:1603. 02934
[56] ATLAS Collaboration 2015 Selection of jets produced in 13 TeV proton–proton collisions with the ATLAS detector ATLAS-CONF-2015-029(http://cdsweb.cern.ch/record/2037702)
[57] ATLAS Collaboration 2015 Jet energy measurement and its systematic uncertainty in proton–proton collisions at s=7 TeV with the ATLAS detector Eur. Phys. J. C75 17
[58] ATLAS Collaboration 2016 2015 start-up trigger menu and initial performance assessment of the ATLAS trigger using Run-2 data ATL-DAQ-PUB-2016-001(https://cds.cern.ch/record/2136007/)
[59] ATLAS Collaboration 2015 Muon reconstruction performance in early s =13 TeV data ATL-PHYS-PUB-2015-037 (http:// cdsweb.cern.ch/record/2047831)
[60] Cowan G et al 2011 Asymptotic formulae for likelihood-based tests of new physics Eur. Phys. J. C71 1554 Cowan G et al 2013 Asymptotic formulae for likelihood-based tests of new physics Eur. Phys. J. C73 2501(erratum) [61] Baak M et al 2015 HistFitter software framework for statistical data analysis Eur. Phys. J. C75 153
[62] ATLAS Collaboration 2014 Search for high-mass dilepton resonances in pp collisions at s =8 TeV with the ATLAS detector Phys. Rev. D90 052005
[63] ATLAS Collaboration 2013 Improved luminosity determination in pp collisions at s =7 TeV using the ATLAS detector at the LHC Eur. Phys. J. C73 2518
[64] Corcella G et al 2001 HERWIG 6: an event generator for hadron emission reactions with interfering gluons (including supersymmetric processes) J. High Energy Phys.JHEP01(2001)010
[65] Alwall J et al 2014 The automated computation of tree-level and next-to-leading order differential cross sections, and their matching to parton shower simulations J. High Energy Phys.JHEP07(2014)079
[66] ATLAS Collaboration 2011 Further ATLAS tunes of Pythia 6 and Pythia 8 ATL-PHYS-PUB-2011-014 (http://cds.cern.ch/record/ 1400677)
[67] Dulat S et al 2016 New parton distribution functions from a global analysis of quantum chromodynamics Phys. Rev. D93 033006 [68] Harland-Lang L A et al 2015 Parton distributions in the LHC era: MMHT 2014 PDFs Eur. Phys. J. C75 204
[69] Read A L 2002 Presentation of search results: the CLs technique J. Phys. G: Nucl. Part. Phys.28 2693
The ATLAS Collaboration M Aaboud136d , G Aad87 , B Abbott114 , J Abdallah65 , O Abdinov12 , B Abeloos118 , R Aben108 , O S AbouZeid138 , N L Abraham150 , H Abramowicz154 , H Abreu153 , R Abreu117 , Y Abulaiti147a,147b , B S Acharya164a,164b,179 , L Adamczyk40a , D L Adams27 , J Adelman109 , S Adomeit101 , T Adye132 , A A Affolder76 , T Agatonovic-Jovin14 , J Agricola56 , J A Aguilar-Saavedra127a,127f , S P Ahlen24 , F Ahmadov67,180 , G Aielli134a,134b , H Akerstedt147a,147b , T P A Åkesson83 , A V Akimov97 , G L Alberghi22a,22b , J Albert169 , S Albrand57, M J AlconadaVerzini73 , M Aleksa32, I N Aleksandrov67, C Alexa28b, G Alexander154, T Alexopoulos10, M Alhroob114, M Aliev75a,75b,
A Alonso38, F Alonso73, C Alpigiani139, M Alstaty87, B AlvarezGonzalez32, D ÁlvarezPiqueras167,
M G Alviggi105a,105b, B T Amadio16, K Amako68, Y AmaralCoutinho26a, C Amelung25, D Amidei91,
S P AmorDosSantos127a,127c, A Amorim127a,127b, S Amoroso32, G Amundsen25, C Anastopoulos140, L S Ancu51,
N Andari109, T Andeen11, C F Anders60b, G Anders32, J K Anders76, K J Anderson33, A Andreazza93a,93b,
V Andrei60a, S Angelidakis9, I Angelozzi108, P Anger46, A Angerami37, F Anghinolfi32, A V Anisenkov110,181,
N Anjos13, A Annovi125a,125b, M Antonelli49, A Antonov99, F Anulli133a, M Aoki68, L AperioBella19,
G Arabidze92, Y Arai68, J P Araque127a, A T H Arce47, F A Arduh73, J-F Arguin96, S Argyropoulos65, M Arik20a,
A J Armbruster144, L J Armitage78, O Arnaez32, H Arnold50, M Arratia30, O Arslan23, A Artamonov98,
G Artoni121 , S Artz85 , S Asai156 , N Asbah44 , A Ashkenazi154 , B Åsman147a,147b , L Asquith150 , K Assamagan27 , R Astalos145a , M Atkinson166 , N B Atlay142 , K Augsten129 , G Avolio32 , B Axen16 , M K Ayoub118 , G Azuelos96,182 , M A Baak32 , A E Baas60a , M J Baca19 , H Bachacou137 , K Bachas75a,75b , M Backes32 , M Backhaus32 , P Bagiacchi133a,133b , P Bagnaia133a,133b , Y Bai35a , J T Baines132 , O K Baker176 , E M Baldin110,181 , P Balek130 , T Balestri149 , F Balli137 , W K Balunas123 , E Banas41 , Sw Banerjee173,183 , A A E Bannoura175 , L Barak32 , E L Barberio90 , D Barberis52a,52b , M Barbero87 , T Barillari102 , T Barklow144 , N Barlow30 , S L Barnes86 ,
B M Barnett132, R M Barnett16, Z Barnovska5, A Baroncelli135a, G Barone25, A J Barr121, L BarrancoNavarro167,
F Barreiro84, J BarreiroGuimarãesdaCosta35a, R Bartoldus144, A E Barton74, P Bartos145a, A Basalaev124,
A Bassalat118, R L Bates55, S J Batista159, J R Batley30, M Battaglia138, M Bauce133a,133b, F Bauer137, H S Bawa144,184,
J B Beacham112, M D Beattie74, T Beau82, P H Beauchemin162, P Bechtle23, H P Beck18,185, K Becker121,
M Becker85, M Beckingham170, C Becot111, A J Beddall20e, A Beddall20b, V A Bednyakov67, M Bedognetti108,
C P Bee149, L J Beemster108, T A Beermann32, M Begel27, J K Behr44, C Belanger-Champagne89, A S Bell80,
G Bella154, L Bellagamba22a, A Bellerive31, M Bellomo88, K Belotskiy99, O Beltramello32, N L Belyaev99,
O Benary154, D Benchekroun136a, M Bender101, K Bendtz147a,147b, N Benekos10, Y Benhammou154,
E BenharNoccioli176, J Benitez65, D P Benjamin47, J R Bensinger25, S Bentvelsen108, L Beresford121,
M Beretta49 , D Berge108, E BergeaasKuutmann165 , N Berger5 , J Beringer16 , S Berlendis57 , N R Bernard88 , C Bernius111 , F U Bernlochner23 , T Berry79 , P Berta130 , C Bertella85 , G Bertoli147a,147b , F Bertolucci125a,125b , I A Bertram74 , C Bertsche44 , D Bertsche114
, G J Besjes38, O BessidskaiaBylund147a,147b
, M Bessner44 , N Besson137 , C Betancourt50 , S Bethke102 , A J Bevan78 , W Bhimji16 , R M Bianchi126 , L Bianchini25 , M Bianco32 , O Biebel101 , D Biedermann17 , R Bielski86 , N V Biesuz125a,125b
, M Biglietti135a, J BilbaoDeMendizabal51
, H Bilokon49 , M Bindi56 , S Binet118 , A Bingul20b , C Bini133a,133b , S Biondi22a,22b , D M Bjergaard47 , C W Black151 , J E Black144, K M Black24, D Blackburn139, R E Blair6, J-B Blanchard137, J E Blanco79, T Blazek145a, I Bloch44,
C Blocker25, W Blum85,224, U Blumenschein56, S Blunier34a, G J Bobbink108, V S Bobrovnikov110,181,
S S Bocchetta83, A Bocci47, C Bock101, M Boehler50, D Boerner175, J A Bogaerts32, D Bogavac14,
A G Bogdanchikov110, C Bohm147a, V Boisvert79, P Bokan14, T Bold40a, A S Boldyrev164a,164c, M Bomben82,
M Bona78, M Boonekamp137, A Borisov131, G Borissov74, J Bortfeldt101, D Bortoletto121, V Bortolotto62a,62b,62c,
K Bos108, D Boscherini22a, M Bosman13, J D BossioSola29, J Boudreau126, J Bouffard2, E V Bouhova-Thacker74,
D Boumediene36, C Bourdarios118, S K Boutle55, A Boveia32, J Boyd32, I R Boyko67, J Bracinik19, A Brandt8,
G Brandt56, O Brandt60a, U Bratzler157, B Brau88, J E Brau117, H M Braun175,224, W D BreadenMadden55,
K Brendlinger123 , A J Brennan90 , L Brenner108 , R Brenner165 , S Bressler172 , T M Bristow48 , D Britton55 , D Britzger44 , F M Brochu30 , I Brock23 , R Brock92 , G Brooijmans37 , T Brooks79 , W K Brooks34b , J Brosamer16 , E Brost117 , J H Broughton19, P A BruckmandeRenstrom41 , D Bruncko145b , R Bruneliere50 , A Bruni22a , G Bruni22a , L S Bruni108 , B H Brunt30 , M Bruschi22a , N Bruscino23 , P Bryant33 , L Bryngemark83 , T Buanes15 , Q Buat143 , P Buchholz142 , A G Buckley55 , I A Budagov67 , F Buehrer50 , M K Bugge120 , O Bulekov99 , D Bullock8 , H Burckhart32 , S Burdin76 , C D Burgard50 , B Burghgrave109 , K Burka41 , S Burke132 , I Burmeister45 , E Busato36 , D Büscher50, V Büscher85, P Bussey55, J M Butler24, C M Buttar55, J M Butterworth80, P Butti108, W Buttinger27,
A Buzatu55, A R Buzykaev110,181, S CabreraUrbán167, D Caforio129, V M Cairo39a,39b, O Cakir4a, N Calace51,
P Calafiura16, A Calandri87, G Calderini82, P Calfayan101, L P Caloba26a, D Calvet36, S Calvet36, T P Calvet87,
R CamachoToro33, S Camarda32, P Camarri134a,134b, D Cameron120, R CaminalArmadans166, C Camincher57,
S Campana32, M Campanelli80, A Camplani93a,93b, A Campoverde142, V Canale105a,105b, A Canepa160a,
M CanoBret35e,35f, J Cantero115, R Cantrill127a, T Cao42, M D M CapeansGarrido32, I Caprini28b, M Caprini28b,
M Capua39a,39b, R Caputo85, R M Carbone37, R Cardarelli134a, F Cardillo50, I Carli130, T Carli32, G Carlino105a,
L Carminati93a,93b, S Caron107, E Carquin34b, G D Carrillo-Montoya32, J R Carter30, J Carvalho127a,127c,
D Casadei19, M P Casado13,186, M Casolino13, D W Casper163, E Castaneda-Miranda146a, R Castelijn108,
A Castelli108, V CastilloGimenez167 , N F Castro127a,187 , A Catinaccio32 , J R Catmore120 , A Cattai32 , J Caudron85 , V Cavaliere166 , E Cavallaro13 , D Cavalli93a , M Cavalli-Sforza13 , V Cavasinni125a,125b , F Ceradini135a,135b , L CerdaAlberich167 , B C Cerio47 , A S Cerqueira26b , A Cerri150 , L Cerrito78 , F Cerutti16 , M Cerv32 , A Cervelli18 , S A Cetin20d , A Chafaq136a , D Chakraborty109 , S K Chan59 , Y L Chan62a , P Chang166 , J D Chapman30 , D G Charlton19 , A Chatterjee51 , C C Chau159, C A ChavezBarajas150 , S Che112 , S Cheatham74 , A Chegwidden92 , S Chekanov6 , S V Chekulaev160a , G A Chelkov67,188 , M A Chelstowska91 , C Chen66 , H Chen27 , K Chen149 , S Chen35c , S Chen156 , X Chen35g , Y Chen69 , H C Cheng91 , H J Cheng35a , Y Cheng33 , A Cheplakov67 ,
E Cheremushkina131, R CherkaouiElMoursli136e, V Chernyatin27,224, E Cheu7, L Chevalier137, V Chiarella49,