JHEP02(2016)110
Published for SISSA by Springer Received: October 12, 2015 Revised: January 18, 2016 Accepted: January 28, 2016 Published: February 17, 2016
Search for the production of single vector-like and
excited quarks in the W t final state in pp collisions at
√
s = 8 TeV with the ATLAS detector
The ATLAS collaboration
E-mail: atlas.publications@cern.ch
Abstract: A search for vector-like quarks and excited quarks in events containing a
top quark and a W boson in the final state is reported here. The search is based on
20.3 fb−1 of proton-proton collision data taken at the LHC at a centre-of-mass energy of
8 TeV recorded by the ATLAS detector. Events with one or two leptons, and one, two or three jets are selected with the additional requirement that at least one jet contains a b-quark. Single-lepton events are also required to contain at least one large-radius jet from
the hadronic decay of a high-pT W boson or a top quark. No significant excess over the
expected background is observed and upper limits on the cross-section times branching ratio for different vector-like quark and excited-quark model masses are derived. For the
excited-quark production and decay to W t with unit couplings, quarks with masses below
1500 GeV are excluded and coupling-dependent limits are set.
Keywords: Exotics, Hadron-Hadron scattering
JHEP02(2016)110
Contents
1 Introduction 1
2 ATLAS detector 4
3 Data and simulated samples 5
4 Event selection and background estimation 6
4.1 Object reconstruction 6
4.2 Single-lepton event selection and background estimation 8
4.3 Dilepton event selection and background estimation 11
5 Systematic uncertainties 14
5.1 Experimental uncertainties 14
5.2 Modelling of theoretical uncertainties 17
6 Statistical analysis and results 19
7 Conclusion 21
The ATLAS collaboration 29
1 Introduction
The number of quark generations known within the Standard Model (SM) is three and the existence of additional heavy quarks similar to those in the SM is strongly constrained by
the discovery of the Higgs boson at the Large Hadron Collider (LHC) [1–3]. Additional
quarks that have non-SM Higgs couplings, in particular vector-like quarks (VLQs), remain
popular, especially in models which address the naturalness question [4, 5]. New quarks
can have right and left handed couplings to the W boson and are color triplets [6]. VLQs
appear in several extensions of the SM, such as extra dimensions [7], supersymmetry [8],
composite Higgs [9,10] and little Higgs [11] models, in which they cancel top-quark loop
contributions to the Higgs mass [12]. Depending on the model, VLQs can be realized in
different multiplets, such as in singlets, doublets and triplets [13].
This paper describes a search for singly produced vector-like quarks with charge ±1
3
of the elementary charge, e. Two models are considered: the single production of a VLQ
via the t-channel exchange of a Z boson in a composite Higgs model [10, 14] (called B),
and the single production of a VLQ that also has excited-quark couplings [15] (called b∗).
Only final states in which the B or b∗ decay into Wt are considered. The corresponding
JHEP02(2016)110
b q Z B q t W λ (a)b
g
b
∗t
W
f
g (b)Figure 1. Leading-order Feynman diagrams for the production and decay of(a)a singleB together with a light quark and(b)a singleb∗.
mB [ GeV] σ× BR(B → Wt) [fb] λ = 2 λ = 3 400 710 — 600 220 250 800 52 97 1000 15 30 1200 4.8 10.2 1400 1.7 3.6
Table 1. Cross-section times branching ratio for pp → Bq → Wt for different B masses and coupling valuesλ at a centre-of-mass energy of√s = 8 TeV [10,14]. Forλ· v/√2> mB− mb with
the vacuum-expectation value v and the mass of the b-quark mb one gets an unphysical b-quark
mass. This is denoted in the table by “—”.
The cross-section for singlet B production is proportional to the square of the bZB
coupling strength λ. The production via Higgs-boson exchange is also possible, although
the Z-induced process is dominant. The B can decay into Zb, Hb and Wt with the
branching ratios given by the VLQ couplings1 for singlet B. The light quark in the final
state gives rise to a forward jet. The cross-section for singletB production with subsequent
decay to Wt has been calculated in the TS-10 model [10,14], a four-dimensional version
of a model with composite fermions in a 10 representation of SO(5). The cross-section
is given in table 1 for two values of the coupling parameter λ, for which the 2× 2 mass
mixing matrix of the b-quark and the B has been diagonalised. The largest value of λ for
which theB decay width is still smaller than the experimental mass resolution is λ = 3. A
top-quark mass of 172.5 GeV is assumed throughout.
In addition to the Zb, Hb and Wt couplings, the b∗ also has a chromomagnetic
cou-pling fg to a gluon and a b-quark [15–17], making it both a vector-like quark and an
excited quark [18]. Complete models of VLQs usually contain other particles and
interac-tions which result in an effective chromomagnetic coupling. Examples of such models are
JHEP02(2016)110
mb∗[ GeV] σ× BR(b∗ → Wt) [fb] fL(R)= 1,fR(L) = 0 fL =fR= 1 400 115× 103 196× 103 600 18.3× 10³ 35× 103 800 3.9× 10³ 7.5× 10³ 1000 1.0× 10³ 2.0× 10³ 1200 310 610 1400 110 210 1800 16 30Table 2. Cross-section times branching ratio for b∗
→ Wt for different b∗ masses and b∗Wt
couplings [15] at a centre-of-mass energy√s = 8 TeV. Here fg= 1 is assumed.
technicolour [19,20], topcolour [21,22], extra dimension models [23,24] or models with a heavy partner of the gluon [25], which gives rise to the effective gb coupling. The strength
of the coupling is assumed to be fg= 1 in this paper unless otherwise indicated. The b∗ in
the VLQ case has fL =fR = 1, but it is also allowed to have purely left-handed (fL= 1,
fR = 0) or purely right-handed (fL = 0, fR = 1) couplings to the top quark. The
cross-sections times branching ratios for the production of b∗ with decay to Wt for these three
coupling scenarios are given in table 2. For purely left-handed couplings the cross-sections are the same as those for purely right-handed couplings. However, for VLQ-like couplings the cross-sections are not exactly the sum of the individual contributions since setting both
couplings to 1 modifies the b∗ decay branching ratios. In the following, fL = fR = 1 is
assumed unless stated otherwise.
After the decay of B/b∗ into Wt, the top quark decays into a b-quark and another
W boson. At least one of the W bosons is required to decay leptonically (to an electron or muon, and the corresponding neutrino). Events are separated into dilepton and
single-lepton signatures. A hadronically decayingW boson or top quark is identified by clustering
its decay products into a single jet since for highB/b∗ masses theW boson and top quark
are boosted. The clustering requirement is the main change in the analysis strategy for
the single-lepton channel compared to the search for single-b∗ production in the complete
7 TeV LHC dataset collected by ATLAS [26]. It increases the sensitivity to high B and b∗
masses, where the top quark andW boson have large transverse momentum.
Searches for a VLQ with charge ±13e have also been performed by ATLAS in final
states with Z-bosons using data at √s = 8 TeV, and exploiting both pair production and
single production and resulted in limits in the range 685 to 755 GeV [27]. Searches for
pair production of VLQs, assuming strong interactions similar to those in the SM, have
also been performed by ATLAS [28–30] in data at √s = 8 TeV and by CMS [31, 32] at
√
s = 7 TeV, and resulted in limits in the ranges 760 to 900 GeV and 625 to 675 GeV, respectively. Recently, the CMS collaboration set lower limits on pair-produced vector-like B quark mass in the range 740 to 900 GeV, for different combinations of the B quark
branching fractions [33] and on left-handed, right-handed, and vector-like b∗ quark masses
JHEP02(2016)110
forb∗ has been performed by ATLAS with the full 7 TeV LHC dataset and a limit on the
b∗ mass for couplings fg = fL =fR = 1 was set at 1.03 TeV [26]. All limits are given at
95% credibility level (CL). This search for the single production of B → Wt is the first for
a B in this final state and using the novelty approach for boosted event topologies. While
searches for pair production currently dominate the limits, single production becomes more competitive for higher quark masses, due to the reduced kinematic phase-space constraints and the larger dataset.
In the analysis presented here, six different single-lepton and dilepton signal regions (SR) are defined, which were optimised to maximise the expected significance for the
B/b∗ models considered. This analysis is also complementary to the search of dijet mass
resonances in ATLAS with data at √s = 8 TeV, which probes the qg final state [35]. The
main processes contributing to the background after applying all selection cuts are from
top-quark pair (t¯t) production and single top-quark production in association with a W boson.
Other background contributions are from W - or Z-boson production in association with
jets. Smaller contributions arise from diboson production processes and processes where
a jet is misidentified as a lepton. To estimate these SM backgrounds in a consistent
and robust fashion, corresponding control regions (CR) are defined for each of the signal regions. They are chosen to be non-overlapping with the SR selections in order to provide independent data samples enriched in particular background sources. The shape of the discriminating variable, the invariant mass for the single-lepton channel and transverse mass for the dilepton channel, is used in a binned likelihood fit to test for the presence of a signal. The systematic uncertainties and the MC statistical uncertainties on the expected values are included in the fit as nuisance parameters. These additional degrees of freedom allow the modelling of the backgrounds to be improved based on data, increasing the sensitivity to the signal. Correlations of a given nuisance parameter across the various regions, between the various backgrounds, and possibly the signal, are also taken into account. A background-only fit is used to determine the compatibility of the observed event yield in each SR with the corresponding SM background expectation. The improved post-fit model resulting from this fit is used throughout this paper for the presentation of control distributions. The observed and expected upper limits at 95% CL on the number of events from VLQ phenomena for each signal region are derived using a Bayesian approach.
2 ATLAS detector
The ATLAS experiment [36] at the LHC is a multi-purpose particle detector with a
forward-backward symmetric cylindrical geometry and a near 4π coverage in solid angle.2 It consists
of an inner tracking detector surrounded by a thin superconducting solenoid providing a 2 T axial magnetic field, electromagnetic (EM) and hadron calorimeters, and a muon
spec-2
ATLAS uses a right-handed coordinate system with its origin at the nominal interaction point (IP) in the centre of the detector and the z-axis along the beam pipe. The x-axis points from the IP to the centre of the LHC ring, and the y-axis points upwards. Cylindrical coordinates (r, φ) are used in the transverse plane, φ being the azimuthal angle around the z-axis. The pseudorapidity is defined in terms of the polar angle θ as η = − ln tan(θ/2). Angular distance is measured in units of ∆R ≡p(∆η)2+ (∆φ)2.
JHEP02(2016)110
trometer. The inner tracking detector covers the pseudorapidity range|η| < 2.5. It consists of silicon pixel, silicon microstrip, and transition radiation tracking detectors. Lead/liquid-argon (LAr) sampling calorimeters provide electromagnetic energy measurements with high granularity. A hadronic (iron/scintillator-tile) calorimeter covers the central pseudorapidity
range (|η| < 1.7). The end-cap and forward regions are instrumented with LAr calorimeters
for both the EM and hadronic energy measurements up to |η| = 4.9. The muon
spectrom-eter surrounds the calorimspectrom-eters and is based on three large air-core toroid superconducting magnets with eight coils each. It includes a system of precision tracking chambers up to |η| = 2.7 and fast detectors for triggering at |η| < 2.4. A three-level trigger system is used to select events of interest. The first-level trigger is implemented in hardware and uses a subset of the detector information, while the other two levels are software-based, and the last trigger level uses the full detector information.
3 Data and simulated samples
The dataset used for this analysis was collected in 2012 by the ATLAS detector at the
LHC, and corresponds to an integrated luminosity of 20.3 fb−1 of proton-proton collisions
at a centre-of-mass energy √s = 8 TeV. Events are required to have passed at least a
single-electron or single-muon trigger. The electron and muon triggers impose a transverse
momentum (pT) threshold of 24 GeV along with isolation requirements on the lepton. To
recover efficiency for higher-pT leptons, the isolated-lepton triggers are complemented by
triggers without isolation requirements but with a higherpT threshold of 60 GeV (36 GeV)
for electrons (muons).
Events are accepted if they contain at least one reconstructed primary vertex (PV).
A reconstructed PV candidate is required to have at least five associated tracks of pT >
400 MeV, consistent with originating from the beam collision region in the x-y plane.
The PV is chosen as the vertex candidate with the largest sum of the squared transverse momenta of its associated tracks among all candidates.
The B signal is simulated with Protos v2.2 [6], interfaced to Pythia v6.4 [37] for
hadronisation and underlying events. The MSTW2008nlo68cl [38,39] parton
distribu-tion funcdistribu-tion (PDF) set is used. The producdistribu-tion kinematics and decay properties do not
depend on the couplingλ. The b∗signal is simulated at LO in QCD with the matrix-element
generator MadGraph5 v1.5.12 [40] and interfaced to Pythia v8.175 [41] for
hadronisa-tion. The MSTW2008nlo68cl PDF set is used. The couplings are set to fg = fL = 1,
fR = 0 for the left-handed samples, and fg = fR = 1, fL = 0 for the right-handed ones.
For both signal models, samples are generated with the mass of the new quark set to values
from 400 GeV to 1800 GeV. The Protos B sample is generated by the diagram gq→ Bbq
and the factorisation and renormalisation scales are set dynamically to the square of the
momentum transfer of the virtual Z boson for the light quark line and to the pT of the
extrab-quark for the gluon splitting line. In the MadGraph5 samples, the scales are set
to the mass of the generated resonance particle. Since for most of the analysis presented
here it is assumed that fL = fR = 1, left- and right-handed samples are added together
JHEP02(2016)110
Top-quark pair and single top-quark events in the t, s and Wt channels are simulated
using the next-to-leading-order (NLO) generator Powheg-Box v1 r2129, v1 r1556 and
v1 r2092, respectively [42, 43]. The CT10 [44] PDF set is used and Pythia v6.4 [37]
performs the hadronisation. The top-quark background samples are initially normalised to their theory predictions. The t¯t predicted cross-section is σt¯t = 253+13−15 pb, computed at to-leading-order (NNLO) in QCD, including resummation of
next-to-next-to-leading logarithmic (NNLL) soft gluon terms with top++2.0 [45–51]. The single-top
predicted cross-sections are σt= 87.8+3.4−1.9 pb [52] and σWt= 22.4± 1.5 pb [53], computed at NLO with NNLL corrections.
The Alpgen v2.14 LO generator [54], interfaced to Pythia v6.4, is used to generate
W +jets and Z+jets events, with the CTEQ6L1 [55] PDF set. A parton-jet matching
scheme is employed to avoid double-counting of partonic configurations generated by both
the matrix-element calculation and the parton shower [56]. The samples are generated
separately for W/Z with light-quark jets (W +light-jets, Z+light-jets) and heavy-quark
jets (W bb+jets, W cc+jets, W c+jets, Zbb+jets, Zcc+jets). Overlap between the events in samples with heavy quarks generated from the matrix-element calculation and those generated from parton-shower evolution in the samples with light-quark jets is avoided
via an algorithm based on the angular separation between the extra heavy quarks, Q:
if ∆R(Q, Q0) > 0.4, the matrix-element prediction is used, otherwise the parton-shower
prediction is used. Diboson events (W W , W Z, ZZ) are generated with Alpgen interfaced
to Herwig v6.52 [57] for hadronisation and Jimmy v4.31 [58] for the modelling of the
underlying event, with the CTEQ6L1 PDF set.
After event generation, most signal and all background samples are passed through
the full simulation of the ATLAS detector [59] based on GEANT4 [60] and reconstructed
using the same procedure as for collision data. A faster simulation [61] is used for the signal samples in the dilepton selection and for samples selected to assess systematic uncertainties. All samples are simulated with additional proton-proton interactions in the same bunch crossing (”pile-up”) and reweighted to have the same distribution of the mean number of interactions per bunch-crossing as the data.
4 Event selection and background estimation
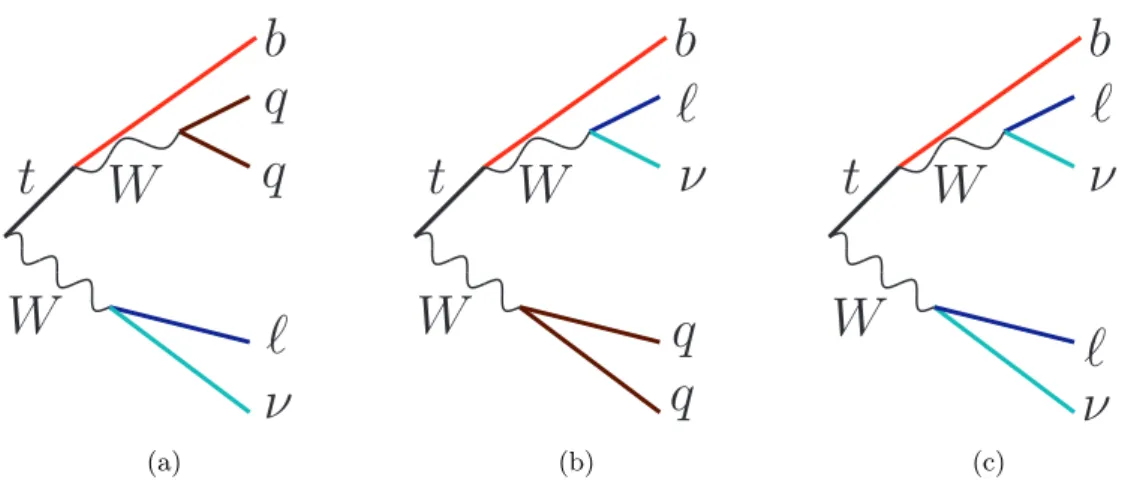
Two types of events are selected: those in which the prompt W boson and the one from
the top quark both decay leptonically (dilepton final state), and those in which only one W boson decays leptonically and the other one decays hadronically (lepton+jets final state).
Only electrons and muons are considered for the leptonicW decay. The events are separated
into orthogonal categories based on the decay signature of the twoW bosons, as illustrated
in figure 2. Full details of the methods used to assign events to the categories shown in
figure 2(a)and 2(b)are given below.
4.1 Object reconstruction
Electron candidates are reconstructed from energy clusters in the EM calorimeter and matched to tracks in the inner detector. Selected electrons must have a transverse
en-JHEP02(2016)110
ℓ
ν
W
t
b
q
q
W
(a)ℓ
ν
W
t
b
q
q
W
(b)ℓ
ν
W
t
b
ℓ
ν
W
(c)Figure 2. Final-state categories: (a) one lepton and a hadronic top-quark decay, (b) one lepton and a hadronicW -boson decay and(c)dilepton.
ergy ET =Ecluster/ cosh(ηtrack)> 25 GeV and |ηcluster| < 2.47, where Ecluster and ηcluster
indicate the electromagnetic cluster energy and pseudorapidity, respectively, andηtrack the
track pseudorapidity [62]. A veto is placed on electrons in the transition region between
the barrel and end-cap calorimeter, 1.37 <|ηcluster| < 1.52. The electron track is required
to originate less than 2 mm along the z-axis (longitudinal impact parameter) from the
se-lected event primary vertex. The three main sources of background for high-ET isolated
electrons are hadrons misidentified as electrons, photon conversions and electrons originat-ing from secondary vertices in decays of heavy-flavour hadrons (non-prompt electrons). In order to suppress the background from these sources, it is required that there is little calo-rimeter activity in the region surrounding the electron candidate. Two isolation variables are defined for this purpose: the energy deposited around the electron candidate in the calorimeter with a cone size of ∆R = 0.2, and the sum of the transverse momenta of all tracks in a cone of size ∆R = 0.3 around the electron candidate. Efficiencies and purities of the identification and isolation requirements are corrected with appropriate scale factors
to match the simulation to the data. They depend on the η and the ET of the electron.
Muon candidates are reconstructed by matching muon spectrometer hits to inner-detector tracks, using the complete track information from both inner-detectors and accounting for scattering and energy loss in the ATLAS detector material. Selected muons have a
transverse momentum greater than 25 GeV and a pseudorapidity of |η| < 2.5. The muon
track longitudinal impact parameter with respect to the primary vertex is required to be less than 2 mm. Isolation criteria are applied in order to reduce background contamination from events in which a muon is produced at a secondary vertex in the decay of a
heavy-flavour quark (non-prompt muon). The ratio of the summed pT of tracks within a cone of
variable size ∆R = 10 GeV/pµT to thepT of the muon is required to be less than 0.05 [63]. Efficiencies and purities of the identification and isolation requirements are corrected with
appropriate scale factors to match the simulation to the data; they depend on η and φ of
the muon.
Jets are reconstructed using the anti-ktalgorithm [64], applied to clusters of calorimeter
JHEP02(2016)110
using a local calibration scheme [66]. Jet energies are calibrated using energy- and
η-dependent correction factors derived from simulation, and with residual corrections from
in-situ measurements [67]. Events with jets built from noisy calorimeter cells or
non-collision background processes are removed [68].
In this paper jets reconstructed with two different radius parameters are used. Small-R jets (also denoted simply by “jets” orj4) have a radius parameter of 0.4 and are required to havepT> 25 GeV and|η| < 4.5. Small-R jets from additional simultaneous pp interactions
are rejected by an additional requirement: the ratio of the scalar sum of the pT of tracks
associated with the jet and the primary vertex to the scalar sum of the pT of all tracks
associated with the jet must be at least 0.5 for jets with pT < 50 GeV and |η| < 2.4.
Large-R jets (j10) have a radius parameter of 1.0 [68] and are subject to a trimming
procedure [69] to minimise the impact of energy depositions from pile-up interactions.
The trimming algorithm reconstructs constituent jets with the kt algorithm [70–72] with a radius parameter of 0.3 from the clusters belonging to the original large-R jet. Constituent
jets contributing less than 5% of the large-R jet pT are removed. The remaining energy
depositions are used to calculate the kinematic and substructure properties of the large-R jet. The masses of the large-R jets (mj10) are calibrated to their particle-level values [67,
73,74]. In the analysis, large-R jets are required to have pT> 200 GeV and |η| < 2.0. Since the reconstruction of jets and electrons is partially based on the same energy clusters, the closest small-R jet overlapping with electron candidates within a cone of size ∆R = 0.2 is removed. Since electrons from prompt W -boson decays should be isolated from jet activity, electrons that are still within less than ∆R = 0.4 of a jet are removed. Similarly, prompt muons should be isolated from jet activity, so that beside the muon-isolation criteria above, selected muons must not overlap with a reconstructed jet within a radius of size ∆R = 0.4.
Small-R jets containing b-quarks (b-quark jets) from the top-quark decay are identified
using a combination of multivariate algorithms (b-tagging) [75]. These algorithms exploit
the long lifetime of B hadrons and the properties of the resulting displaced and
recon-structed secondary vertex. The working point of the algorithm is chosen such thatb-quark
jets in simulated t¯t events are tagged with an average efficiency of 70% and a rejection
factor for light-flavour jets of ∼ 100.
The missing transverse momentum vector, ~Emiss
T , is calculated as the negative vector
sum over all the calorimeter cells in the event, and is further refined by applying object-level corrections for the contributions which arise from identified photons, leptons and jets [76].
In the analysis the magnitude, Emiss
T , of the missing transverse momentum vector is used.
4.2 Single-lepton event selection and background estimation
In the single-lepton final state, the selected events have exactly one isolated lepton (electron
or muon) and exactly two or three small-R central jets (|η| < 2.5), exactly one of which
is b-tagged. Events with two jets are included in order to select events where the two
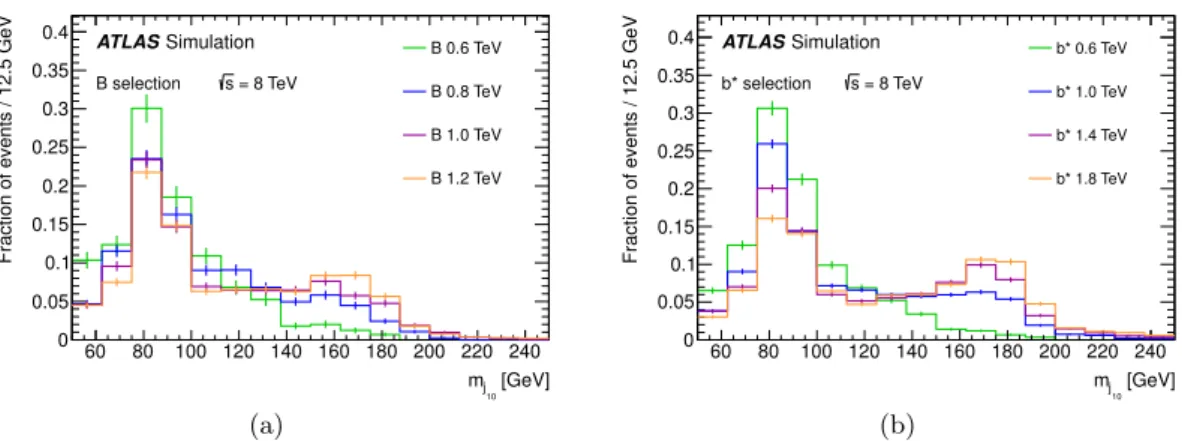
jets from the W boson are merged at larger boost. Events are also required to have
at least one large-R jet with pj10
T > 200 GeV and mj10 > 50 GeV. If several massive
JHEP02(2016)110
[GeV] 10 j m 60 80 100 120 140 160 180 200 220 240Fraction of events / 12.5 GeV
0 0.05 0.1 0.15 0.2 0.25 0.3 0.35 0.4 ATLAS Simulation B 0.6 TeV B 0.8 TeV B 1.0 TeV B 1.2 TeV B selection s = 8 TeV (a) [GeV] 10 j m 60 80 100 120 140 160 180 200 220 240
Fraction of events / 12.5 GeV
0 0.05 0.1 0.15 0.2 0.25 0.3 0.35
0.4 ATLAS Simulation b* 0.6 TeV b* 1.0 TeV b* 1.4 TeV b* 1.8 TeV
b* selection s = 8 TeV
(b)
Figure 3. Comparison of the leading large-R jet mass for various simulated(a)B and(b)b∗signal
masses before applying any requirement on angular distances which later define the signal regions. The distributions are normalised to unity.
missing transverse momentum and the transverse mass of the lepton–Emiss
T system3 of
Emiss
T > 20 GeV and mT(`, ETmiss) +ETmiss > 60 GeV, respectively, reduce the fraction of selected events originating from non-prompt or misidentified leptons. A requirement on
the azimuthal angle between the large-R jet and the lepton, ∆φ(`, j10) > 1.5, increases
the signal-to-background ratio, because in signal events large-R jets from boosted hadronic top-quark (W -boson) decays recoil against the leptonic decay of the other W boson (top quark) as shown in figure2(a)and2(b). Figure3shows the mass distribution of the leading large-R jet at this selection level for various simulated B (left) and b∗ (right) signal masses studied in this paper.
Angular correlations are used to select single-lepton events and to categorise them in the different signal regions: if the smallest distance between the lepton and any small-R jet satisfies ∆R(`, j4) > 1.5, and if the largest distance between the leading (highest pT) large-R jet and any small-R jet satisfies ∆R(j4, j10) < 2.0, events are assigned to the 1L
hadronic top region (1L hadT, see figure2(a)). However, if the smallest distance between
the lepton and any small-R jet is ∆R(`, j4) < 1.5 and the largest distance between the
leading large-R jet and any small-R jet is ∆R(j4, j10) > 2.0, the event is assigned to the
1L hadronicW category (1L hadW, see figure2(b)). If an event cannot be assigned to any
of the two categories, it is rejected.
For the B and b∗ signal regions the same selection cuts are applied, except that for the
B signal regions at least one additional forward small-R jet (2.5 < |η| < 4.5) is required. The selection with (without) forward-jet requirement is referred to as B (b∗) selection.
Figure 4 presents the distributions of the lepton transverse momentum for the b∗
selection of the single-lepton analysis for the predicted SM background processes, for data
events and two b∗ signal masses studied in this paper in the 1L hadT (left) and 1L hadW
(right) regions. The transverse momentum distribution of the leading (highestpT) forward
3The transverse mass is defined as m
T(`, ETmiss) = p2pT(`)ETmiss[1 − cos ∆φ(pT(`), EmissT )], where pT
denotes the magnitude of the lepton transverse momentum, and ∆φ(pT(`), EmissT ) the azimuthal difference
JHEP02(2016)110
Events / 25 GeV 1 10 2 10 3 10 4 10 5 10 [GeV] lepton T p 100 200 300 400 500 600 Data / Bkg0.8 1 1.2 ATLAS s = 8 TeV, 20.3 fb-1 1L hadT b* post-fit Data Top-quark pair Single top W+jets Others 150 × 1.6 TeV 0.6 TeV Total bkg. unc. (a) Events / 25 GeV 1 10 2 10 3 10 4 10 5 10 [GeV] lepton T p 100 200 300 400 500 600 Data / Bkg0.8 1 1.2 ATLAS s = 8 TeV, 20.3 fb-1 1L hadW b* post-fit Data Top-quark pair Single top W+jets Others 150 × 1.6 TeV 0.6 TeV Total bkg. unc. (b)Figure 4. Distributions of the lepton transverse momentum in the b∗ selection of the
single-lepton analysis for the data, SM background processes and two b∗ signal masses in the (a) b∗
1L hadT and (b) b∗ 1L hadW signal regions. The signal distributions are scaled to the theory
cross-sections multiplied by the indicated factor for better visibility and the background processes are normalised to their post-fit normalisation. The uncertainty band includes statistical and all systematic uncertainties. The last bin includes the overflow.
Events / 20 GeV 1 10 2 10 3 10 4 10 5 10 [GeV] forward jet T p 20 40 60 80 100 120 140 160 180 200 220 Data / Bkg0.8 1 1.2 ATLAS s = 8 TeV, 20.3 fb-1 1L hadT B post-fit Data Top-quark pair Single top W+jets Others 2500 × 1.2 TeV 50 × 0.6 TeV Total bkg. unc. (a) Events / 20 GeV 1 10 2 10 3 10 4 10 5 10 [GeV] forward jet T p 20 40 60 80 100 120 140 160 180 Data / Bkg0.8 1 1.2 ATLAS s = 8 TeV, 20.3 fb-1 1L hadW B post-fit Data Top-quark pair Single top W+jets Others 2500 × 1.2 TeV 50 × 0.6 TeV Total bkg. unc. (b)
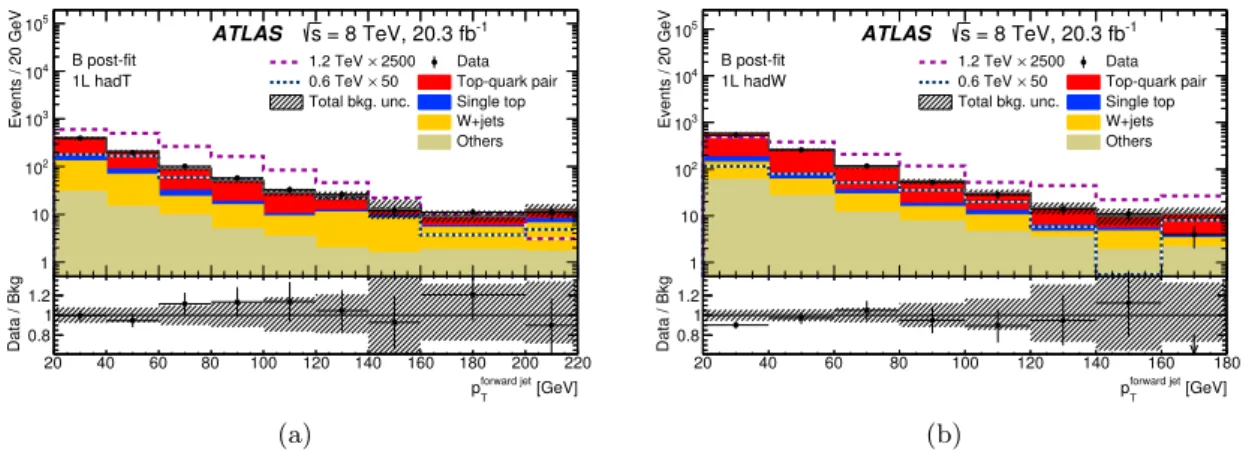
Figure 5. Distributions of the leading forward-jet transverse momentum in theB selection of the single-lepton analysis for the data events, SM background processes and twoB signal masses in the
(a)B 1L hadT and(b)B 1L hadW signal region. The signal distributions are scaled to the theory cross-sections multiplied by the indicated factor for better visibility and the background processes are normalised to their post-fit normalisation. The uncertainty band includes statistical and all systematic uncertainties. The last bin includes the overflow.
jet after applying all selection criteria in the twoB signal regions is shown in figure5. The
background processes are normalised to the post-fit event yields (see section 6) and the
data agrees with the SM expectation within the statistical and systematic uncertainties band in both figures.
The main background processes with a single-lepton signature arise from top-quark
pair andW +jets production, with smaller contributions from single top-quark production,
multijet,Z+jets and diboson events. The normalisation of W +jets processes as well as the
JHEP02(2016)110
the data in appropriate control regions enriched in W and t¯t events, respectively. Two
control regions (CRs) for each signal region are defined for this purpose. The selection
for the W -enriched region is the same as for the signal region, except that each event is
required to have exactly zero b-tagged jets. The selection for the t¯t control regions is the
same as for the signal regions, except that only events with two or more b-tagged jets are
selected. The multijet processes are estimated with a data-driven matrix method described
in reference [77]. The remaining background processes, such as single top-quark production,
Z+jets and diboson processes are estimated using simulations. The contamination of the t¯t
control regions byb∗ andB signals with masses of m≥ 1000 GeV is at most 16% and 0.9%,
respectively, and in the W -enriched control regions at most 2.2% and 0.1%, respectively.
The invariant mass calculated from the four-momenta of the lepton, all (two or three) central small-R jets and the missing transverse momentum is used to discriminate the signal from the background processes in the statistical analysis. Since the longitudinal
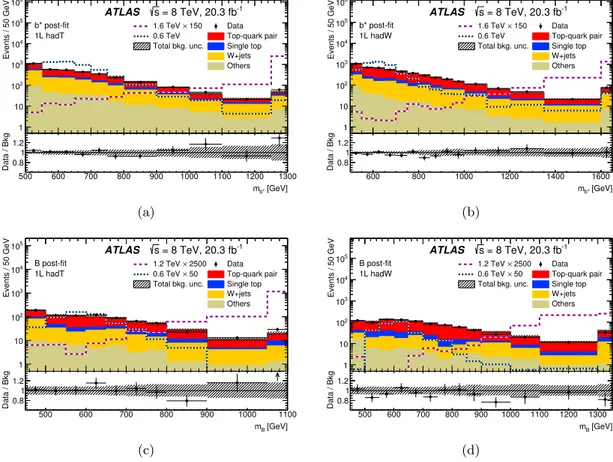
component of the neutrino momentum is not reconstructed, it is set to zero. Figure 6
shows the reconstructed mass distribution for the b∗ selection (top row) and for the B
selection (bottom row) in the 1L hadT (left side) and the 1L hadW (right side) signal
region. Further kinematic distributions, such as the leading large-R jet mass in the b∗
signal regions and the leading large-R jet transverse momentum in the B signal regions,
are presented in figure 7. All SM background processes in figure 4–7 are normalised to
the post-fit normalisation that is discussed in section 6. The figures show good agreement
between the data and the SM background processes. The total number of data events and the event yields after fitting the background-only hypotheses to data (as explained in section 6), together with their systematic uncertainties in the B and b∗ signal regions, are listed in tables3 and 4.
The post-fit normalisation is consistent with the pre-fit expectation within uncertain-ties: the normalisation of the top-quark background differs by 5–10%, the normalisation
of W +jets processes in the SRs is consistent with 1.0, except for the 1L hadW B signal
region, where it decreases to 0.65± 0.11.
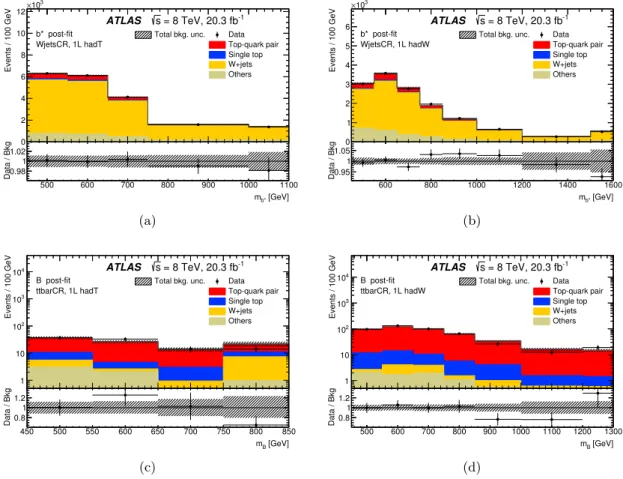
Figure 8 presents the distributions of the discriminant in the single-lepton channel
(reconstructed mass) together with their statistical and systematic uncertainties in the b∗
W +jets control regions (top row) and in the B t¯t control regions (bottom row) for the 1L
hadT category (left side) and the 1L hadW category (right side).
4.3 Dilepton event selection and background estimation
Events in the dilepton final state are required to have exactly one electron and one muon with opposite charge as well as one or two central small-R jets (|η| < 2.5), exactly one of
which is required to be b-tagged. Since same-flavour Z → `` (` = e, µ) events are already
suppressed by the opposite-flavour lepton requirement, no Emiss
T requirement is applied.
For the b∗ signal, it was found that the angular distance between the jet and the lepton
is smaller than that in background process events, so an additional requirement is made
on the smallest value of angle φ between the leading small-R jet (j0) and the leptons,
JHEP02(2016)110
Events / 50 GeV 1 10 2 10 3 10 4 10 5 10 6 10 [GeV] b* m 500 600 700 800 900 1000 1100 1200 1300 Data / Bkg0.8 1 1.2 ATLAS s = 8 TeV, 20.3 fb-1 1L hadT b* post-fit Data Top-quark pair Single top W+jets Others 150 × 1.6 TeV 0.6 TeV Total bkg. unc. (a) Events / 50 GeV 1 10 2 10 3 10 4 10 5 10 6 10 [GeV] b* m 600 800 1000 1200 1400 1600 Data / Bkg0.8 1 1.2 ATLAS s = 8 TeV, 20.3 fb-1 1L hadW b* post-fit Data Top-quark pair Single top W+jets Others 150 × 1.6 TeV 0.6 TeV Total bkg. unc. (b) Events / 50 GeV 1 10 2 10 3 10 4 10 5 10 [GeV] B m 500 600 700 800 900 1000 1100 Data / Bkg0.8 1 1.2 ATLAS s = 8 TeV, 20.3 fb-1 1L hadT B post-fit Data Top-quark pair Single top W+jets Others 2500 × 1.2 TeV 50 × 0.6 TeV Total bkg. unc. (c) Events / 50 GeV 1 10 2 10 3 10 4 10 5 10 [GeV] B m 500 600 700 800 900 1000 1100 1200 1300 Data / Bkg0.8 1 1.2 ATLAS s = 8 TeV, 20.3 fb-1 1L hadW B post-fit Data Top-quark pair Single top W+jets Others 2500 × 1.2 TeV 50 × 0.6 TeV Total bkg. unc. (d)Figure 6. Distributions of the reconstructed mass in theb∗(top row) andB (bottom row) selection
of the single-lepton analysis for the SM background processes, data and two b∗ (top row) or B
(bottom row) signal masses in the (a) b∗ 1L hadT, (b) b∗ 1L hadW, (c) B 1L hadT and (d) B
1L hadW signal regions. The signal distributions are scaled to the theory cross-sections multiplied by the indicated factor for better visibility and the background processes are normalised to their post-fit normalisation. The uncertainty band includes statistical and all systematic uncertainties. The first and last bin include the underflow and overflow, respectively. The binning of the figures is the same as used in the binned likelihood fit function.
For theB signal, events are required to have exactly one central b-tagged jet from the
top-quark decay and one small-R jet with 1.5 < |η| < 4.5 from the light quark. If this
additional jet is in the range of |η| < 2.5, then it is required not to be b-tagged. Events are also allowed to contain up to one additional untagged jet with|η| < 1.5.
Events with one central jet and two central jets have different background compositions and are considered as separate signal regions 2L 1jet 1tag and 2L 2jet 1tag, respectively. A
t¯t control region 2L 2jet 2tag is defined by requiring exactly two central b-tagged small-R
jets. The contamination by B and b∗ signals withm = 1000 GeV is at most 0.3%.
The main background processes with a dilepton signature arise from top-quark pair, single top-quark and diboson production, with smaller contributions from non-prompt
lepton and Z+jets events. The Z+jets background, which arises from Z-boson decays to
tau leptons that subsequently decay into an electron and a muon, is taken from simulation samples. The non-prompt lepton background process arises from events where one or two jets are misidentified as leptons. This background includes mainly multijet processes as
JHEP02(2016)110
Events / 12 GeV 1 10 2 10 3 10 4 10 5 10 6 10 [GeV] 10 j m 60 80 100 120 140 160 180 200 220 Data / Bkg0.8 1 1.2 ATLAS s = 8 TeV, 20.3 fb-1 1L hadT b* post-fit Data Top-quark pair Single top W+jets Others 150 × 1.6 TeV 0.6 TeV Total bkg. unc. (a) Events / 12 GeV 1 10 2 10 3 10 4 10 5 10 6 10 [GeV] 10 j m 60 80 100 120 140 160 180 200 220 Data / Bkg0.8 1 1.2 ATLAS s = 8 TeV, 20.3 fb-1 1L hadW b* post-fit Data Top-quark pair Single top W+jets Others 150 × 1.6 TeV 0.6 TeV Total bkg. unc. (b) Events / 50 GeV 1 10 2 10 3 10 4 10 5 10 6 10 [GeV] 10 j T p 200 250 300 350 400 450 500 550 Data / Bkg0.8 1 1.2 ATLAS s = 8 TeV, 20.3 fb-1 1L hadT B post-fit Data Top-quark pair Single top W+jets Others 2500 × 1.2 TeV 50 × 0.6 TeV Total bkg. unc. (c) Events / 50 GeV 1 10 2 10 3 10 4 10 5 10 6 10 [GeV] 10 j T p 200 250 300 350 400 450 500 550 600 650 Data / Bkg0.8 1 1.2 ATLAS s = 8 TeV, 20.3 fb-1 1L hadW B post-fit Data Top-quark pair Single top W+jets Others 2500 × 1.2 TeV 50 × 0.6 TeV Total bkg. unc. (d)Figure 7. Distributions of the leading large-R jet mass in the b∗ selection (top row) and
dis-tributions of the leading large-R transverse momentum in the B selection (bottom row) of the single-lepton analysis for the SM background processes, data and two b∗ (top row) or B (bottom
row) signal masses in the(a),(c)1L hadT and(b),(d)1L hadW signal regions. The signal distribu-tions are scaled to the theory cross-secdistribu-tions multiplied by the indicated factor for better visibility and the background processes are normalised to their post-fit normalisation. The uncertainty band includes statistical and all systematic uncertainties. The last bin includes the overflow.
well as processes with a single-lepton final state (t¯t single-lepton channel, single top-quark
other thanWt-channel, W +jets). It is estimated with the data-driven matrix method [77]
as described in section 4.2. The event yields in each of the signal regions after fitting
the background-only hypothesis to data are shown in table 3 and 4. For each process the
post-fit normalisation is compatible with the pre-fit normalisation.
Selected kinematic distributions, such as the pT of the leading lepton and the EmissT , for the dilepton events in the signal regions 2L 1jet 1tag and 2L 2jet 1tag are shown in
figure 9. The background processes are normalised to post-fit event yields and their sum
models the data well. The transverse mass (mT) of the system formed by the leptons, the
leading jet and theEmiss
T is used as the final discriminating distribution.
The distributions ofmT for the differentB and b∗ signal and control regions are shown
in figure 10and figure 11, respectively. The distributions show the bin widths used in the
statistical analysis. The control region distributions for various kinematic variables as well as the event yields show good agreement between data and MC simulation.
JHEP02(2016)110
Events / 100 GeV 0 2 4 6 8 10 12 3 10 × [GeV] b* m 500 600 700 800 900 1000 1100 Data / Bkg 0.98 1 1.02 ATLAS s = 8 TeV, 20.3 fb-1 WjetsCR, 1L hadT b* post-fit Data Top-quark pair Single top W+jets Others Total bkg. unc. (a) Events / 100 GeV 0 1 2 3 4 5 6 3 10 × [GeV] b* m 600 800 1000 1200 1400 1600 Data / Bkg 0.95 1 1.05 ATLAS s = 8 TeV, 20.3 fb-1 WjetsCR, 1L hadW b* post-fit Data Top-quark pair Single top W+jets Others Total bkg. unc. (b) Events / 100 GeV 1 10 2 10 3 10 4 10 [GeV] B m 450 500 550 600 650 700 750 800 850 Data / Bkg0.8 1 1.2 ATLAS s = 8 TeV, 20.3 fb-1 ttbarCR, 1L hadT B post-fit Data Top-quark pair Single top W+jets Others Total bkg. unc. (c) Events / 100 GeV 1 10 2 10 3 10 4 10 [GeV] B m 500 600 700 800 900 1000 1100 1200 1300 Data / Bkg0.8 1 1.2 ATLAS s = 8 TeV, 20.3 fb-1 ttbarCR, 1L hadW B post-fit Data Top-quark pair Single top W+jets Others Total bkg. unc. (d)Figure 8. Distributions of the reconstructed mass in theb∗(top row) andB (bottom row) selection
of the single-lepton analysis for the SM background processes and data events in the (a), (c) 1L hadT and(b),(d)1L hadW W +jets control region (top row) and t¯t control region (bottom row). The background processes are normalised to their post-fit normalisation. The uncertainty band includes statistical and all systematic uncertainties. The first and last bin include the underflow and overflow, respectively. The binning of the figures is the same as used in the binned likelihood fit function.
5 Systematic uncertainties
Systematic uncertainties affect the yield and acceptance estimates as well as the shape of the discriminant distributions of the signal and background processes. They are included as nuisance parameters in the statistical analysis and both normalisation and shape vari-ations are considered (except for the theoretical cross section uncertainty and the PDF uncertainties). Sources of uncertainty include the modelling of the detector, properties of reconstructed objects, theoretical modelling of the signals and backgrounds, as well as the uncertainty of the prediction arising from the limited size of the simulated event samples.
5.1 Experimental uncertainties
Experimental sources of systematic uncertainty arise from the reconstruction and measure-ment of jets [67,74,78–80], leptons [62,81] and Emiss
T [76]. The impact of the uncertainty
in the jet-energy scale (JES) is evaluated for both the small-R and R jets. For large-R jets, additional uncertainties associated with the scale and resolution of the jet mass
JHEP02(2016)110
Process 1L hadT 1L hadW 2L 1jet 1tag 2L 2jet 1tag
t¯t 483(27) 746(34) 2480(40) 1457(34) Singlet 94(13) 125(13) 276(23) 81(9) W +jets 220(40) 152(27) — — W W , W Z, ZZ, Z+jets 22(7) 30(11) 15(5) 5(4) Non-prompt lepton 18(11) 28(14) 6(4) 1.9(15) SignalmB = 500 GeV 12.0(19) 10.4(16) 13.8(9) 4.1(4) SignalmB = 600 GeV 22.4(22) 13.4(15) 7.9(4) 2.34(25) SignalmB = 700 GeV 16.7(13) 10.6(8) 4.06(25) 1.33(11) SignalmB = 800 GeV 11.1(7) 7.3(5) 2.35(14) 0.69(6) SignalmB = 1000 GeV 3.62(29) 2.78(16) 0.64(4) 0.205(19) SignalmB = 1200 GeV 1.40(9) 1.09(7) 0.188(14) 0.073(7) Total bkg. 835(34) 1081(35) 2780(40) 1544(35) Data 856 1018 2760 1548
Table 3. Event yields in the signal regions for the B analysis after the fit of the background-only hypothesis (as explained in section 6). The uncertainties include statistical and systematic uncer-tainties. The uncertainties on the background composition are much larger than the uncertainty on the sum of the backgrounds, which is strongly constrained by the data. The numbers of the B signal events are evaluated using the respective theory cross-sections and branching ratios forλ = 2.
Process 1L hadT 1L hadW 2L 1jet 1tag 2L 2jet 1tag
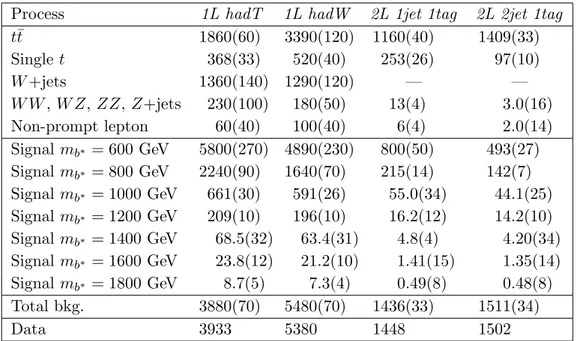
t¯t 1860(60) 3390(120) 1160(40) 1409(33) Singlet 368(33) 520(40) 253(26) 97(10) W +jets 1360(140) 1290(120) — — W W , W Z, ZZ, Z+jets 230(100) 180(50) 13(4) 3.0(16) Non-prompt lepton 60(40) 100(40) 6(4) 2.0(14) Signalmb∗ = 600 GeV 5800(270) 4890(230) 800(50) 493(27) Signalmb∗ = 800 GeV 2240(90) 1640(70) 215(14) 142(7) Signalmb∗ = 1000 GeV 661(30) 591(26) 55.0(34) 44.1(25) Signalmb∗ = 1200 GeV 209(10) 196(10) 16.2(12) 14.2(10) Signalmb∗ = 1400 GeV 68.5(32) 63.4(31) 4.8(4) 4.20(34) Signalmb∗ = 1600 GeV 23.8(12) 21.2(10) 1.41(15) 1.35(14) Signalmb∗ = 1800 GeV 8.7(5) 7.3(4) 0.49(8) 0.48(8) Total bkg. 3880(70) 5480(70) 1436(33) 1511(34) Data 3933 5380 1448 1502
Table 4. Event yields in the signal regions for the b∗ analysis after the fit of the background-only
hypothesis (as explained in section 6). The uncertainties include statistical and systematic uncer-tainties. The uncertainties on the background composition are much larger than the uncertainty on the sum of the backgrounds, which is strongly constrained by the data. The numbers of the b∗ signal events are evaluated using the respective theory cross-sections and branching ratios. The
JHEP02(2016)110
Events / 25 GeV 1 10 2 10 3 10 4 10 5 10 6 10 [GeV] leading lepton T p 50 100 150 200 250 Data / Bkg0.8 1 1.2 ATLAS s = 8 TeV, 20.3 fb-1 2L 2jet 1tag B post-fit Data Top-quark pair Single top Others 2500 × 1.2 TeV 50 × 0.6 TeV Total bkg. unc. (a) Events / 25 GeV 1 10 2 10 3 10 4 10 5 10 6 10 [GeV] leading lepton T p 50 100 150 200 250 Data / Bkg0.8 1 1.2 ATLAS s = 8 TeV, 20.3 fb-1 2L 1jet 1tag b* post-fit Data Top-quark pair Single top Others 150 × 1.6 TeV 0.6 TeV Total bkg. unc. (b) Events / 20 GeV 1 10 2 10 3 10 4 10 5 10 [GeV] miss T E 0 50 100 150 200 250 Data / Bkg0.8 1 1.2 ATLAS s = 8 TeV, 20.3 fb-1 2L 1jet 1tag B post-fit Data Top-quark pair Single top Others 2500 × 1.2 TeV 50 × 0.6 TeV Total bkg. unc. (c) Events / 20 GeV 1 10 2 10 3 10 4 10 5 10 6 10 [GeV] miss T E 0 50 100 150 200 250 300 Data / Bkg0.8 1 1.2 ATLAS s = 8 TeV, 20.3 fb-1 2L 2jet 1tag b* post-fit Data Top-quark pair Single top Others 150 × 1.6 TeV 0.6 TeV Total bkg. unc. (d)Figure 9. Distributions of kinematic variables in different signal regions of the dilepton selection for SM background processes and data, overlaid with two corresponding signal distributions: (a)
leading lepton pT in the 2L 2jet 1tag region after the B selection and (b) in the 2L 1jet 1tag
region after the b∗ selection,(c) Emiss
T in the 2L 1jet 1tag region after the B selection and (d)in
the 2L 2jet 1tag region after the b∗ selection. The signal distributions are scaled to the theory
cross-sections multiplied by the indicated factor for better visibility and the background processes are normalised to their post-fit normalisation. The uncertainty band includes statistical and all systematic uncertainties. The last bin includes the overflow.
are included. The Emiss
T has additional uncertainty contributions due to the modelling of
energy deposits not associated with any reconstructed object. Further uncertainties arise from the lepton trigger, reconstruction, energy scale and resolution as well as from the
lepton and jet identification efficiency modelling. Uncertainties on the b-tagging efficiency
and mistag rates are estimated from data [82].
The largest detector-specific uncertainties for the single-lepton channel arise from large-R jet-energy scale uncertainties (10–18% effect on the predicted background yield), large large- R-jet energy and mass resolution uncertainties (2–5%), small-R R-jet-energy scale uncertainties
(3–5%) and theb-tagging uncertainties (1–3%), depending on the signal region and analysis
selection. The expected yield of events with non-prompt leptons is subject to uncertainties in the real and non-prompt lepton efficiencies and they sum to a 2–18% uncertainty on the total SM background in the defined signal regions.
JHEP02(2016)110
Events / 100 GeV 1 10 2 10 3 10 4 10 5 10 6 10 [GeV] T m 300 400 500 600 700 800 900 Data / Bkg0.8 1 1.2 ATLAS s = 8 TeV, 20.3 fb-1 2L 1jet 1tag B post-fit Data Top-quark pair Single top Others 2500 × 1.2 TeV 50 × 0.6 TeV Total bkg. unc. (a) Events / 100 GeV 1 10 2 10 3 10 4 10 5 10 6 10 [GeV] T m 300 400 500 600 700 800 900 Data / Bkg0.8 1 1.2 ATLAS s = 8 TeV, 20.3 fb-1 2L 2jet 1tag B post-fit Data Top-quark pair Single top Others 2500 × 1.2 TeV 50 × 0.6 TeV Total bkg. unc. (b) Events / 100 GeV 1 10 2 10 3 10 4 10 5 10 6 10 [GeV] T m 300 400 500 600 700 800 900 Data / Bkg0.8 1 1.2 ATLAS s = 8 TeV, 20.3 fb-1 2L 2jet 2tag B post-fit Data Top-quark pair Single top Others Total bkg. unc. (c)Figure 10. Distributions of the discriminant variable, transverse mass,mT, in the dilepton channel
for data and SM background processes in the(a)2L 1jet 1tag signal region,(b)2L 2jet 1tag signal region and(c)2L 2jet 2tag control region using theB selection. The two B signal distributions that are included for the signal region distributions are scaled to the theory cross-sections multiplied by the indicated factor for better visibility. The background processes are normalised to their post-fit normalisation. The uncertainty band includes statistical and all systematic uncertainties. The first and the last bin contain the underflow and overflow, respectively. The binning of the figures is the same as used in the binned likelihood fit function.
For the dilepton channel, the relative impact of a particular systematic uncertainty is similar for the signal and background and for the different signal regions. Significant
varia-tions on the acceptance come from theb-tagging uncertainty (2–5%), electron identification
uncertainty (2–3%) and from JES uncertainties related to pile-up (1–2%).
5.2 Modelling of theoretical uncertainties
Theoretical uncertainties are evaluated for the signal as well as for the background
pro-cesses. The evaluation of the PDF uncertainty follows the PDF4LHC prescription [83]
using three different PDF sets (CT10, MSTW2008nlo68cl and NNPDF20 [84]). The
uncertainty on top-quark pair production due to initial- and final-state radiation is eval-uated using the Alpgen LO generator, with the CTEQ6L1 PDF set and interfaced with
JHEP02(2016)110
Events / 60 GeV 1 10 2 10 3 10 4 10 5 10 [GeV] T m 300 400 500 600 700 800 Data / Bkg0.8 1 1.2 ATLAS s = 8 TeV, 20.3 fb-1 2L 1jet 1tag b* post-fit Data Top-quark pair Single top Others 150 × 1.6 TeV 0.6 TeV Total bkg. unc. (a) Events / 100 GeV 1 10 2 10 3 10 4 10 5 10 6 10 [GeV] T m 300 400 500 600 700 800 Data / Bkg0.8 1 1.2 ATLAS s = 8 TeV, 20.3 fb-1 2L 2jet 1tag b* post-fit Data Top-quark pair Single top Others 150 × 1.6 TeV 0.6 TeV Total bkg. unc. (b) Events / 100 GeV 1 10 2 10 3 10 4 10 5 10 6 10 [GeV] T m 300 400 500 600 700 800 Data / Bkg0.8 1 1.2 ATLAS s = 8 TeV, 20.3 fb-1 2L 2jet 2tag b* post-fit Data Top-quark pair Single top Others Total bkg. unc. (c)Figure 11. Distributions of the discriminant variable, transverse mass,mT, in the dilepton channel
for data and SM background processes in the(a)2L 1jet 1tag signal region,(b)2L 2jet 1tag signal region and(c)2L 2jet 2tag control region using theb∗selection. For the signal region distributions,
the two included b∗ signal distributions are scaled to the theory cross-sections multiplied by the
indicated factor for better visibility. The background processes are normalised to their post-fit normalisation. The uncertainty band includes statistical and all systematic uncertainties. The first and the last bin contain the underflow and overflow, respectively. The binning of the figures is the same as used in the binned likelihood fit function.
matrix-element calculation is varied by factors of 2 and 0.5, and at the same time the amount of radiation is decreased or increased in a range compatible with data by choosing
the appropriate variation of the Pythia Perugia 2012 tune [85].
The uncertainty on the top-quark pair and single top-quark Wt processes due to the
choice of generator and parton shower is evaluated by comparing the nominal simulation
samples to Powheg-Box and MC@NLO v4.06 [86, 87] samples interfaced with
Her-wig v6.52.
For background estimates based on simulations, the largest sources of uncertainty in the single-lepton analysis are due to varying the parameters controlling the initial-state radiation model (2.5–5%), the PDF sets (1–3%) and renormalisation and factorisation
scales (1–7%). Differences for heavy-flavour and light-flavour components of the W +jets
background processes in the signal and control regions lead to a systematic uncertainty of 4–5%.
JHEP02(2016)110
For the dilepton analysis, the initial- and final-state radiation uncertainty has an im-pact on the selection efficiency of 5–17%. The imim-pact of the other theoretical uncertainties on the total background rate is 1–8%, depending on the signal region and signal or back-ground sample.
The normalisation of the t¯t, single-top t-channel and Wt backgrounds has an
uncer-tainty of +5.1−5.9% [50, 51], +3.9−2.2% and 6.8% [53], respectively. The diboson and W/Z+jets
background processes have an uncertainty of 5% and 4% [88], respectively, with an
addi-tional 24% for each addiaddi-tional jet [89,90].
The uncertainty on the luminosity of ±2.8% [91] affects the normalisation of the signal
and the background processes estimated from theory predictions.
6 Statistical analysis and results
The distributions ofmBandmb∗ in the single-lepton channel andmTin the dilepton
chan-nel are sensitive to resonant production of B and b∗, respectively. A binned likelihood fit
is performed in order to test for the presence of a signal. A separate fit is performed for
each signal hypothesis, i.e. B/b∗ with fixed mass and couplings. Let Ni be the observed
number of events in bini, Bi the predicted number of background events,Si the predicted
number of signal events assuming a cross-section of 1 pb, and µ the signal-strength
pa-rameter, which measures the signal cross-section in units of pb. The likelihood function is constructed as the product of Poisson likelihood terms, each of the form Pois(Ni;µSi+Bi), over all bins of the mB/mb∗/mT distributions in the signal and control regions. The
one-sided 95% CL upper limit on µ, and therefore the signal cross-section, is constructed in a
Bayesian approach4 with a positive semidefinite flat prior for µ. The expected limits are
derived by fitting to the nominal background estimate [94].
The likelihood function also depends on a set of nuisance parameters, which encode the
adjustments of the expectations due to the systematic uncertainties discussed in section 5.
The prior for each of the nuisance parameters is taken to be the normal distribution, where
a value of 0 corresponds to the nominal prediction, and ±1 to the symmetric variation
by one standard deviation. The uncertainties on the expected numbers of events in each
bin (Si, Bi) are propagated to µ through these parameters. They also allow the control
regions to improve the description of the data, and to reduce the impact of systematic uncertainties in the signal region. The strongest reduction is achieved for the normalisation
uncertainty on theW +jets background, which becomes 10% after the fit, compared to the
about 40% before the fit. The largest uncertainties are due to the JES, the b-tagging,
and the background normalisation, where the latter is dominant for small masses. Table 5
shows the normalisation variation from the largest systematic uncertainties before and after the fit. The posterior distribution of the nuisance parameters after the fit of the background-only (µ = 0) hypothesis to the data is used to compute post-fit event yields, to normalise the distributions in the control plots, and to check for agreement between data and the background prediction in many variables. Given that the best-fit values of
4The posterior density function is sampled using the Bayesian Analysis Toolkit [92], interfaced to
JHEP02(2016)110
b∗ B
Pre-fit [%] Post-fit [%] Pre-fit [%] Post-fit [%]
Jet uncertainties 14.0 6.5 12.0 6.2 b-tagging uncertainties 3.3 3.0 2.8 2.5 Lepton uncertainties 1.6 1.5 1.6 1.6 Fake-lepton uncertainties 2.6 2.4 2.9 2.6 Theory uncertainties • Top-quark pair 3.2 1.8 9.4 3.4 • W +jets 9.1 3.6 9.6 4.9 • Single top 0.0 0.0 0.1 0.1 • Diboson 0.5 0.5 0.2 0.2 • Z+jets 0.5 0.5 0.7 0.7
Table 5. Relative effects of the systematic uncertainties on the total background estimate in the signal regions, before and after fitting. The jet uncertainties include large-R jet uncertainties and other jet uncertainties such as jet energy scale and resolution. The lower part of the table shows how the theoretical uncertainties on individual backgrounds affect the sum of all backgrounds.
the nuisance parameters were found to be compatible between the individual regions, the nuisance parameters are treated as fully correlated between the regions.
The post-fit event yields for the B and b∗ signal regions together with their systematic
uncertainties are listed in the tables 3 and 4. For illustration, the number of events for
some signal hypotheses are also presented, each normalised to the predicted cross-section times branching ratio.
The maximum local deviation of the observed data from the expected background is 1.4 standard deviations, seen in the last bin of the b∗ 1L hadT signal region (figure 6(a)).
The value is computed using a moving-window algorithm [95] that compares data to the
improved background estimate in the signal regions. Given the absence of a significant
excess, limits are set on the production cross-section of both B and b∗ multiplied by the
branching ratio of the decay toWt.
The resulting expected and observed limits at the 95% CL on cross-section times
branching ratio are presented as functions of the B (figure 12(a)) and b∗ (figure 12(b))
mass, and are compared to the theory predictions. No large deviations of the observed limits from the expected limits are found. The observed limits for high masses are slightly worse than expected, because the corresponding fits are sensitive to the mild excess in the last bin of the signal region in the single-lepton channel (see above).
The observed (expected) mass limit is defined by the intersection of the theory line with
the observed (expected) cross-section limit. For the B production, no limit on the mass
and only limits on the cross-section times branching ratio can be set. For b∗ production
with couplings offg =fL=fR= 1, the cross-section limits are translated into an observed
(expected) lower limit on the b∗ mass of 1500 GeV (1660 GeV).
The cross-section is parameterised as a function of the couplings fgandfL,Rto extract the limits on these couplings for several mass hypotheses. The resulting contours are shown in figure 13.
JHEP02(2016)110
[GeV] B m 600 800 1000 1200 Wt) [pb] → BR(B × Bq) → (pp σ -1 10 1 10 2 10 Expected 95% CL limit σ 1 ± Expected σ 2 ± Expected Observed 95% CL limit =2 λ B theory =3 λ B theory ATLAS -1 = 8 TeV, 20.3 fb s (a) [GeV] b* m 1000 1500 Wt) [pb] → BR(b* × b*) → (pp σ -1 10 1 10 2 10 Expected 95% CL limit σ 1 ± Expected σ 2 ± Expected Observed 95% CL limit b* theory ATLAS -1 = 8 TeV, 20.3 fb s (b)Figure 12. Expected (dashed black line) and observed (solid red line) 95% CL limits on the (a)
B and the (b) b∗ production cross-sections times branching fractions plotted against the mass.
The uncertainty band around the expected limit indicates the variations by ± 1 and ± 2 standard deviations. The single-lepton and the dilepton channels are combined. Also shown are the theory predictions, which forB are for two different coupling values λ in the mass range where these are valid. The couplingsfg =fL=fR= 1 are assumed for theb∗ theory predictions. For both theb∗
and theB signals, the uncertainty in the theory band includes the scale and the PDF uncertainties.
R = f L f 0.1 0.2 0.3 0.4 0.5 0.6 0.7 0.8 0.9 1 g f 0 0.1 0.2 0.3 0.4 0.5 0.6 0.7 0.8 0.9 1 0.6 TeV 0.8 TeV 1.0 TeV 1.2 TeV 1.4 TeV b* m Expected 95% CL limit ATLAS s = 8 TeV, 20.3 fb -1 (a) R = f L f 0.1 0.2 0.3 0.4 0.5 0.6 0.7 0.8 0.9 1 g f 0 0.1 0.2 0.3 0.4 0.5 0.6 0.7 0.8 0.9 1 0.6 TeV 0.8 TeV 1.0 TeV 1.2 TeV 1.4 TeV b* m Observed 95% CL limit ATLAS s = 8 TeV, 20.3 fb -1 (b)
Figure 13. Expected (a) and observed (b) limit contours at the 95% CL as a function of the coupling parameters for several choices of mb∗. The surrounding shaded bands correspond to ±1
standard derivations around the expected limits. For a given mass, couplings above the correspond-ing contour line are excluded.
7 Conclusion
A search for the production of singly produced fourth-generation vector-like quarks and
excited quarks with charge ±13e (down-type) in which the B, produced via the weak
inter-action, and b∗ produced via the strong interaction with chromomagnetic couplings, decay
intoWt has been performed using 20.3 fb−1of√s = 8 TeV proton-proton collision data
JHEP02(2016)110
with one or two leptons and with one, two or three jets are considered. The observations
are consistent with the Standard Model expectations. Limits are set for B and b∗ models
by combining the results from the single-lepton and dilepton channels. Theb∗ models with
fg = fL =fR = 1 and decay to Wt are excluded up to masses of 1500 GeV at 95% CL.
Upper limits on the production cross-sections times branching ratios for different
vector-like B and excited b∗ quark masses are also provided. Theb∗ limit is an improvement over
the previous ATLAS result and yields similar exclusion limits as the recent CMS result.
The cross section limit on the single production of vector-like B quarks extends the set
of existing B searches into the Wt final state using a novel approach for boosted event
topologies.
Acknowledgments
We thank CERN for the very successful operation of the LHC, as well as the support staff from our institutions without whom ATLAS could not be operated efficiently.
We acknowledge the support of ANPCyT, Argentina; YerPhI, Armenia; ARC, Aus-tralia; BMWFW and FWF, Austria; ANAS, Azerbaijan; SSTC, Belarus; CNPq and FAPESP, Brazil; NSERC, NRC and CFI, Canada; CERN; CONICYT, Chile; CAS, MOST and NSFC, China; COLCIENCIAS, Colombia; MSMT CR, MPO CR and VSC CR, Czech Republic; DNRF, DNSRC and Lundbeck Foundation, Denmark; IN2P3-CNRS, CEA-DSM/IRFU, France; GNSF, Georgia; BMBF, HGF, and MPG, Germany; GSRT, Greece; RGC, Hong Kong SAR, China; ISF, I-CORE and Benoziyo Center, Israel; INFN, Italy; MEXT and JSPS, Japan; CNRST, Morocco; FOM and NWO, Netherlands; RCN, Nor-way; MNiSW and NCN, Poland; FCT, Portugal; MNE/IFA, Romania; MES of Russia and
NRC KI, Russian Federation; JINR; MESTD, Serbia; MSSR, Slovakia; ARRS and MIZˇS,
Slovenia; DST/NRF, South Africa; MINECO, Spain; SRC and Wallenberg Foundation, Sweden; SERI, SNSF and Cantons of Bern and Geneva, Switzerland; MOST, Taiwan; TAEK, Turkey; STFC, United Kingdom; DOE and NSF, United States of America. In addition, individual groups and members have received support from BCKDF, the Canada Council, CANARIE, CRC, Compute Canada, FQRNT, and the Ontario Innovation Trust, Canada; EPLANET, ERC, FP7, Horizon 2020 and Marie Sk lodowska-Curie Actions, Euro-pean Union; Investissements d’Avenir Labex and Idex, ANR, Region Auvergne and Fonda-tion Partager le Savoir, France; DFG and AvH FoundaFonda-tion, Germany; Herakleitos, Thales and Aristeia programmes co-financed by EU-ESF and the Greek NSRF; BSF, GIF and Minerva, Israel; BRF, Norway; the Royal Society and Leverhulme Trust, United Kingdom. The crucial computing support from all WLCG partners is acknowledged gratefully, in particular from CERN and the ATLAS Tier-1 facilities at TRIUMF (Canada), NDGF (Denmark, Norway, Sweden), CC-IN2P3 (France), KIT/GridKA (Germany), INFN-CNAF (Italy), NL-T1 (Netherlands), PIC (Spain), ASGC (Taiwan), RAL (U.K.) and BNL (U.S.A.) and in the Tier-2 facilities worldwide.
Open Access. This article is distributed under the terms of the Creative Commons
Attribution License (CC-BY 4.0), which permits any use, distribution and reproduction in
JHEP02(2016)110
References
[1] O. Eberhardt et al., Impact of a Higgs boson at a mass of 126 GeV on the standard model with three and four fermion generations,Phys. Rev. Lett. 109 (2012) 241802
[arXiv:1209.1101] [INSPIRE].
[2] ATLAS collaboration, Observation of a new particle in the search for the standard model Higgs boson with the ATLAS detector at the LHC,Phys. Lett. B 716 (2012) 1
[arXiv:1207.7214] [INSPIRE].
[3] CMS collaboration, Observation of a new boson at a mass of 125 GeV with the CMS experiment at the LHC,Phys. Lett. B 716 (2012) 30[arXiv:1207.7235] [INSPIRE].
[4] B. Holdom, W.S. Hou, T. Hurth, M.L. Mangano, S. Sultansoy and G. Unel, Four statements about the fourth generation,PMC Phys. A 3 (2009) 4[arXiv:0904.4698] [INSPIRE].
[5] A.K. Alok, A. Dighe and D. London, Constraints on the four-generation quark mixing matrix from a fit to flavor-physics data,Phys. Rev. D 83 (2011) 073008[arXiv:1011.2634]
[INSPIRE].
[6] J.A. Aguilar-Saavedra, Identifying top partners at LHC,JHEP 11 (2009) 030
[arXiv:0907.3155] [INSPIRE].
[7] L. Randall and R. Sundrum, A large mass hierarchy from a small extra dimension,Phys.
Rev. Lett. 83 (1999) 3370[hep-ph/9905221] [INSPIRE].
[8] S.P. Martin, Extra vector-like matter and the lightest Higgs scalar boson mass in low-energy supersymmetry,Phys. Rev. D 81 (2010) 035004[arXiv:0910.2732] [INSPIRE].
[9] D.B. Kaplan, H. Georgi and S. Dimopoulos, Composite Higgs scalars,Phys. Lett. B 136
(1984) 187[INSPIRE].
[10] N. Vignaroli, Discovering the composite Higgs through the decay of a heavy fermion,JHEP
07 (2012) 158[arXiv:1204.0468] [INSPIRE].
[11] M. Schmaltz and D. Tucker-Smith, Little Higgs review,Ann. Rev. Nucl. Part. Sci. 55 (2005)
229[hep-ph/0502182] [INSPIRE].
[12] M.-L. Xiao and J.-H. Yu, Stabilizing electroweak vacuum in a vectorlike fermion model,Phys.
Rev. D 90 (2014) 014007[arXiv:1404.0681] [INSPIRE].
[13] F. del Aguila, M. P´erez-Victoria and J. Santiago, Observable contributions of new exotic quarks to quark mixing,JHEP 09 (2000) 011[hep-ph/0007316] [INSPIRE].
[14] N. Vignaroli, ∆F = 1 constraints on composite Higgs models with LR parity,Phys. Rev. D
86 (2012) 115011[arXiv:1204.0478] [INSPIRE].
[15] J. Nutter, R. Schwienhorst, D.G.E. Walker and J.-H. Yu, Single top production as a probe of B-prime quarks,Phys. Rev. D 86 (2012) 094006[arXiv:1207.5179] [INSPIRE].
[16] R.S. Chivukula, E.H. Simmons and N. Vignaroli, A flavorful top-coloron model,Phys. Rev.
D 87 (2013) 075002[arXiv:1302.1069] [INSPIRE].
[17] C.T. Hill and E.H. Simmons, Strong dynamics and electroweak symmetry breaking, Phys.
Rept. 381 (2003) 235[Erratum ibid. 390 (2004) 553] [hep-ph/0203079] [INSPIRE].
[18] U. Baur, I. Hinchliffe and D. Zeppenfeld, Excited quark production at hadron colliders,Int. J.
JHEP02(2016)110
[19] S. Weinberg, Implications of dynamical symmetry breaking,Phys. Rev. D 13 (1976) 974
[INSPIRE].
[20] L. Susskind, Dynamics of spontaneous symmetry breaking in the Weinberg-Salam theory,
Phys. Rev. D 20 (1979) 2619[INSPIRE].
[21] C.T. Hill, Quark and lepton masses from renormalization group fixed points,Phys. Rev. D
24 (1981) 691[INSPIRE].
[22] R.S. Chivukula, B.A. Dobrescu, H. Georgi and C.T. Hill, Top quark seesaw theory of
electroweak symmetry breaking,Phys. Rev. D 59 (1999) 075003[hep-ph/9809470] [INSPIRE].
[23] C. Cheung, A.L. Fitzpatrick and L. Randall, Sequestering CP-violation and GIM-violation with warped extra dimensions,JHEP 01 (2008) 069[arXiv:0711.4421] [INSPIRE].
[24] A.L. Fitzpatrick, G. Perez and L. Randall, Flavor anarchy in a Randall-Sundrum model with 5D minimal flavor violation and a low Kaluza-Klein scale,Phys. Rev. Lett. 100 (2008)
171604[arXiv:0710.1869] [INSPIRE].
[25] C. Bini, R. Contino and N. Vignaroli, Heavy-light decay topologies as a new strategy to discover a heavy gluon,JHEP 01 (2012) 157[arXiv:1110.6058] [INSPIRE].
[26] ATLAS collaboration, Search for single b∗-quark production with the ATLAS detector at √
s = 7 TeV, Phys. Lett. B 721 (2013) 171[arXiv:1301.1583] [INSPIRE].
[27] ATLAS collaboration, Search for pair and single production of new heavy quarks that decay to aZ boson and a third-generation quark in pp collisions at√s = 8 TeV with the ATLAS detector,JHEP 11 (2014) 104[arXiv:1409.5500] [INSPIRE].
[28] ATLAS collaboration, Search for production of vector-like quark pairs and of four top quarks in the lepton-plus-jets final state inpp collisions at√s = 8 TeV with the ATLAS detector,
JHEP 08 (2015) 105[arXiv:1505.04306] [INSPIRE].
[29] ATLAS collaboration, Search for vector-like B quarks in events with one isolated lepton, missing transverse momentum and jets at √s = 8 TeV with the ATLAS detector,Phys. Rev.
D 91 (2015) 112011[arXiv:1503.05425] [INSPIRE].
[30] ATLAS collaboration, Analysis of events with b-jets and a pair of leptons of the same charge inpp collisions at√s = 8 TeV with the ATLAS detector,JHEP 10 (2015) 150
[arXiv:1504.04605] [INSPIRE].
[31] CMS collaboration, Search for heavy quarks decaying into a top quark and a W or Z boson using lepton + jets events inpp collisions at√s = 7 TeV,JHEP 01 (2013) 154
[arXiv:1210.7471] [INSPIRE].
[32] CMS collaboration, Search for heavy bottom-like quarks in 4.9 inverse femtobarns of pp collisions at √s = 7 TeV,JHEP 05 (2012) 123[arXiv:1204.1088] [INSPIRE].
[33] CMS collaboration, Search for pair-produced vector-like B quarks in proton-proton collisions at√s = 8 TeV,arXiv:1507.07129[INSPIRE].
[34] CMS collaboration, Search for the production of an excited bottom quark decaying to tW in proton-proton collisions at√s = 8 TeV,JHEP 01 (2016) 166[arXiv:1509.08141] [INSPIRE].
[35] ATLAS collaboration, Search for new phenomena in the dijet mass distribution using p− p collision data at√s = 8 TeV with the ATLAS detector,Phys. Rev. D 91 (2015) 052007
[arXiv:1407.1376] [INSPIRE].
[36] ATLAS collaboration, The ATLAS experiment at the CERN Large Hadron Collider, 2008
![Table 1. Cross-section times branching ratio for pp → Bq → Wt for different B masses and coupling values λ at a centre-of-mass energy of √ s = 8 TeV [10, 14]](https://thumb-eu.123doks.com/thumbv2/5dokorg/4242998.93529/3.892.313.580.419.600/table-cross-section-branching-different-masses-coupling-values.webp)
![Table 2. Cross-section times branching ratio for b ∗ → Wt for different b ∗ masses and b ∗ Wt couplings [15] at a centre-of-mass energy √](https://thumb-eu.123doks.com/thumbv2/5dokorg/4242998.93529/4.892.270.624.122.328/table-cross-section-branching-different-couplings-centre-energy.webp)