Technical Report TR13-8
Ag
ricultural
Experiment Station
College of Agricultural Sciences Department of Soil and Crop SciencesSouthwestern Colorado Research Center Colorado State University Extension
Southwestern Colorado
Research Center
2012 Results
ii
Colorado State University
Agricultural Experiment Station
Southwestern Colorado Research Center
2012 Results
Editor: Abdel F. Berrada, Senior Research Scientist & Manager Colorado State University
Southwestern Colorado Research Center Yellow Jacket, Colorado
Cover photo shows the winter wheat variety trial (foreground) at the Southwestern Colorado Research Center. Photo taken on July 11, 2012 by Abdel Berrada.
Acknowledgments
The following individuals contributed to the research, demonstration or outreach programs at the Southwestern Colorado Research Center (SWCRC) in 2012:
Dr. Scott Haley and Dr. Jerry Johnson of CSU Ft. Collins
Tom Hooten and Kim Dillivan of CSU Extension in Montezuma and Dolores Counties Joel Schneekloth of CSU Extension at Akron, CO
Bob Hammon of CSU Extension at Grand Junction, CO Dr. Ron Godin of CSU Extension at Delta, CO
Denis Reich of CSU Extension at Grand Junction, CO Michael Stamm of KSU
Cara Gildar of the San Juan USFS/BLM
David McCart, Chairman of SWCRC’s advisory board
SWCRC staff: Jerry, Amin, and Neeta. Amin assisted with the preparation of this report.
The institutions and companies that provided seeds or funding to the research center include:
Dolores Water Conservancy District
Southwestern Colorado Water Conservation District National Sunflower Association
Cal West, SeedTec, Syngenta, Triumph, Pioneer Hybrid, and Monsanto This report was reviewed by Dr. Ken Barbarick and Dr. Gary Peterson.
iii
Disclaimer
Mention of a trademark or proprietary product does not constitute endorsement by the Colorado Agricultural Experiment Station.
Colorado State University is an equal opportunity/affirmative action institution and complies with all Federal and Colorado State laws, regulations, and executive orders regarding
affirmative action requirements in all programs. The Office of Equal Opportunity is located in 101 Student Services. In order to assist Colorado State University in meeting its
affirmative action responsibilities, ethnic minorities, women, and other protected class members are encouraged to apply and to so identify themselves.
iv
Table of Contents
Soil & Climate at the Southwestern Colorado Research Center ... 1
Summary of the Main Results ... 3
2010-2012 Dryland Winter Wheat Variety Trials at Yellow Jacket, CO1 ... 5
2011-2012 Dryland National Winter Canola at Yellow Jacket, CO1 ... 8
2012 Dryland Safflower Variety Trial Results1 ... 11
2012 Irrigated Safflower Variety Trial1 ... 13
Evaluation of Corn Hybrids for Drought Tolerance ... 15
2012 Spring Wheat Variety Trial ... 23
Evaluation of Dryland Crop Rotations that Include Sunflower: 2012 Result Summary ... 25
Boosting Sunflower Production in SW Colorado with Supplemental Irrigation: 2012 Result Summary ... 28
Yellow Jacket Fruit Tree and Vineyard Research and Demonstration Project: 2012 Report ... 34
Annual Meeting of the Advisory Committee of CSU-Southwestern Colorado Research Center ... 41
List of Tables
Table 1. Results of the 2010-2012 Dryland Winter Wheat Variety Trials. ... 5Table 2. Results of the 2011-2012 Dryland National Winter Canola Trial. ... 8
Table 3. Results of the 2012 Dryland Safflower Variety Trial. ... 11
Table 4. Results of the 2012 Irrigated Safflower Variety Trial. ... 13
Table 5. Corn trial information... 17
Table 6. Corn trial water input. ... 18
Table 7. Corn Yield. ... 18
Table 8. Corn height. ... 20
Table 9. Kernels per ear. ... 21
Table 10. Weight per kernel. ... 21
Table 11. Ears per plant. ... 22
Table 12. Ears per acre. ... 22
Table 13. Results of the 2012 Spring Wheat Variety Trial. ... 23
Table 14. Crop information. ... 25
Table 15. 2012 Seed Yield and Test Weight. ... 26
Table 16. Soil moisture content and soil test NO3-N prior to planting of spring crops. ... 27
Table 17. Irrigation treatments. ... 28
Table 18. Irrigation and evapotranspiration for each variety and irrigation treatment. ... 28
v
Table 20. Sunflower response to irrigation and N rate in 2012. ... 30
Table 21. 2012 Production Information-- Southwest Colorado Fruit Tree and Vineyard Demonstration Project... 39
List of Figures
Figure 1. 2010 to 2012 and 30-yr (1981-2010) monthly precipitation at Yellow Jacket, CO .... 1Figure 2. 1981-2010 average monthly minimum and maximum temperatures at Yellow Jacket, CO ... 2
Figure 3. Photo of the dryland winter wheat variety trial taken on July 11, 2012 by Abdel Berrada. ... 7
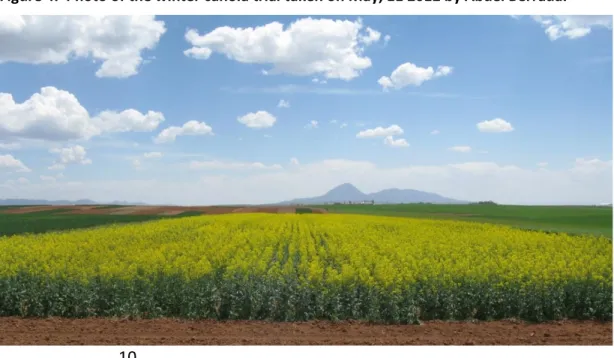
Figure 4. Photo of the winter canola trial taken on May, 11 2012 by Abdel Berrada. ... 10
Figure 5. Photo of dryland safflower taken on August 6, 2012 by Abdel Berrada. There are gaps between some plants due to poor germination in those areas. ... 12
Figure 6. Photo of irrigated safflower taken on August 6, 2012 by Abdel Berrada. The variety trial is near the center of the image, but it is hard to separate it out from the rest of the safflower field. ... 14
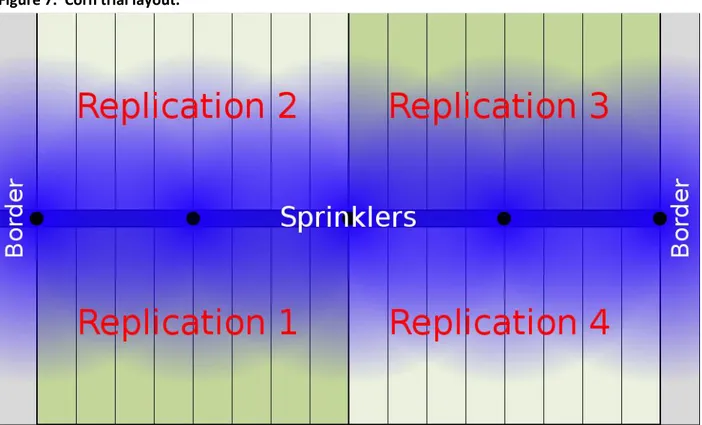
Figure 7. Corn trial layout. ... 16
Figure 8. Corn yield response to water input. ... 19
Figure 9. Corn height. ... 20
Figure 10. Photo of spring wheat taken on August 21, 2012 by Abdel Berrada. A significant amount of pigweed can be seen which caused reduced yields. ... 24
Figure 11. Photo of the dryland crop rotation trial taken on August 6, 2012 by Abdel Berrada. ... 26
Figure 12. Oct. 2011 thru Sept. 2012 precipitation at Yellow Jacket and 30-yr. averages. ... 27
Figure 13. Average seed yields and precipitation efficiencies (PPUE) in 2012. ... 32
Figure 14. Photo of sunflower taken on July 30, 2012 by Abdel Berrada. The image is centered on the short sunflower variety s870HCL. The irrigation treatment is I-2. Part of the drip irrigation system can be seen in the foreground. ... 32
Figure 15. View of the sunflower trial at bloom. Photo taken on August 9, 2012 by Abdel Berrada. ... 33
Figure 16. U-PICK Day. Master Gardeners (persons wearing orange vests) were on hand to answer customer questions. Photo taken by Abdel Berrada ... 34
1
Soil & Climate at the Southwestern Colorado Research Center
Soil
The principal soil type at the Research Center is Wetherill loam (fine-silty, mixed, superactive, mesic Aridic Haplustalfs). The Wetherill series is made up of generally deep well drained soils, located on mesas and hills. These soils were formed from sandstone material transported by wind from the Southwest. They tend to be reddish on the surface and generally have low organic matter (around 1.0%). Their water holding capacity ranges from approximately 1.8 to 2.0 inches/ft. Soil pH at the SWCRC is around 7.5. The terrain in southwestern Colorado is generally rolling. Slopes vary from 1 to 12% and the elevation from less than 6,000 ft. to above 7,000 ft. The potential exists for significant wind and water erosion on bare ground, especially in the spring.
Precipitation & temperature
The 30-year (1981-2010) average precipitation at Yellow Jacket is 15.9 inches. The average annual snowfall is 68.1 inches (30-year average from 1971-2000). June is the driest month and August is the wettest month. Average monthly minimum and maximum temperatures are shown in Figure 2. The frost-free period is 100 to 120 days. The Research Center lies at an elevation of 6900 ft., latitude 37°32’ N and longitude 108°44’ W. The yearly precipitation data is from the CoAgMet (Colorado Agricultural Meteorology) station at the SWCRC. It does not account for all the moisture from snow, since the station uses a simple tipping bucket rain gauge to measure precipitation. Precipitation in 2012 was 8.67 inches and was below average every month except for July and August (Figure 1).
Figure 1. 2010 to 2012 and 30-yr (1981-2010) monthly precipitation at Yellow Jacket, CO1
1
30 year average was obtained from http://www.wrcc.dri.edu/cgi-bin/cliMAIN.pl?co9275 . Data from 2010-2012 is from http://www.coagmet.com/ (Yellow Jacket station).
0.00 0.50 1.00 1.50 2.00 2.50 3.00 3.50
Jan Feb Mar Apr May Jun Jul Aug Sep Oct Nov Dec
in
ch
e
s
2
Figure 2. 1981-2010 average monthly minimum and maximum temperatures at Yellow Jacket, CO
0 10 20 30 40 50 60 70 80 90 100
Jan Feb Mar Apr May Jun Jul Aug Sep Oct Nov Dec
Tem p e ratu re (o F)
3
Summary of the Main Results
Abdel Berrada2
Dryland Winter Wheat Variety Trial
The winter wheat yields averaged 27.4 bu/acre, which was a low yield due to the dry weather. The experimental line CO050173 had the highest yield at 31.6 bu/acre. This entry also had the top yield in 2010-2011. The two common hard red winter wheat varieties in southwestern Colorado—Fairview and Deloris—had yields of 26.0 and 25.7 bu/acre, respectively. Grain protein averaged 15.5% (Table 1).
Irrigated Spring Wheat Variety Trial
Spring wheat yields averaged 39.4 bu/acre, which is unusually low due to poor weed control and dry and cool conditions in the spring. The variety Kelse had the highest yield at 45.3 bu/acre, but the yield difference between the top ten varieties was not statistically significant. Grain protein averaged 16.5% (Table 13).
Dryland Winter Canola Variety Trial
Winter canola yield averaged 945 lb/acre. The variety HPX-7228 had the highest seed yield at 1311 lb/acre and the lowest oil content at 33.9%. Durola had the highest oil content at 39.2% but only produced 802 lb/acre. Winter survival was very good for most varieties, averaging 97%. Seed shattering was minimal with an average of only 1% shattered. Fall stand (lack of gaps after the canola emerged) ranged from a poor stand rated at 6 out of 10 for the variety 46W99, to an excellent stand rated 10 out of 10 for the varieties Hybrirock and Durola. The average 50% bloom date was May 7, 2012. The average date of reaching 90% seed maturity was June 27, 2012 (Table 2).
Evaluation of Dryland Crop Rotations that Include Sunflower
Winter wheat yields averaged 26 to 33 bu/acre (Table 15). Spring planted crops including dry bean, corn, safflower, and sunflower had low yields due to low soil moisture and dry weather. Damage to safflower was mostly from ravens. The sunflower did not germinate in certain areas, causing large gaps in some rows. Corn and some dry bean plots were not harvested.
Boosting Sunflower Production in SW Colorado with Supplemental Irrigation
Sunflowers irrigated over the full season yielded the most at 2,715 lb/acre. However, sunflowers that received pre-planting irrigation plus irrigation at growing stage R-1 through stage R-6 yielded 88% as much as the full irrigation treatment with only 60% the amount of irrigation water. The standard-height sunflower hybrid Mycogen H449CLDM outperformed the short-stature hybrid Triumph s870HCL at all irrigation levels. The full irrigation treatment produced the greatest seed oil concentration of 43.8%, significantly more than the treatments
2
4
with limited irrigation. Mycogen 8H449CLDM and Triumph s870HCL averaged 43.2% and 41.9% oil content, respectively (Table 20).
Nitrogen application rates of 0 to 90 lb N/acre had no significant effect on seed yield, plant height, seed weight or test weight. The lack of yield response to N fertilizer may have been due to adequate residual N in the soil below the three foot depth that was sampled.
Dryland Safflower Variety Trial
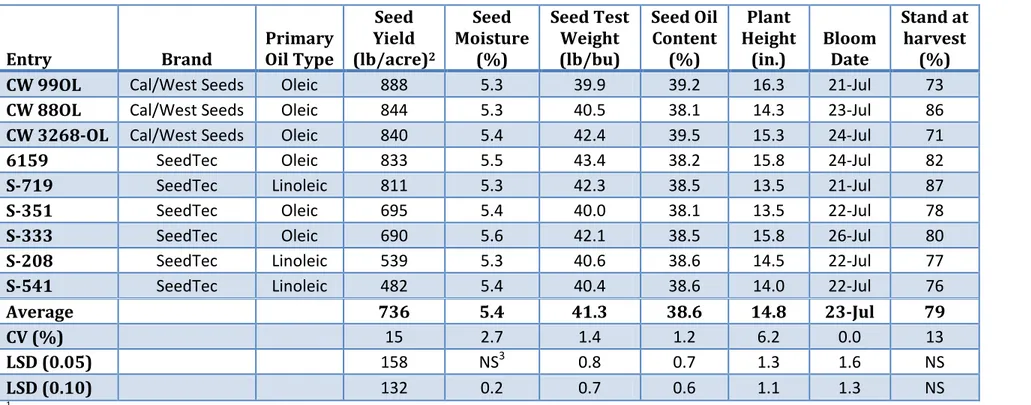
Safflower was planted into a dry seedbed, plus there was little precipitation in May and June, which negatively affected germination and emergence. Crop stand at harvest averaged 79%. Seed yield averaged 736 lb/acre, which was below previous years’ averages ( Berrada, TR11-04, 2011). The variety CW 99OL had the highest yield at 888 lb/acre. However, the difference in yield between the top five varieties was not statistically significant. Seed oil content averaged 38.6% and the average 50% bloom date occurred on July 23rd (Table 3).
Irrigated Safflower Variety Trial
Irrigated safflower yields averaged 2734 lb/acre, which is about four times more than the dryland safflower yield. The variety CW 3268-OL had the highest yield at 3037 lb/acre, but the yield differences between the varieties were not statistically significant. Average seed oil content was 38.7% and the average 50% bloom date occurred on July 30th (Table 4).
Evaluation of Corn Hybrids for Drought Tolerance
A preliminary study was conducted in 2012 to test the response of eight corn hybrids to water stress with a line-source irrigation system, whereby the irrigation amount decreases as the distance from the sprinkler line increases. Three of the hybrids were specifically bred for improved drought tolerance. Irrigation plus rainfall (precipitation) amounts ranged from 23.6 down to 6.6 in., of which 3.9 in. came from rain. Grain yield decreased significantly as water input decreased, as did plant height (Figures 8 & 9). Kernel weight was similar at 6, 18, and 30 ft. from the sprinkler line and was significantly lower at 24 and 54 ft. (Table 10). There were no significant differences between corn hybrids in grain yield, plant height, or kernel weight nor was there a significant hybrid by distance interaction. In this first year of the study, there was no clear advantage of the hybrids with the drought tolerance traits over the ones that did not have the so-called drought genes.
5
2010-2012 Dryland Winter Wheat Variety Trials at Yellow Jacket, CO
1Table 1. Results of the 2010-2012 Dryland Winter Wheat Variety Trials.
Crop season 2011-2012 2010-20112
Entry name Type3
Grain Yield (bu/acre)4 Grain Test Weight (lb/bu) Grain Protein (%) 50% Heading Date Grain Yield (bu/acre)4 Grain Test Weight (lb/bu) Grain Protein (%) CO050173 HRW 31.6 57.5 15.4 25-May 62.7 55.8 16.2 Brawl CL Plus HRW-CL2 30.6 57.9 15.5 23-May 61.8 56.5 16.3 TAM 112 HRW 30.4 57.3 15.9 23-May 57.5 55.3 15.5 Curlew HRW 29.9 56.6 16.0 30-May 49.0 51.1 16.9 Denali HRW 29.4 57.3 15.0 29-May 54.4 53.9 16.2 Thunder CL HWW-CL 28.9 57.4 14.3 24-May 52.9 55.2 14.3 CO050337-2 HRW 28.7 56.5 15.6 29-May 47.0 52.4 17.1 Cowboy HRW 28.5 56.0 15.4 29-May 53.3 52.9 16.1 Byrd HRW 28.2 56.5 15.5 25-May 48.3 53.0 14.3 Lucin CL HRW-CL 28.0 57.1 15.4 1-Jun 42.1 52.9 17.1 CO07W245 HWW 27.9 57.4 15.1 28-May NA NA NA Snowmass HWW 27.8 55.2 15.3 25-May 55.6 54.2 14.8 IDO816 HRW 27.1 55.6 15.6 3-Jun 48.4 51.2 16.0 CO050233-2 HRW-CL 26.8 56.5 16.2 31-May 54.1 52.3 16.8 Above HRW-CL 26.7 56.5 14.6 25-May 55.4 54.2 14.3 UI SRG HRW 26.5 55.7 15.4 1-Jun 50.1 50.2 17.1 CO05W111 HWW 26.4 58.3 15.5 31-May 52.0 55.0 16.6 UI Silver HWW 26.1 59.1 15.1 1-Jun 50.4 54.8 15.9 Fairview HRW 26.0 56.9 15.2 31-May 46.0 51.8 15.9
6
Crop season 2011-2012 2010-20112
Entry name Type3
Grain Yield (bu/acre)4 Grain Test Weight (lb/bu) Grain Protein (%) 50% Heading Date Grain Yield (bu/acre)4 Grain Test Weight (lb/bu) Grain Protein (%) Deloris HRW 25.7 56.8 15.6 2-Jun 46.3 53.0 17.2 Hatcher HRW 25.1 56.2 15.4 24-May 58.3 52.3 15.0 UI Darwin HWW 24.9 57.6 15.8 31-May 52.7 56.0 16.3 Ripper HRW 24.3 54.2 16.5 23-May 56.8 53.3 15.7 UI LHS HWW 23.0 56.5 16.7 6-Jun NA NA NA Mean 27.4 56.7 15.5 28-May 51.1 53.2 15.9 CV % 9.7 1.8 3.2 1 11.2 2.5 3.3 LSD.05 3.7 1.4 1.0 2 9.4 2.2 1.1 LSD.30 2 0.7 0.5 1 NA NA NA 1
The trial was conducted at CSU’s Southwestern Colorado Research Center in a RCB design with four replications. Plot size 6 ft x 40 ft.
2 Means and statistics for 2010-2011 are for 29 entries.
3 HRW: Hard Red Wheat; HWW: Hard White Wheat; CL: Clearfield (resistant to ‘Beyond’ herbicide). 4
7
Trial information
Crop season 2011-2012 2010-2011
Previous crop Summer fallow Summer fallow
Seeding date September 29, 2011 September 30, 2010
Seeding rate 700,000 seeds/A 700,000 seeds/A
Harvest date July 11, 2012 July 20, 2011
Fertilizer applied None 15 lb N + 73 lb P2O5/A on September 2, 2010
Pesticide applied 2.4-D Amine @1.12 pt/A on April 21, 2012 None
Rainfall (Oct. – June) 6.6 in. (58.3 % of normal) 9.4 in. (83.7 % of normal)
8
2011-2012 Dryland National Winter Canola at Yellow Jacket, CO
1Table 2. Results of the 2011-2012 Dryland National Winter Canola Trial.
Entry Seed yield2 lb/acre Seed moisture % Test weight lb/bu Plant height in. Fall stand 0-10 Winter survival % 50% Bloom
date MaturitySeed 3&4
Seed shattering5 % Oil 6 % HPX-7228 1311 6.1 52.6 40 8 97 5-May 178 1 33.9 MH 09H19 1239 5.9 51.8 39 9 100 7-May 179 1 36.4 Hybrirock 1135 6.1 52.3 39 10 96 7-May 179 1 35.7 TCI805 1124 6.1 51.2 36 9 100 7-May 177 1 36.5 Riley 1116 5.9 51.5 34 9 100 7-May 178 1 36.3 Baldur 1103 6.2 53.2 38 9 99 7-May 179 1 36.3 MH 07J14 1086 6.1 51.6 37 9 100 7-May 180 1 35.5 Rossini 1075 5.8 51.3 34 9 99 2-May 178 0 36.9 06.UIWC.1 1065 5.9 52.5 35 9 100 5-May 178 0 35.2 Safran 1055 5.9 51.0 36 9 96 7-May 171 0 36.9 Sitro 1052 6.1 51.5 36 9 97 7-May 178 0 36.2 TCI806 1021 5.8 51.1 37 9 97 7-May 178 1 35.6 Chrome 1009 5.9 51.6 34 8 99 7-May 178 1 37.1 WRH 350 992 5.9 51.1 36 9 96 7-May 180 1 35.1 Visby 943 5.9 51.8 39 7 92 7-May 179 1 36.0 Flash 943 6.0 52.0 42 9 98 8-May 172 1 35.7 Wichita 940 6.0 51.5 37 8 98 7-May 178 1 36.4 MH 06E10 927 6.1 52.7 38 8 99 8-May 178 1 36.6 05.UI.5.6.33 912 5.8 50.1 37 9 96 7-May 180 0 34.5 DKW41-10 911 6.0 52.2 31 9 99 4-May 178 0 34.6 Dynastie 903 5.8 50.9 40 7 82 7-May 162 0 36.9 DKW44-10 903 6.2 52.5 34 9 100 7-May 179 1 34.9
9 Entry Seed yield2 lb/acre Seed moisture % Test weight lb/bu Plant height in. Fall stand 0-10 Winter survival % 50% Bloom
date MaturitySeed 3&4
Seed shattering5 % Oil 6 % HPX-7341 880 6.1 51.8 36 9 99 7-May 178 1 36.2 Ulura 879 6.0 53.2 41 8 97 7-May 179 2 36.4 Hornet 876 5.8 52.2 38 7 96 7-May 180 0 35.2 Amanda 858 6.0 52.3 33 9 100 8-May 180 0 35.4 HyClass125W 857 5.9 50.8 34 9 100 7-May 180 1 36.5 Durola 802 6.1 50.7 37 10 98 7-May 178 1 39.2 HyClass115W 801 6.1 52.0 35 9 97 7-May 178 1 35.9 DKW46-15 798 5.9 51.3 37 8 90 7-May 179 1 35.6 46W94 797 6.0 52.7 37 8 97 7-May 178 1 34.9 DKW47-15 780 6.1 51.5 34 9 99 7-May 178 1 35.1 HyClass154W 777 6.2 51.3 35 8 99 7-May 180 1 34.9 Rumba 777 5.9 52.7 37 6 97 7-May 180 1 35.6 46W99 772 6.0 51.9 35 6 90 7-May 178 1 35.4 Claremore 607 6.0 50.7 36 9 100 7-May 180 0 36.3 Average 945 6 52 37 9 97 7-May 178 1 35.9 CV (%) 13 3.8 1.8 6 9 5 1 2 73 1.9 LSD.05 199 NS 1.5 4 1 8 1 7 1 1.3 1This trial was conducted at CSU’s Southwestern Colorado Research Center in a randomized complete block design (RCBD) with three replications. Plot size: 6
ft. x 30 ft. For more information, contact Abdel Berrada at abdel.berrada@colostate.edu
2
Seed yield adjusted to 9% moisture
3
Number of days from January 1, 2012
4
Date at which 90% of the plants have reached a mature color
5
Shattering was mostly due to bird feeding
10
Trial information
Previous crop: Summer fallow Planted: 9/2/2011 @ 5.3 lb/acre Harvested: 7/10/2012
Pesticide: None
Weed control: Hoeing as needed Fertilizer application: None Irrigation application: None
Precipitation amount (from rain & snow) from September 2011 through June 2012: 7.8 in. (61% of 30-yr average)
Comments
The seedbed at planting was dry. The first significant rainfall (0.33 in.) after planting occurred on 13-Sept. The fall stand averaged 9.0 on a scale of 0 (no stand) to 10 (excellent stand) but some plots had ratings of 6 and 7. The plot area was weed-free at planting but became infested with weeds, mostly
shepherd’s purse and prickly lettuce in late winter-early spring, which required hand hoeing since no pre-plant herbicide was applied. Precipitation from rain and snow from planting through harvest maturity was 61% of normal. Only October and February had normal precipitation. Total precipitation from March through June was 0.7 in. or 19% of normal, which negatively impacted seed yield. Average seed yield was 945 lb/acre with a low of 607 and a high of 1311 lb/acre. No
irrigation water was applied prior to seeding or throughout the growing season. There was very little pod shattering—which was mostly due to bird feeding—and no lodging.
11
2012 Dryland Safflower Variety Trial Results
1Table 3. Results of the 2012 Dryland Safflower Variety Trial.
Entry Brand Primary Oil Type
Seed Yield (lb/acre)2 Seed Moisture (%) Seed Test Weight (lb/bu) Seed Oil Content (%) Plant Height
(in.) Bloom Date
Stand at harvest
(%) CW 99OL Cal/West Seeds Oleic 888 5.3 39.9 39.2 16.3 21-Jul 73
CW 88OL Cal/West Seeds Oleic 844 5.3 40.5 38.1 14.3 23-Jul 86
CW 3268-OL Cal/West Seeds Oleic 840 5.4 42.4 39.5 15.3 24-Jul 71
6159 SeedTec Oleic 833 5.5 43.4 38.2 15.8 24-Jul 82
S-719 SeedTec Linoleic 811 5.3 42.3 38.5 13.5 21-Jul 87
S-351 SeedTec Oleic 695 5.4 40.0 38.1 13.5 22-Jul 78
S-333 SeedTec Oleic 690 5.6 42.1 38.5 15.8 26-Jul 80
S-208 SeedTec Linoleic 539 5.3 40.6 38.6 14.5 22-Jul 77
S-541 SeedTec Linoleic 482 5.4 40.4 38.6 14.0 22-Jul 76
Average 736 5.4 41.3 38.6 14.8 23-Jul 79 CV (%) 15 2.7 1.4 1.2 6.2 0.0 13
LSD (0.05) 158 NS3 0.8 0.7 1.3 1.6 NS
LSD (0.10) 132 0.2 0.7 0.6 1.1 1.3 NS
1
Trial conducted at Colorado State University’s Southwestern Colorado Research Center
2
Adjusted to 10% moisture
3
Not significant at the specified probability level
Trial information
Seeded: May 2, 2012 @ 348,480 seeds/acre Harvested: September 14, 2012
Previous crop: Summer fallow
Fertilizer: None
Herbicide: Treflan @ 1.5 pt/acre on 4/24/12 Rainfall (May - Aug.): 3.76 in. (74% of normal)
12
Comments: Safflower was planted into a dry seedbed plus there was hardly any precipitation in May and June, which negatively affected germination and emergence. Crop stand at harvest averaged 79%. Seed yield was below previous years’ averages ( Berrada, TR11-04, 2011).
Figure 5. Photo of dryland safflower taken on August 6, 2012 by Abdel Berrada. There are gaps between some plants due to poor germination in those areas.
13
2012 Irrigated Safflower Variety Trial
1Table 4. Results of the 2012 Irrigated Safflower Variety Trial.
Entry Brand Oil Type Primary Seed Yield (lb/acre)2
Seed Moisture (%) Seed Test Weight (lb/bu) Seed Oil Content (%) Plant Height
(in.) Bloom Date CW 3268-OL Cal/West Seeds Oleic 3037 5.2 39.4 37.8 22.8 1-Aug
S-719 SeedTec Linoleic 2962 4.7 40.2 39.9 21.3 29-Jul
6159 SeedTec Oleic 2903 4.8 40.5 38.8 23.8 2-Aug
S-351 SeedTec Oleic 2886 4.8 38.3 38.4 19.8 30-Jul
S-333 SeedTec Oleic 2711 5.2 41.1 38.1 23.3 2-Aug
S-208 SeedTec Linoleic 2616 4.6 40.8 38.9 21.3 28-Jul
CW 99OL Cal/West Seeds Oleic 2613 4.8 36.1 39.4 22.5 29-Jul
CW 88OL Cal/West Seeds Oleic 2502 4.5 38.1 37.6 23.0 1-Aug
S-541 SeedTec Linoleic 2373 4.8 40.2 39.9 22.8 30-Jul
Average 2734 4.8 39.4 38.7 22.3 30-Jul CV (%) 11.2 5.0 3.7 2.0 8.2 0.0
LSD (0.05) NS3 0.3 2.1 1.1 2.7 2.9
LSD (0.10) 369 0.3 1.8 1.0 2.2 2.4
1
Trial conducted at Colorado State University’s Southwestern Colorado Research Center
2 Adjusted to 10% moisture 3
Not significant at P=0.05
Trial information
Seeded: May 1, 2012 @ 479,160 seeds/acre
Harvested: October 3, 2012 Previous crop: Spring wheat
Fertilizer: 50 lb N + 29 lb P2O5 + 6 lb Zn/acre on 4/18/12
Herbicide: Sonalan @ 2.5 pt/acre on 4/23/12
Irrigation: Approximately 14 in. with sideroll in six applications Rainfall (May - Sept.): 4.38 in. (66% of normal)
14
Figure 6. Photo of irrigated safflower taken on August 6, 2012 by Abdel Berrada. The variety trial is near the center of the image, but it is hard to separate it out from the rest of the safflower field.
15
Evaluation of Corn Hybrids for Drought Tolerance
Principal Investigator: Abdel Berrada3
Main collaborator (Co- PI): Denis Reich4
Introduction
Corn is a minor crop in southwestern Colorado. However, with advances in drought tolerance, the potential exists for an increase in acreage. In recent years, several corn hybrids were developed to withstand water stress better than “conventional” hybrids and yet perform well when water does not limit production. The drought tolerance of corn is enhanced through breeding (e.g., the so-called native gene approach) or with the use of molecular and transgenic techniques.
The amount and distribution of precipitation from rain and snow makes it a challenge to grow grain corn economically in southwestern Colorado, especially at the higher elevations. This could be overcome to a certain extent with the cultivation of short-season hybrids and hybrids that are specifically bred for improved drought tolerance. Production will be enhanced with supplemental irrigation. There are over 100,000 acres of irrigated land in Montezuma, Dolores, and La Plata Counties alone. The main field crop by far is alfalfa. Corn would be a good
alternative to spring wheat, oat, and pinto bean, in rotation with alfalfa. It would utilize residual N and water efficiently and may help increase soil organic matter in reduced till conditions, given the amount of dry matter (crop residues) it would generate.
The objective of this study was to test several corn hybrids for their response to water stress. Three of the hybrids had the so-called drought tolerance genes bred into them.
Methodology
Eight corn hybrids with or without genetic improvements for drought tolerance were tested in 2012 for their response to water stress. A line-source sprinkler irrigation system similar to the one described by Hanks5 et al. (1976) was used. With this system, the amount of irrigation water applied decreases as the distance from the sprinkler line increases, generally in a linear or near-linear fashion, depending on nozzle configuration. The entire trial received about 2 inches of irrigation on May 21, 2012 in order to improve corn germination. Daily crop ET data was obtained from the Yellow Jacket Colorado Agricultural Meteorology (CoAgMet) weather station, which is located at the SWCRC.
The following parameters were measured:
3
Senior Research Scientist/Manager, Colorado State University, Southwestern Colorado Research Center.
4 Water Resource Specialist, Western Region, Colorado State University Extension, Colorado Water Institute. 5
Hanks, R.J., J. Keller, V.P. Rasmussen, and G.D. Wilson. 1976. Line source sprinkler for continuous variable irrigation-crop production studies. Soil Sci. Soc. Am. J. 40: 426-429
16
The amount of irrigation water applied at 6, 18, 30, 42, and 54 ft. from the sprinkler line Rainfall amount
Plant height at physiological maturity
Number of ears per plant and per harvest area Number of kernels per ear at harvest
Kernel weight
Grain yield, moisture content and test weight
All eight corn hybrids were planted on May 17, 2012 at 29,870 seeds/acre in a randomized complete block design with four replications (Figure 7 and Table 5). Main plot size was 10 ft. (4-rows of corn) by 60 ft. on each side of the sprinkler line. Corn yield and yield components were measured from two 6-ft long (middle) rows centered at 6, 18, 30, 42, and 54 ft. from the sprinkler line.
17
Table 5. Corn trial information.
Location Yellow Jacket, CO
Previous crop Dry bean
Soil type Wetherill loam
Planting date 5/17/12
Planting rate (seeds/acre) 29,870
Row spacing 2.5 ft.
Rainfall (from planting to last irrigation date)
3.94 inches
Fertilizer 50.2 lb N + 28.6 lb P2O5 + 5.5 lb Zn/acre on 4/18/12
Herbicide Mad Dog (Glyphosate) @ 2 pint/acre on 6/7/12
Cultivation 6/15/12
Last irrigation date 9/14/12
Harvest date 10/17 to 10/19/12
Results
The total corn evapotranspiration from planting to Sept. 14th when all hybrids reached or exceeded physiological maturity was about 23.22 inches6. The average irrigation plus
precipitation at 6 feet from the sprinkler line was 23.6 inches (Table 6) which is fairly close to the total ET. The amount of water received decreases further from the sprinkler line, down to 6.6 inches at 54 feet away. Most of the water received at 54 feet away from the sprinkler line was from precipitation and pre-planting irrigation (6.60” = 3.94 “ precipitation + 2” pre-planting irrigation + 0.66 “ sprinkler line irrigation). Plots at the same distance north and south of the sprinkler line received similar amounts of irrigation with the exception of the distance of 42 ft. At 42 ft., the north side received 14.0” irrigation + precipitation while the south side received only 9.1”. This might have been due to wind, which typically blew from the south more than the north.
6
Source: http://www.coagmet.com/ . The evapotranspiration value on July 24, 2012 was missing so it was estimated based on values from the previous and following days.
18
Table 6. Corn trial water input.
Distance from the sprinkler line (ft.)
Irrigation + Precipitation (in.) Direction Average north south 6 24.3 22.9 23.6 18 20.9 20.4 20.7 30 17.5 17.0 17.2 42 14.0 9.1 11.6 54 7.2 6.0 6.6 Average 16.8 15.1 15.9
Grain yield decreased as water input decreased (Table 7 and Figure 8). The Hybrid DKC52-04 performed best on average, but the hybrid DKC43-10 had a substantially higher yield than the other hybrids in the lowest irrigation treatment. The yield differences were statistically significant between all irrigation treatments except between 6 and 18 feet from the sprinkler line. Corn in this trial was not managed for maximum yield, in terms, for example, of fertilizer application. There was no variation in production inputs, regardless of the distance from the sprinkler line.
Table 7. Corn Yield.
Hybrid MaturityRelative 2
Yield (bu/acre)1
Distance from sprinkler line (ft)
6 18 30 42 54 Average DKC52-04 102 176 165 143 122 73 136 DKC43-10 93 166 152 139 119 87 133 P0210HR3 102 169 161 144 118 65 132 P9690HR3 96 158 150 150 116 78 130 DKC46-20 96 167 163 139 110 67 129 P0876HR3 108 163 154 130 103 72 124 DKC43-48 93 156 151 133 105 71 123 DKC38-89 88 140 137 117 92 74 112 Average 162 a4 154 a 137 b 111 c 73 d 127 1 Adjusted to 15.5% seed moisture.
2
Relative maturity ratings are commonly based on comparisons among hybrids and may not reflect the actual number of days from planting to (harvest) maturity.
3 Has a drought resistance gene. 4
19
Figure 8. Corn yield response to water input.
The height of the corn plants generally decreased as water input decreased (Table 8 and 1 Numbers followed by the same letter are not significantly different at P = 0.05.
Figure 9), but the height at 6 feet and 18 feet from the sprinkler line was nearly the same. The height differences between different distances from the sprinkler line were statistically
significant except between 6 and 18 feet. Corn height was measured on October 16, 2012 and by that date some of the plants had become bent over. Some of the height measurements would have been taller if they had been taken at an earlier date.
0 5 10 15 20 25 0 20 40 60 80 100 120 140 160 180 6 18 30 42 54 Ir ri gation + Pr e ci p itat io n ( in ) Yi e ld (b u /ac )
Distance from sprinkler line (ft)
Yield @ 15.5% moisture (bu/ac) Irrigation + Precipitation (in)
20
Table 8. Corn height.
Hybrid
Plant height (in.) Distance from sprinkler line (ft)
6 18 30 42 54 Average P0876HR 106 110 95 70 41 84 DKC43-10 94 102 96 78 47 83 DKC43-48 105 105 93 67 35 81 P0210HR 107 106 97 55 33 80 DKC52-04 101 99 94 66 37 79 DKC38-89 94 94 85 70 47 78 DKC46-20 90 93 76 57 39 71 P9690HR 90 84 68 66 39 69 Average 98 a1 99 a 88 b 66 c 40 d 78 1
Numbers followed by the same letter are not significantly different at P = 0.05.
Figure 9. Corn height.
The number of kernels per ear is similar at 6, 18, and 30 feet from the sprinkler line (Table 9). There is a slight reduction 42 feet away and a substantial reduction at 54 feet. Kernel weight displays the same pattern: weight per kernel is about the same at 6, 18, and 30 feet from the sprinkler line (1
Includes all ears that had kernels, whether they were partially or completely filled. 0 5 10 15 20 25 0 20 40 60 80 100 120 6 18 30 42 54 Ir ri gati on + P rec ip itati on (in) Pl an t H e ig h t (i n )
Distance from sprinkler line (ft)
Plant height (in)
Irrigation + Precipitation (in)
21
Table 10). There is a slight reduction at 42 feet away and more significant reduction at 54 feet.
Table 9. Kernels per ear.
Hybrid
Kernels per ear1
Distance from sprinkler line (ft)
6 18 30 42 54 Average DKC43-10 476 436 471 503 404 458 P0876HR 463 449 480 472 371 447 P0210HR 463 462 469 437 361 438 DKC52-04 449 465 445 456 348 433 P9690HR 429 433 431 417 349 415 DKC46-20 451 452 451 419 293 413 DKC43-48 437 439 431 388 293 398 DKC38-89 390 415 408 402 345 392 Average 445 444 448 437 345 424
1 Includes all ears that had kernels, whether they were partially or completely filled.
Table 10. Weight per kernel.
Hybrid
Weight per kernel (g) Distance from sprinkler line (ft)
6 18 30 42 54 Average P9690HR 0.31 0.29 0.29 0.25 0.21 0.27 DKC43-10 0.29 0.30 0.28 0.25 0.22 0.27 DKC38-89 0.30 0.29 0.26 0.26 0.23 0.27 DKC46-20 0.29 0.28 0.27 0.25 0.21 0.26 P0210HR 0.28 0.28 0.29 0.25 0.19 0.26 DKC52-04 0.27 0.27 0.28 0.25 0.20 0.25 DKC43-48 0.26 0.27 0.26 0.23 0.21 0.25 P0876HR 0.26 0.27 0.25 0.22 0.19 0.24 Average 0.28 a1 0.28 a 0.27 a 0.25 b 0.21 c 0.26 1
Numbers followed by the same letter are not significantly different at P = 0.05.
The number of ears per plant steadily decreases as the distance from the sprinkler line
increases (Table 11). The hybrid DKC52-04 had the most ears per plant and the most ears per acre (Table 12).
22
Table 11. Ears per plant.
Hybrid
Ears per plant Distance from sprinkler line (ft)
6 18 30 42 54 Average DKC52-04 1.3 1.3 1.2 1.1 1.0 1.2 P0876HR 1.3 1.3 1.2 1.0 1.0 1.2 P9690HR 1.2 1.2 1.0 1.0 1.0 1.1 P0210HR 1.2 1.3 1.1 1.0 0.9 1.1 DKC43-10 1.3 1.2 1.1 1.0 0.9 1.1 DKC46-20 1.2 1.2 1.0 1.0 1.0 1.1 DKC43-48 1.2 1.1 1.1 1.0 1.0 1.1 DKC38-89 1.4 1.0 1.0 1.0 0.9 1.1 Average 1.3 1.2 1.1 1.0 0.9 1.1
Table 12. Ears per acre.
Hybrid
Ears per acre Distance from sprinkler line (ft)
6 18 30 42 54 Average DKC52-04 35,574 32,670 28,677 26,862 25,410 29,839 DKC43-48 32,670 30,855 28,677 27,588 27,225 29,403 P0876HR 34,122 31,944 27,588 25,047 25,410 28,822 DKC46-20 31,218 31,581 27,951 26,862 26,499 28,822 P9690HR 29,403 28,677 29,040 25,773 19,602 26,499 P0210HR 30,855 30,129 25,773 19,239 22,143 25,628 DKC43-10 28,677 27,951 25,047 22,143 22,506 25,265 DKC38-89 28,314 26,499 25,773 21,054 22,869 24,902 Average 31,354 30,038 27,316 24,321 23,958 27,397 Conclusions
Grain yield decreased significantly as water input decreased, as did plant height. Kernel weight was similar at 6, 18, and 30 ft. from the sprinkler line and significantly lower at 24 and 54 ft. There were no significant differences between the corn hybrids in grain yield, plant height, or kernel weight nor was there a significant hybrid by distance interaction. In this first year of the study, there was no clear advantage of the hybrids with the drought tolerance traits over the ones that did not have the so-called drought genes.
23
2012 Spring Wheat Variety Trial
Abdel Berrada7
Table 13. Results of the 2012 Spring Wheat Variety Trial.
Variety Type Grain yield (bu/acre)8 Grain Moisture (%) Grain Test Weight (lb/bu) Grain Protein (%) Kelse HRS 45.3 10.7 57.7 17.6 Advance HRS 44.2 11.3 56.6 16.5 IDO 858 HWS 44.1 11.3 56.7 17.9 Sylvan HRS 43.1 11 55.1 16.4 IDO 644 SWS 42.6 11.5 54.3 15.0 IDO694 HWS 42.2 13.4 56.6 15.6 IDO 686 SWS 40.6 12.2 56.3 15.2
IDO 599 (UI Stone) SWS 40.4 12 55.7 15.2
SY Soren HRS 40.4 11.3 56.2 17.5 WB-Paloma HWS 39.6 11 56.1 17.0 UI Winchester HRS 35.5 12 56.9 16.7 03S0253-7 HRS 35.2 12 55.5 16.3 IDO 669 SWS 34.9 12.3 53.8 15.4 IDO 377s HWS 34.8 10.3 53.6 17.9 Jefferson HRS 34.6 12.2 57.9 17.4 02S0178-1 HRS 33 11.2 57 16.8 Average 39.4 11.6 55.9 16.5 LSD.05 8.2 - 1.5 0.8 7
Senior Research Scientist/Manager, CSU-SWCRC, Yellow Jacket, CO.
8
24
Trial information
Location Yellow Jacket, CO
Previous crop Native plants
Soil type Cahona-Sharps-Wetherill complex
Planting date 4/30/2012
Seeding rate (seeds/acre) 1,200,000
Irrigation Sprinkler irrigation (siderolls) as need be
Precipitation (from planting to harvest)
3.74 inches
Fertilizer 100 lb N/acre + 57 lb P2O5/acre of 11-52-0 + 11 lb Zn/acre on
4/18/2012
Herbicide Sprayed 2,4-D at 1.2 pints/acre on 6/6/2012.
Harvest date 8/27/2012
Comments
The yield this year was unusually low due to poor weed control and dry and cool conditions in the spring.
Figure 10. Photo of spring wheat taken on August 21, 2012 by Abdel Berrada. A significant amount of pigweed can be seen which caused reduced yields.
25
Evaluation of Dryland Crop Rotations that Include Sunflower: 2012
Result Summary
Investigators: Abdel Berrada, Kim Dillivan, and Bob Hammon Sponsor: The National Sunflower Association
The main objective of this project is to test the effects of sunflower and other crops on soil and crop productivity in winter wheat-based dryland crop rotations in SW Colorado. The following crop rotations were tested in 2011-2012.
Winter Wheat-Fallow
Winter Wheat-Safflower-Fallow Winter Wheat-Sunflower-Fallow
Winter Wheat-Dry Bean-Sunflower-Fallow Winter Wheat-Dry Bean-Dry Bean-Fallow
Winter Wheat-Opportunity Crop-Sunflower-Opportunity Crop
The opportunity crop was corn in 2012. Before that it was camelina [Camelina sativa (L.) Crantz]. Each phase of each crop rotation is present every year and replicated three times in a RCBD. Plot size is 30 ft. x 167 ft. Minor adjustments were made to the crop rotations in 2011. Planting and harvest dates are shown in Table 14.
Table 14. Crop information.
Crop Variety Planting date Planting rate Unit Harvest date Corn DKC43-10 17-May 22,000 seeds/ac 10-Oct.
Dry bean Montrose 31-May 23,232 seeds/ac 18-Sept.1
Safflower CW 99OL 2-May 27 lb/ac 14-Sept.
Sunflower Triumph s671 24-May 17,294 seeds/ac 1-Nov.
Winter wheat Fairview 22-Sept-11 57 lb/ac 11-July
1Date at which dry beans were cut.
Spring crops seed yields were substantially below those obtained in 2011. Soil moisture at planting was low (Table 16) followed by below average rainfall (Figure 12), which resulted in poor stands and crop growth. In addition, safflower and sunflower suffered from bird and deer damage. Damage to safflower was mostly from ravens, which, to our knowledge, are the only birds in our area that can peck their way through the heavily spined safflower heads to the seeds, when other feed sources are scarce. Sunflower after camelina did the best with 628 lb/acre (Table 15) in spite of the fact that soil moisture at planting was less than for the other treatments (Table 16). Sunflower after dry bean averaged 412 lb/acre while sunflower after winter wheat produced a meager 245 lb/acre. In comparison, sunflower after summer fallow and sunflower after dry bean produced around 1200 lb/acre in 2011 ( Berrada, TR12-07, 2012).
26
Table 15. 2012 Seed Yield and Test Weight.
Crop in 2012
Previous crop Average seed yield lb/acre
(bu/ac)1
Test weight (lb/bu) 2011 2010
Corn Winter wheat Fallow2 18043 NA
Dry Bean Dry Bean Fallow -4 -
Dry Bean Winter Wheat Fallow 327 59.4
Safflower Winter Wheat Fallow 129 39.4
Sunflower Dry Bean Fallow 412 26.7
Sunflower Camelina Camelina 628 28.2
Sunflower Winter Wheat Fallow 245 29.6
Winter Wheat Fallow Dry Bean 1758 (29) 55.6
Winter Wheat Fallow Fallow 1959 (33) 57.8
Winter Wheat Fallow Safflower 1572 (26) 54.2
Winter Wheat Fallow Sunflower 1841 (31) 55.1
Figure 11. Photo of the dryland crop rotation trial taken on August 6, 2012 by Abdel Berrada.
1
Seed yields of dry bean, safflower, sunflower, and winter wheat were adjusted to 14%, 9%, 10%, and 12%, respectively.
2 Summer fallow 3
Dry matter. Corn produced very little grain due to drought and bird (ravens) damage.
4
27
Table 16. Soil moisture content and soil test NO3-N prior to planting of spring crops.
Crop in 2012 Crop in 2011 Available soil moisture (in.) in 0-3 ft1 lb NO3-N/A in 0-2 ft lb P0-2 ft 2O5/A in May 16, 2012 April 13, 2012 April 13, 2012 Dry Bean Dry Bean 1.9 85 53
Dry Bean Winter Wheat 2.0 37 55
Safflower Winter Wheat NA 50 55
Sunflower Dry Bean 1.7 98 55
Sunflower Camelina 1.3 46 47
Sunflower Winter Wheat 1.7 43 47
Corn Winter Wheat 2.3 37 47
Average 1.8 56 51
1
It wasn’t always possible to dig down to 3 feet so some of these values are estimated from the soil that could be obtained.
Figure 12. Oct. 2011 thru Sept. 2012 precipitation at Yellow Jacket and 30-yr. averages.
Nitrate-N in the top two feet of soil was highest after dry bean and average after winter wheat or camelina (Table 16). Under favorable conditions, 40 lb of available N/acre, after a non-legume crop, would produce close to 1700 lb of sunflower seeds/acre in our soils (High Plains Sunflower Production Handbook, Kansas State University, April 2009). Sunflower seed oil content was greatest after winter wheat (38.5%) or camelina (38.2%) and lowest after dry bean (35.0%), which is consistent with literature findings, i.e., that oil content decreases as N
availability increases. 0.0 0.5 1.0 1.5 2.0 2.5
Oct Nov Dec Jan Feb Mar Apr May Jun Jul Aug Sep
in
ch
e
s
28
Boosting Sunflower Production in SW Colorado with Supplemental
Irrigation: 2012 Result Summary
Investigators: Abdel Berrada and Joel Schneekloth Sponsor: The National Sunflower Association
The main objective of this study was to determine the response of two sunflower hybrids to four irrigation treatments and four N rates. The ground to be planted to sunflower was in proso millet in 2011. It was sprayed with Sonalan on April 23, 2012 at 2.5 pt/acre. Sunflower hybrids Mycogen 8H449 CLDM and Triumph s870HCL were planted on June 1st at 25,344
seeds/ac and harvested on October 31st. The Irrigation treatments are shown in Table 17. They were assigned to the main plots while sunflower hybrids were assigned to the sub-plots in a split-split plot RCBD with three replications. Ammonium nitrate (34-0-0) was applied at 0, 30, 60, and 90 lb N/acre to the designated plots on May 29th. It was broadcast with a hand-held fertilizer spreader and incorporated into the soil with a field cultivator. Water was applied with a wheel-line sprinkler irrigation unit (sideroll) prior to sunflower planting and with a subsurface drip irrigation system after planting.
Table 17. Irrigation treatments.
Irrigation
treatment Description Net irrigation depth (in.)1 Crop ET2 (in.)
I-1 Pre-plant irrigation (PPI) only 0.0 13.6
I-2 PPI + Full-season irrigation3 16.2 20.5
I-3 PPI+ Irrigation at R-1 to R-63 8.7 19.7
I-4 PPI + Irrigation at R-4 to R-63 4.5 17.0
1
Depth of irrigation after planting. Irrigation efficiency was assumed to be 90%. PPI was 2.5 in. Season rainfall was 4.4 in.
2
Crop evapotranspiration.
3
Water application to meet crop ET during the irrigation period. Reference ET was 33.1 in. The evapotranspiration value on July 24, 2012 was missing so it was estimated based on values from the previous and following days. Data source: http://www.coagmet.com/
Table 18. Irrigation and evapotranspiration for each variety and irrigation treatment.
Irrigation treatment
Net irrigation (in) Crop ET
8H449CLDM s870HCL 8H449CLDM s870HCL I-1 2.5 2.5 13.6 13.6 I-2 18.7 18.8 20.5 20.5 I-3 11.2 11.1 19.7 19.7 I-4 7.6 6.5 17.4 16.5 Average 10.0 9.7 17.8 17.6
29
Results
The full irrigation regime produced the highest seed yield of 2,721 and 2,708 lb/acre with H449CLDM and s870HCL, respectively (Table 20). Treatment I-3 produced 318 lb/acre less seed on average than I-2. Treatments I-4 and I-1 averaged 1547 and 965 lb/acre, respectively. Sunflower hybrid H449CLDM outperformed s870HCL at all irrigation levels. On average, I-1 produced the most seeds (in lb/ac) per inch of water (irrigation + rain) applied (Figure 13). Treatments I-3 and I-4 had similar precipitation use efficiencies (PPUE) while I-2 the lowest PPUE.
Seed weight was greatest at I-3 followed by I-2 and I-4. Treatment I-1 had the lowest seed weight overall (Table 20). Treatment I-2 had the highest seed oil content of 43.8%, significantly more than I-3 and I-4. Treatment I-1 had the lowest oil content. Mycogen 8H449CLDM and Triumph s870HCL averaged 43.2% and 41.9%, respectively.
Birds caused the most damage at I-2 with H449CLDM (9% seed loss) and the least damage at I-4 (Table 20). As would be expected, hybrid H449CLDM was taller than the short stature hybrid s870HCL at all the irrigation treatments. Plants of both hybrids were tallest at 2, followed by I-3. Treatments I-4 and I-1 had similar plant heights with either of the two hybrids (Table 20). Nitrogen application rates of 0 to 90 lb N/acre or N by Irrigation or N by Hybrid had no significant effect on seed yield, plant height, seed weight or test weight. Based on soil test results (top three ft. of soil), N fertilizer was recommended for seed yields above 1800 lb/ac (Table 19). For example, a yield goal of 2800 lb/ac would have required the addition of 68 lb N/ac. Deeper soil sampling (e.g., 0 to 4 ft) will be required in 2013 to get more accurate N recommendations (Joel Schneekloth, Personal Communication, December 2012).
Table 19. Fertilizer recommendations from soil tests done in the spring of 2012.
Yield goal (lb/ac) 1,200 lb/ac 2,400 lb/ac 3,600 lb/ac Nitrogen to apply (lb/ac) -36 42 120
In conclusion, the full-season irrigation treatment (I-2) produced the highest seed yield (2715 lb/acre), oil content (43.8%), and plant height (44.8 in.). Irrigation from the beginning of the reproductive stage through flowering (I-3) produced 2397 lb/acre with 49% less post-planting irrigation water than I-2. Rainfall accounted for approximately 20% of crop ET at I-2 and I-3. The short stature hybrid Triumph s870CL averaged 278 lb/acre less seed than Mycogen 8H449CLDM but it is more suitable to irrigation with siderolls, which are prevalent in SW
Colorado. There was no significant increase in seed yield due to N application, possibly because not all the residual N in the root zone was accounted for.
30
Table 20. Sunflower response to irrigation and N rate in 2012.
Irrigation
treatment Sunflower hybrid1
Seed yield lb/ac2 Seed oil % Plants/ac3 Plant height in. Seed weight mg Test weight lb/bu Bird damage % I-1 [Pre-plant (PP) irr. only] H449CLDM 1144 42.2 18177 33.2 a4 40.9 33.7 a4 5.8 s870HCL 786 41.2 18093 19.7 b 35.5 32.2 b 5.9 Average 965 D4 41.7 C4 18135 26.5 38.2 D4 33.0 5.8 I-2 (PP+full irr. to meet crop ET) 8H449CLDM 2721 44.6 17879 56.3 a 52.4 33.6 a 9.1 s870HCL 2708 43.0 16036 33.4 b 47.8 30.0 b 3.1 Average 2715 A 43.8 A 16957 44.8 50.1 B 31.8 6.1 I-3 (PP+irr. at R-1 to R-6) 8H449CLDM 2533 43.0 18533 41.9 a 55.5 32.2 a 2.2 s870HCL 2261 41.4 17090 30.5 b 49.6 28.9 b 2.7 Average 2397 B 42.2 B 17811 36.2 52.6 A 30.6 2.5 I-4 (PP+irr at R-4 to R-6) 8H449CLDM 1781 43.0 18167 31.4 a 47.2 34.6 a 0.6 s870HCL 1314 42.1 20074 20.1 b 39.7 32.3 b 0.8 Average 1547 C 42.5 B 19120 25.7 43.5 C 33.4 0.7 8H449CLDM 2045 A 43.2 A 18189 40.7 49.0 A 33.5 4.4 s870HCL 1767 B 41.9 B 17823 25.9 43.2 B 30.8 3.1 N rate (lb/ac) 1
Mycogen H449CLDM and Triumph s870HCL
2 Seed yield adjusted to 10% moisture. The number of plants/ac was used as covariate. 3
Number of plants with heads at harvest
4
31
Irrigation
treatment Sunflower hybrid1
Seed yield lb/ac2 Seed oil % Plants/ac3 Plant height in. Seed weight mg Test weight lb/bu Bird damage % 0 1908 42.8 18841 33.5 46.9 32.3 3.2 30 1957 42.6 17548 33.5 45.3 32.4 5.3 60 1864 42.3 18027 32.7 46.1 32.1 3.3 90 1895 42.4 17607 33.4 46.0 32.0 3.3 Average 1906 42.5 18006 33.3 46.1 32.2 3.8 CV (%) - 2.3 11 7.1 7.0 2.1 - Analysis of variance (P > F) Irrigation (Irr) 0.00 0.00 0.03 0.00 0.00 0.00 - Hybrid (Hyb) 0.00 0.00 0.42 0.00 0.00 0.00 - Irr X Hyb 0.16 0.51 0.06 0.00 0.52 0.00 - N rate 0.32 0.35 0.08 0.60 0.40 0.18 - N * Irr 0.15 0.93 0.45 0.96 0.25 0.11 - N*Hyb 0.20 0.24 0.42 0.55 0.32 0.12 - N*Hyb*Irr 0.23 0.33 0.27 0.31 0.78 0.42 -
32
Figure 13. Average seed yields and precipitation efficiencies (PPUE) in 2012.
Figure 14. Photo of sunflower taken on July 30, 2012 by Abdel Berrada. The image is centered on the short sunflower variety s870HCL. The irrigation treatment is I-2. Part of the drip irrigation system can be seen in the foreground.
0 50 100 150 200 250 0 500 1000 1500 2000 2500 3000
I-1 I-2 I-3 I-4
lb
se
eds
/in.
w
at
er
Seed y
ie
ld
(
lb
/ac)
Irrigation treatment
33
34
Yellow Jacket Fruit Tree and Vineyard Research and Demonstration
Project: 2012 Report
Tom Hooten - Colorado State University Extension, Montezuma County Director
Kim Dillivan - Colorado State University Extension, Dolores County Director
Dan Fernandez - Colorado State University Extension, former Dolores County Director
Abdel Berrada - Colorado State University, Southwestern Colorado Research Center Manager
Figure 16. U-PICK Day. Master Gardeners (persons wearing orange vests) were on hand to answer customer questions. Photo taken by Abdel Berrada
Project Background
The Fruit Tree and Vineyard Research and Demonstration Project was implemented in April 1991, and is a cooperative effort among Montezuma County Extension, Dolores County Extension, Natural Resources and Conservation Service in Dolores County, and the Colorado State University Southwest Colorado Research Center at Yellow Jacket, Colorado. The
35
completion of the Dolores Irrigation Project resulted in a substantial number of new client requests for local research based information/data on fruit tree and vineyard varieties, equipment usage, and cultural practices. Prior to this project, all fruit tree information originated from the Grand Junction area Experiment Stations which have a considerably different growing environment. Presently, the Team is evaluating 44 different fruit tree varieties including 21 field apples, 12 trellised apple varieties, 2 apple varieties planted in a “super high density,” 4 peach varieties, 4 pear varieties, and 3 plum varieties. The Team is also studying 6 trellised grape varieties, 1 raspberry variety, and 14 grass varieties.
Orchard management practices such as irrigation techniques, frost and freeze management, high-density apple planting, trellised apple planting, fruit thinning, tree pruning, and integrated pest (insect, disease, weed, and wildlife) management have been tested and demonstrated. Thirteen grass species or varieties and one legume were planted between fruit tree and grape rows in 1993 and 1995 to control soil erosion and suppress weeds. A popular fruit tree pruning workshop is held every year. The proceeds from the sale of the fruit during an annual “U-Pick” help fund the operation of the orchard. The annual “U-Pick” attracts hundreds of people and is also used as an educational opportunity to inform the public of different fruit varieties and their uses, as well as proper long-term storage of fruit. The fruit tree and vineyard demonstration project is managed by the Extension personnel of Dolores and Montezuma Counties. It has generated considerable interest and attracts a large number of visitors throughout the year, including students from Fort Lewis College in Durango and San Juan College in New Mexico.
Highlights of the 2012 Season
The 2012 season started with an exceptionally dry and warm spring. This led to a 2-3 week earlier timing for orchard development. The earlier development persisted through the year and resulted in a “U-Pick” harvest two weeks earlier (at September 15) than normal. Fruit production also increased; with an increase of 25% in apples and a 45% increase in total fruit production compared to 2011 (see Table 21). Fruit quality was exceptionally good due to successful pest management (especially codling moth) and fruit thinning (both chemical and manual methods were used). A new chemical (Altacor) was used for codling moth control. It was very successful when timed with codling moth monitoring and also cost effective due to its long residual effects and low toxicity. Insect resistance will need to be managed by alternating with another product. An “organic” control for codling moth (Spinosad) was used early in the year but was deemed too costly to warrant its continued use. “Organic” weed management (hoeing) was also demonstrated. However, the weeds easily grew ahead of the available labor. Thus it was deemed too labor intensive to continue the method and management was switched to chemical using glyphosate.
Variety Testing Results to Date
Apples - The apples have performed exceptionally well since they began producing. With the
36
experienced consistent production. Even with the hail damage in 2004, over 7,000 pounds of fruit were sold. Tree losses included 4 trees out of 226 planted, with 3 of those lost as the result of severe trunk damage due to excessive crop overload. Ten trees were lost in the trellis due to herbicide drift in 2010. They were replaced in 2011 with Improved Golden Delicious and four new varieties: Scarlet Spur, Spartan, Ruby Mac, and Schlect Spur. With the exception of varieties on the wrong rootstock for field or trellis applications, additional varieties that are questionable for our area include Honey Crisp, Improved Red Delicious, and possibly Idared. Roughly 1/3 of the crop (15,000 lbs.) was sold at the annual “U-Pick” in 2012.
Peaches - A much different situation exists here when compared with the apples. Virtually all
of the plantings (old and new) have suffered 50% tree losses within the first year. This is attributed in part to a late planting date for peaches and the possibility that planted trees were of too large a diameter with a limited root system. The peach trees arrived partially leafed out, and when this is compounded with tree transplant shock, early tree death is inevitable. The first 2 varieties planted in 1991, Redskin and J.H. Hale, have been eliminated with one crop in seven years and significant yearly die-back. Four new varieties have been added: Flamin’Fury PF#15A, Starfire FA11, Suncrest, and Red Globe which seem to have more promise. The severe hail of 2004 damaged the upper surface of branches that led to infection with perennial canker. Many of the peach trees exhibit gradual decline and branch death since then.
Pears - The four varieties planted; Max Red Bartlet, Du Comice, D’Anjou, and Bronze Beauty
have all developed well with minor problems. They do require considerable limb training and are highly susceptible to the pear slug and pear psylla. A small outbreak of Fire Blight occurred in 2007, but immediate action of pruning out the infected wood, complete cleanup of leaves and debris and several applications of Streptomycin have apparently taken care of the problem for now. No evidence of the disease has been observed to date (2012). Pears take time to produce with the Max Red and Du Comice (planted in 1996) producing their first crop in 2001. All trees are now in production and have produced generously.
Plums - Three varieties of plum on Myro rootstocks (Empress, Improved Duarte, and President)
were planted in 2008 in three row-groups of five trees each. Initial growth was very good. However, in 2010 President suffered significant die-back to the main scaffold limbs due to freezing temperatures. The damaged trees required substantial reconstructive pruning. Recovery has been very good. Observations will continue. The first significant crop of 1,000 lbs. was produced in 2012.
Grapes - Of the original 8 varieties planted in 1994, Seyval Blanc, Pinot Noir, and White Riesling
were removed in 1998. These varieties require a longer growing season than what is “normal” for the location of the vineyard. In their place, Cayuga White, DeChaunac, Edelweiss, and Chardonel were planted in 1999. The performance of these four varieties has been extremely disappointing. The year 2001 was the third growing season and the vines have not performed any better. The reason for this poor performance is baffling as these vines received the same treatment as the more mature plantings. In 2000, there was a 100% infestation of crown gall in
37
the Foch, Gewurztraminer, Merlot, and Chardonnay vines. When the infestation of 2000 occurred in all of the 4 above named varieties, they were removed.
The only remaining original planting is Lemberger. This red variety has produced crops from the third season until present. Shoot thinning and cluster removal prior to veraison are methods used to promote fruit development and maturation. This is continuing, though labor for the tasks is limited.
Grasses - Thirteen different grasses along with one legume were planted between the fruit tree
rows in the demonstration orchard between April 1993 and November 1995 to evaluate their erosion control potential. These were dryland plantings with no supplemental water given. Lovington blue grama, Canbar canby bluegrass, birdsfoot trefoil/Ephraim crested wheatgrass mix, and Topgun buffalograss have been judged unsuitable for erosion control.
Irrigation
The team is currently evaluating a variety of irrigation systems including various types of drip emitters, several types of maxi and mini sprinklers, pulsators, and surface drip tubing. We currently use a 50-mesh filtration system due to very good irrigation water quality. Plugging of the filter screens has not been a problem, though they do need occasional cleaning. Our only significant problem has been with the maxi and mini sprinklers that have moving parts. A slight buildup of calcium carbonate causes the spinners to jam and spray only in one direction. These were removed and replaced with static sprinkler heads with a 360-degree spray pattern.
Additional Investigations
Work continues on frost protection management for the fruit trees and grapes, bird control, and integrated pest management of insects and diseases. Workshops on pruning and fruit management are conducted every year in cooperation with the Colorado Master Gardener program. Volunteers from the program are instrumental in maintaining the viability of the orchard project.
Strong emphasis continues to be placed on demonstrating, evaluating, and testing varieties, irrigation equipment, orchard equipment, and cultural practices that are cost effective, user friendly, and available through local suppliers.
Interest in “organic” production methods has been increasing. Some methods have been utilized on a trial basis (see Highlights of the 2012 Season above) but have been limited by cost and labor. Investigation into alternative management practices will continue as time and resources allow.
The team continues to investigate marketing opportunities as well as “Home-Based Business” opportunities as they relate to fruit and vineyard product utilization, i.e. fruit by-products. In addition, there has recently been interest in landowners to begin to rejuvenate some of the old,
38
neglected apple orchards in Montezuma County. This may be due to the surging interest in local food production that has been burgeoning in the county over the last several years. The Fruit Tree and Vineyard Research and Demonstration Project will continue to attract interest and visitors as it remains relevant to the needs of the stakeholders in Southwest Colorado.
39
Table 21. 2012 Production Information-- Southwest Colorado Fruit Tree and Vineyard Demonstration Project.
Variety Tree Count lbs. / tree Total Production (lbs.)
Apples * ESTIMATES ESTIMATES
Scarlet Gala 20 400.00 8,000.00 Nured Jonathan 2 100.00 200.00 Lustre Elstar 4 400.00 1,600.00 Super Jon 5 350.00 1,750.00 Red Jonagold 5 400.00 2,000.00 Golden Delicious 10 600.00 6,000.00 Honey Crisp 5 400.00 2,000.00
Red Fuji *Trellis 16 30.00 480.00
Swiss Gourmet *Trellis 16 150.00 2,400.00
Royal Empire *Trellis 16 150.00 2,400.00
Liberty *Trellis 16 300.00 4,800.00
Mor-Spur McIntosh 5 200.00 1,000.00
Improved Red Delicious 5 200.00 1,000.00
Royal Gala *Trellis 5 200.00 1,000.00
Rubinstar 4 250.00 1,000.00
Ida Red 4 75.00 300.00
Gravenstein 0
Lodi 0
Myra Fuji *Trellis 8 20.00 160.00
Sun Fuji 5 100.00 500.00 Galaxy Gala 5 50.00 250.00 Improved Gala 5 250.00 1,250.00 Pacific Gala 5 500.00 2,500.00 Pinova 5 400.00 2,000.00 Cameo 5 100.00 500.00
Improved Golden Delicious 5 350.00 1,750.00
Golden Supreme 5 250.00 1,250.00
Nured Jonathan Sport 18 150.00 2,700.00
Improved McIntosh *Trellis 5 25.00 125.00
Buckeye Gala 5 300.00 1,500.00
September Wonder Fuji **SHD 10 30.00 300.00
Honey Crisp **SHD 10 20.00 200.00
Scarlet Spur *Trellis 4 new
Imp. Golden Delicious *Trellis 5 new
Spartan *Trellis 4 new