JHEP03(2021)268
Published for SISSA by SpringerReceived: October 27, 2020 Revised: January 27, 2021 Accepted: February 21, 2021 Published: March 29, 2021
Search for Higgs boson production in association with
a high-energy photon via vector-boson fusion with
decay into bottom quark pairs at
√
s = 13 TeV with
the ATLAS detector
The ATLAS collaboration
E-mail: atlas.publications@cern.ch
Abstract: A search is presented for the production of the Standard Model Higgs boson in association with a high-energy photon. With a focus on the vector-boson fusion process and the dominant Higgs boson decay into b-quark pairs, the search benefits from a large reduction of multijet background compared to more inclusive searches. Results are reported from the analysis of 132 fb−1of pp collision data at√s = 13 TeV collected with the ATLAS detector at the LHC. The measured Higgs boson signal yield in this final-state signature is 1.3 ± 1.0 times the Standard Model prediction. The observed significance of the Higgs boson signal above the background is 1.3 standard deviations, compared to an expected significance of 1.0 standard deviations.
Keywords: Hadron-Hadron scattering (experiments), Higgs physics
JHEP03(2021)268
Contents
1 Introduction 1
2 ATLAS detector 3
3 Data and simulated events 4
4 Object selection 5
5 Event selection 6
6 Multivariate analysis 7
7 Signal and background modelling 9
8 Systematic uncertainties 11
8.1 Experimental uncertainties 11
8.2 Theoretical uncertainties 12
9 Fit results for Higgs boson production 12
10 Conclusion 15
The ATLAS collaboration 20
1 Introduction
Following the discovery of a new particle with a mass of approximately 125 GeV by the ATLAS and CMS Collaborations at the Large Hadron Collider (LHC) [1,2], there has been an extensive effort to measure its properties and compare them with theoretical predictions for the Standard Model (SM) Higgs boson.
Among the Higgs boson production modes still to be explored, the Hγ mode has received attention for its interesting phenomenology [3, 4], in which the addition of the high-energy photon reorders the usual hierarchy of Higgs boson production cross sections. Experimental measurements are needed to study the SM predictions and to probe for signs of new physics beyond the SM that affect this production mode, which also has potential as a clean signature for unexpected or invisible Higgs boson decays.
The exclusive final state Hγ is forbidden in gluon-gluon fusion (ggF) by Furry’s theo-rem [5], but the Hγ system may be produced in recoil against a jet. Contributions from as-sociated W H and ZH production are similar in size to the higher-order contributions from ggF. In vector-boson fusion (VBF), the photon may be radiated either from a charged weak
JHEP03(2021)268
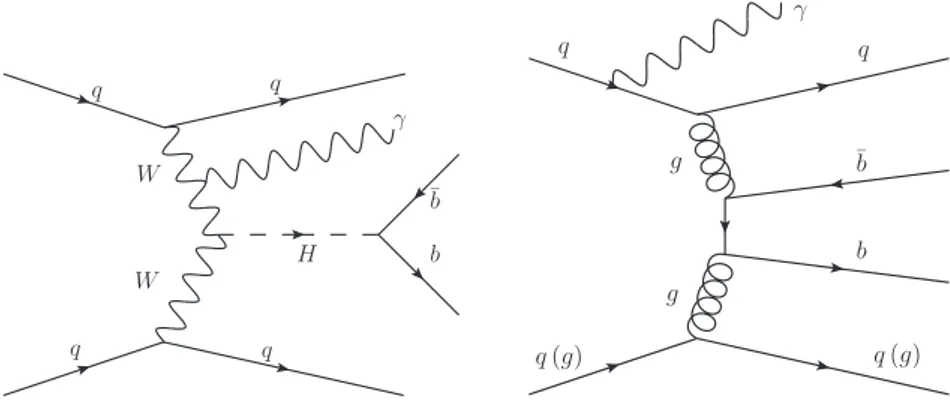
q q q q W W H b ¯b γ γ q q q (g) q (g) b ¯b g gFigure 1. Representative leading-order Feynman diagrams for Higgs boson production via vector-boson fusion in association with a photon (left) and the dominant non-resonant b¯bγjj background (right).
boson or from a scattering quark that showers into a jet (j). VBF is the dominant produc-tion mode for Hγ, as its cross secproduc-tion is twice as large as that of all other modes combined. To select the VBF production mode in particular, a search has been developed in the Hγjj final state, with an additional phase-space cut on the jet-jet invariant mass. To maximize the experimental sensitivity to this final state, the search focuses on the dominant
H → b¯b decay. A previous VBF H(→ b¯b)γ search by the ATLAS Collaboration with
31 fb−1 of 13 TeV data reported a signal strength measurement, defined as the production rate relative to the SM cross section, of µVBF= 2.5 ± 1.9 and an observed (expected) Higgs
boson signal significance of 1.4σ (0.6σ) [6]. A complementary VBF H(→ b¯b) search by the ATLAS Collaboration in an all-hadronic signature, without the associated photon, reported an observed (expected) Higgs boson signal significance of 1.4σ (0.4σ) in the same dataset [6]. In the time since that search was reported, extensive studies of Higgs production with-out an associated photon by the ATLAS and CMS Collaborations have now accumulated strong evidence for the VBF production mode and for the H → b¯b decay. The ATLAS Col-laboration has combined several measurements made with up to 79.8 fb−1 of 13 TeV data
to yield µVBF= 1.21 ± 0.23, compatible with the combined CMS measurement of µVBF=
0.73 ± 0.28 made with up to 35.9 fb−1 [7, 8]. Both the ATLAS and CMS Collaborations have observed the H → b¯b decay mode, with significances of 6.7σ and 5.6σ respectively, in decay signatures dominated by contributions from W H and ZH production [9,10].
Nevertheless, there are several interesting effects that motivate testing the SM predic-tions with a measurement of Hγjj production. First, a unique feature of this production mode is that contributions from Z boson fusion are suppressed, due to destructive inter-ference between matrix elements for initial- and final-state radiation. This feature allows a more direct measurement of Higgs boson production through W boson fusion. Second, the same interference also suppresses the dominant multijet non-resonant b¯bγjj background shown in figure1, improving the expected sensitivity to Higgs boson production. Third, the presence of an isolated high-energy photon can be used to define efficient trigger algorithms for this search.
JHEP03(2021)268
This paper reports the result of a search for Hγ production and subsequent H → b¯b decay, with a focus on the phase space dominated by the VBF process, using the full Run 2 dataset. In this phase space, the main backgrounds are non-resonant b¯bγjj production and resonant Z(→ b¯b)γjj production. Kinematic event properties are used in a boosted decision tree (BDT) to classify signal and background events, and the BDT output defines a series of increasingly signal-rich event categories. The Higgs boson production rate, defined relative to the SM prediction, is extracted from a simultaneous fit to the Higgs boson candidate mass distribution in multiple event categories.
2 ATLAS detector
The ATLAS experiment [11] at the LHC is a multipurpose particle detector with a cylin-drical geometry that covers nearly the entire solid angle around the collision point.1 It consists of an inner tracking detector surrounded by a thin superconducting solenoid, elec-tromagnetic and hadronic calorimeters, and a muon spectrometer incorporating three large superconducting toroidal magnets.
The inner tracking detector covers the pseudorapidity range |η| < 2.5. It consists of silicon pixel, silicon microstrip, and transition radiation tracking detectors immersed in a 2 T axial magnetic field. One significant upgrade for the√s = 13 TeV run is the insertable B-layer [12,13], an additional pixel layer close to the interaction point.
The calorimeter system covers the pseudorapidity range |η| < 4.9. Within the region |η| < 3.2, electromagnetic calorimetry is provided by barrel and endcap high-granularity lead/liquid-argon (LAr) calorimeters, with an additional thin LAr presampler covering |η| < 1.8 to correct for energy loss in material upstream of the calorimeters. Hadronic calorimetry is provided by the steel/scintillator-tile calorimeter, segmented into three bar-rel structures within |η| < 1.7, and two copper/LAr hadronic endcap calorimeters. The solid angle coverage is completed with forward copper/LAr and tungsten/LAr calorimeter modules optimized for electromagnetic and hadronic measurements, respectively.
The muon spectrometer consists of fast detectors for triggering and high-precision chambers for tracking in a magnetic field generated by superconducting air-core toroids. The field integral of the toroids ranges between 2.0 and 6.0 T m across most of the detector. A two-level trigger system selects events for offline analysis. Events that match prede-fined trigger signatures are selected by the first-level trigger system implemented in custom hardware. A subset of those events are selected by software algorithms implemented in the high-level trigger [14]. The first-level trigger accepts events from the 40 MHz bunch cross-ings at a rate below 100 kHz, and the high-level trigger reduces the rate in order to record events to disk at about 1 kHz.
1
ATLAS uses a right-handed coordinate system with its origin at the nominal interaction point (IP) in the centre of the detector and the z-axis along the beam pipe. The x-axis points from the IP to the centre of the LHC ring, and the y-axis points upwards. Cylindrical coordinates (r, φ) are used in the transverse plane, with φ being the azimuthal angle around the z-axis. The pseudorapidity is defined in terms of the polar angle θ as η = − ln tan(θ/2). The rapidity is defined as y = 0.5 ln[(E + pz)/(E − pz)], where E denotes
energy and pz is the component of the momentum along the beam direction. Angular distance is measured
JHEP03(2021)268
3 Data and simulated events
This search uses LHC proton-proton collision data at a centre-of-mass energy of 13 TeV collected with the ATLAS detector from 2015 to 2018. This full Run 2 dataset, with the analysis-specific triggers available, corresponds to an integrated luminosity of 132 fb−1.
Simulated events are used for signal modelling, BDT training, and determining the functional form used to describe the background shape. The Hγjj signal events were
gen-erated at next-to-leading order (NLO) in αS with MadGraph5 aMC@NLO v2.6.2 [15],
using the PDF4LHC15 parton distribution function (PDF) set [16], and passed to
Her-wig 7.1 for parton showering and hadronization using parameter values from the HerHer-wig default tunes [17,18]. This sample of events can effectively be regarded as VBF Hγ signal because the contribution from V H production is less than 0.5% of the total after event selection. Higgs boson production from ggF, with Higgs decay into b¯b, was simulated at next-to-next-to-leading order with Powheg-Box v2 [19–21], using the CT10 PDF set [22] and Pythia 8.212 [23] for parton showering and fragmentation with the AZNLO tuned pa-rameter set [24]. Contributions from the t¯tH process are estimated from Powheg-Box v2 simulation interfaced with Pythia 8.230.
Background events containing two b-jets from the decay of a Z boson, a photon, and two additional jets were generated at leading order (LO) with MadGraph5 aMC@NLO v.2.3.3 and Pythia 8.210, in separate samples for strong (QCD) and electroweak (EWK) pro-cesses. The dominant source of background events is non-resonant QCD production of at least two b-jets, two other jets, and a photon. Even though the contribution from these events is modelled with a functional form, a sample of simulated events is used to train the BDT. This training sample was produced by generating the b¯bγjj final state, excluding diagrams containing on-shell H or Z bosons, at LO with MadGraph5 aMC@NLO v2.3.3 using the PDF4LHC15 set of PDFs and interfaced to Pythia 8.210 for parton showering and hadronization. The A14 set of tuned parameters was used for the underlying-event description with the NNPDF2.3LO PDF set [25]. A large sample of non-resonant b¯bγjj background events was also produced without parton showering for the background mod-elling studies described in section 7. For this sample, a parameterized jet energy response function is used to smear the jet transverse energy distribution to match the data.
Certain simulation configurations are common to all samples. The decays of bottom
and charm hadrons were performed by EvtGen [26]. Minimum-bias events were simulated
using the Pythia 8.210 generator with the NNPDF2.3LO PDF set and the A3 parameter tune [27]. A number of these events, varying in accord with the luminosity profile of the recorded data, were overlaid on the hard-scatter interactions to model pile-up contributions from both the same bunch crossing and neighbouring bunch crossings. The response of the ATLAS detector to the generated events was then modelled using a full simulation of the detector [28] based on Geant4 [29].
JHEP03(2021)268
4 Object selection
The event selection builds on standard ATLAS reconstruction algorithms for jets, photons, and leptons. The leptons — electrons and muons — are identified only for the purpose of vetoing events with leptons to preserve orthogonality with other ATLAS measurements.
Jets are reconstructed from three-dimensional positive-energy topological clusters of calorimeter energy deposits calibrated to the electromagnetic scale [30]. These clusters are inputs to the anti-kt jet reconstruction algorithm [31, 32] with a radius parameter
of R = 0.4. To suppress jets originating from pile-up vertices, a likelihood-based jet vertex tagger (JVT) [33] is applied to jets with transverse momenta pT < 120 GeV and
|η| < 2.5. A pile-up subtraction algorithm further reduces pile-up contributions to the jet energies [34]. These jet energies are calibrated with MC-derived correction factors, including η-dependent calibrations to ensure consistent jet energy measurements in the central and forward regions of the experiment [34]. The jet energies are further corrected using data-derived calibrations based on the pTbalance between jets and reference objects,
such as Z bosons, photons, or high-energy jets.
The MV2c10 multivariate b-tagging algorithm [35] tags jets (jets containing b-hadrons) within the tracker acceptance. It uses log-likelihood ratios from two- and three-dimensional impact parameter distributions, secondary and tertiary vertex information,
and the jet pT and η, as inputs to a BDT. The requirement on the BDT output
corre-sponds to a per-jet b-tagging efficiency of 77%, as measured in simulated t¯t events for b-jets with pT > 20 GeV and |η| < 2.5, and c-jet and light-flavour-jet efficiencies of 25% and
0.9%, respectively. Scale factors are applied to account for efficiency differences between simulated events and data [35–37].
Photon and electron reconstruction begins with clusters of calorimeter energy de-posits [38]. Clusters without any matching track or conversion vertex are identified as unconverted photons, while clusters with a matching conversion vertex reconstructed from one or two tracks are identified as converted photons. Clusters with a matching track, re-fitted to account for bremsstrahlung, are identified as electrons. Calorimeter and track information for each photon or electron candidate is used to construct multivariate discrim-inants for identification, and ‘tight’ selections are applied to both the photons and electrons. To suppress hadronic background, further isolation requirements are optimized with sim-ulated t¯t events [38]. For photon candidates, the calorimeter isolation variable ETiso is the sum of the transverse energies of topological clusters reconstructed in the electromagnetic and hadronic calorimeters in a cone of size ∆R = 0.4 around the photon candidate, where the ∆η × ∆φ region of size 0.125 × 0.175 around the photon cluster’s centroid is excluded. The isolation requirement, which depends explicitly on the photon transverse energy ETγ, is Eiso
T < 2.45 GeV + 0.022 × E γ
T. For electron candidates, both track- and calorimeter-based
isolation is required. The track-based isolation requirement is a function of the electron transverse momenum peT and is based on the tracks within a cone of peT-dependent size up to ∆R = 0.2 around the electron candidate [38]. The calorimeter-based isolation requires that the sum of cluster transverse energies within the same ∆R be less than 3.5 GeV.
JHEP03(2021)268
Muons are reconstructed by combining inner detector tracks, where available, and muon spectrometer tracks up to |η| = 2.7. They must satisfy the ‘loose’ identification criteria [39]. Identified muons must be isolated from other tracks, with a total summed track pT less than 1.25 GeV in a cone of ∆R = 0.2 around the muon. Only ‘loose’ muons
within the coverage of the inner detector, |η| < 2.5, are used in this selection.
Overlap between identified photons, leptons, and jets is removed with the following procedure. First, photons within ∆R = 0.4 of any muon or electron are removed. Next, jets within ∆R = 0.2 of any electron are removed, and electrons within ∆R = 0.4 of any remaining jets are removed. Then, jets within ∆R = 0.2 of any muon are removed if fewer than three tracks are associated with the jet or if both pµT > 0.5pjetT and pµT> 0.7P ptrack
T ,
where P ptrack
T is the sum of track transverse momenta associated with the jet. Muons
within ∆R = min(0.4, 0.04 + 10 GeV/pµT) of any remaining jets are removed. Finally, jets within ∆R = 0.4 of any photon are removed.
5 Event selection
The event selection criteria are based on the object reconstruction algorithms, with ad-ditional event-level requirements to select events compatible with VBF Hγ production. These criteria are similar to the event selection requirements in previous searches [6].
The first-level trigger selection requires an isolated electromagnetic calorimeter ob-ject — the photon — with ET > 22 GeV. The high-level trigger selects events in the
specific VBF-enhanced phase space, defined by the following requirements. An isolated reconstructed photon with ET > 25 GeV is required in addition to at least four jets with
ET > 35 GeV and |η| < 4.9. The requirement that at least one pair of jets in the event has
an invariant mass greater than 700 GeV targets the VBF phase space. For most of Run 2, a b-tagging trigger algorithm was used to ensure that at least one jet was b-tagged at the 77% efficiency working point [40].
Additional selection requirements are placed on events that pass the trigger selection. At least one photon with ET > 30 GeV in the regions |η| < 1.37 or 1.52 < |η| < 2.37
must match the trigger photon. Events must have at least four jets satisfying pT > 40 GeV
and |η| < 4.5, with at least two jets in |η| < 2.5 passing the b-tagging selection. The two highest-pT b-tagged jets are assumed to be from the Higgs boson decay; they are identified
as b1 and b2 and at least one of them must match a b-tagged trigger-level jet when the tagging trigger algorithm is used. Dedicated jet energy corrections are applied to b-tagged jets to improve their energy measurement (scale and resolution) [9]. They equalize the response to jets with semileptonic or hadronic decays of heavy-flavour hadrons and correct for resolution effects. This correction improves the di-b-jet invariant mass mbb
resolution by 10%. From the remaining jets, the jet pair with the highest invariant mass is chosen as the VBF jets; they are identified as j1 and j2. Requiring this invariant mass mjj
to be greater than 800 GeV ensures full efficiency for the trigger mjj requirement. Events
containing identified and isolated electrons with pT > 25 GeV and |η| < 2.47 or muons with
JHEP03(2021)268
Trigger
L1 ≥ 1 photon with ET> 22 GeV
HLT
≥ 1 photon with ET> 25 GeV
≥ 4 jets (or ≥ 3 jets and ≥ 1 b-jet) with ET> 35 GeV and |η| < 4.9
mjj > 700 GeV
Offline
≥ 1 photon with ET> 30 GeV and |η| < 1.37 or 1.52 < |η| < 2.37 ≥ 2 b-jets with pT> 40 GeV and |η| < 2.5
≥ 2 jets with pT > 40 GeV and |η| < 4.5 mjj > 800 GeV
pT(b¯b) > 60 GeV
No electrons (pT> 25 GeV, |η| < 2.47) or muons (pT> 25 GeV, |η| < 2.5)
Table 1. Trigger and offline event selection criteria for the H(→ b¯b)γjj signature. L1 and HLT refer to the first-level trigger and the high-level trigger, respectively.
The jet pT requirements in the trigger algorithms and offline event selection can
in-troduce concavity in the mbb distribution, making it more difficult to parameterize with
an analytic function. The concavity is removed by requiring the pT of the di-b-jet system
pT(b¯b) to be greater than 60 GeV, a value that was optimized in the large MC sample of
non-resonant b¯bγjj background events.
The full list of trigger algorithm and offline event selection requirements, before the event-level BDT classification, is summarized in table 1.
6 Multivariate analysis
An event-level BDT classifies events as being signal-like or background-like, based on a set of kinematic variables selected to optimize the separation. The input variables are
chosen to ensure the BDT output discriminant shows low correlation with with mbb to
prevent distortions of the mbb spectrum. The following variables, ordered by decreasing
classification power [41], are used for the BDT training:
1. ∆η(jj), the pseudorapidity difference between the two VBF jets;
2. pbalanceT , the transverse momentum balance for selected final-state objects, defined as
pbalanceT = | ~pT
b1+ ~p
Tb2+ ~pTj1+ ~pTj2+ ~pTγ|
pb1T + pb2T + pj1T + pj2T + pγT ;
3. ∆R(b1, γ), the angular distance between the leading b-jet and the photon; 4. mjj, the invariant mass of the two VBF jets;
5. ∆R(b2, γ), the angular distance between the subleading b-jet and the photon; 6. centrality(γ, j1, j2), the rapidity of the photon relative to the VBF jet rapidities,
defined as centrality(γ, j1, j2) = yγ− yj1+yj2 2 yj1− yj2 ;
JHEP03(2021)268
Events / 0.3 0 1000 2000 3000 4000 5000 6000 7000 8000 9000 Data Hγjj × 100 jj EWK γ Z Zγjj QCD jj γ bNon-reson. b Stat. Unc. ATLAS -1 = 13TeV, 132 fb s γ )+ b b → VBF H( Mass sidebands jj η ∆ 0 1 2 3 4 5 6 7 8 9 Data/SM Pred. 0.70.8 0.9 1 1.1 1.2 1.3 Events / 0.04 0 2000 4000 6000 8000 10000 12000 14000 Data Hγjj × 100 jj EWK γ Z Zγjj QCD jj γ b
Non-reson. b Stat. Unc. ATLAS -1 = 13TeV, 132 fb s γ )+ b b → VBF H( Mass sidebands balance T p 0 0.1 0.2 0.3 0.4 0.5 0.6 0.7 0.8 0.9 1 Data/SM Pred. 0.70.8 0.9 1 1.1 1.2 1.3
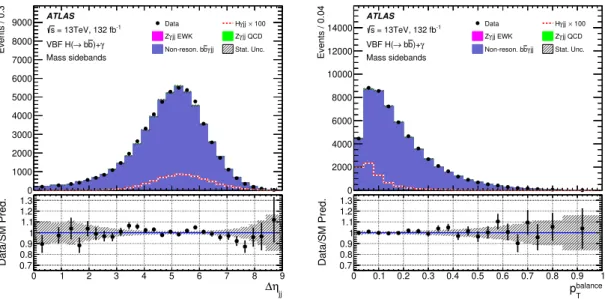
Figure 2. Comparisons of data and simulated event distributions of the BDT input variables ∆ηjj (left) and pbalance
T (right) in the two mbbsidebands after kinematic reweighting of the non-resonant b¯bγjj background. The data are shown as black points, and the background contributions are stacked in coloured histograms. The Higgs boson signal contribution is scaled up and represented by the dashed red line. The bottom panel in each plot shows the ratio of the data to the SM prediction, where the uncertainty band corresponds to the statistical uncertainty only.
7. ∆φ(b¯b, jj), the azimuthal angle difference between the di-b-jet system and the VBF jet system;
8. pjjT, the transverse momentum of the VBF jets system;
9. cos θ, the cosine of the angle between the VBF jets plane and b-jets plane in the centre-of-mass frame of the b¯bjj system;2 and
10. ∆R(b1, j1), the angular distance between the leading b-jet and the leading VBF jet. The Hγjj signal sample and the non-resonant b¯bγjj background sample are used for
the BDT training in the TMVA package [41]. To improve agreement between the LO
non-resonant b¯bγjj simulation and data, analytic correction functions are fit in the mass side-bands (mbb < 100 GeV and mbb > 140 GeV). They are based on data-to-MC ratios of the
distributions for several relevant observables and are used to reweight the simulated events. The overall normalization is also corrected to match the data in the mass sidebands. This procedure is applied sequentially to the distributions of ∆ηjj, min[∆R(b1, γ), ∆R(b2, γ)],
and pbalanceT , resulting in corrections that are typically less than 10%. The distributions of the other uncorrelated input variables are not significantly affected by the reweighting. Comparisons of the data and MC distributions for the two most powerful classification variables, after the reweighting procedure, are shown in figure 2.
2This angular variable is sensitive to the spin of the particle decaying into b¯b. It helps discriminate Higgs
JHEP03(2021)268
1 − −0.8 −0.6−0.4 −0.2 0 0.2 0.4 0.6 0.8 1 BDT Output Discriminant 0.02 0.04 0.06 0.08 0.1 0.12 Fraction of EventsLowBDT MediumBDT HighBDT ATLAS Simulation = 13 TeV s γ )+ b b → VBF H( jj γ H jj γ b Non-reson. b
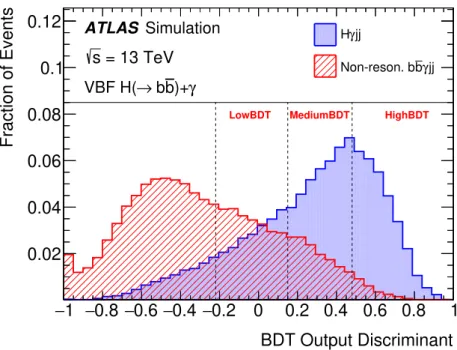
Figure 3. BDT output discriminant distributions for the Hγjj signal and non-resonant b¯bγjj background samples. The distributions from the signal and background samples are shown as blue and red hatched histograms, respectively. The vertical dashed lines represent the boundaries of the event categories, defined by the BDT output discriminant.
The BDT output discriminant is used to define three signal categories: HighBDT, MediumBDT, and LowBDT. The boundaries of the three categories are defined sequen-tially from HighBDT to LowBDT by maximizing the combined VBF Higgs boson signal significance across categories. The BDT output distributions for the signal and background samples within the three categories are shown in figure 3.
7 Signal and background modelling
The main sources of background contributing to the b¯bγjj final-state signature are divided into processes with the decay of a massive gauge boson into b-tagged jet pairs and pro-cesses with non-resonant b-tagged jet pairs. The resonant background is dominated by Z(→ b¯b)γjj, with a negligible contribution from W γjj. The non-resonant background is dominated by multijet b¯bγjj production, with small contributions from t¯tγ and single-top events. The expected contributions from the dominant signal and background processes are collected in table 2.
To extract the Higgs boson production rate from fits to data, the signal and dominant backgrounds — the resonant Zγjj and non-resonant b¯bγjj contributions — are parameter-ized with analytic functions derived from simulated events or data sideband regions. The small contributions from other backgrounds are included in the non-resonant background functions.
JHEP03(2021)268
Category LowBDT MediumBDT HighBDT
BDT Output (−0.22, 0.15) (0.15, 0.48) (0.48, 1) VBF+V H 11.31 ± 0.12 21.07 ± 0.17 18.33 ± 0.15 ggF 1.71 ± 0.41 1.08 ± 0.33 0.19 ± 0.13 t¯tH 0.75 ± 0.14 0.19 ± 0.03 0.05 ± 0.01 Zγjj EWK 8.50 ± 0.14 8.91 ± 0.14 5.37 ± 0.11 Zγjj QCD 15.9 ± 1.7 7.2 ± 1.1 1.65 ± 0.52 Non-resonant b¯bγjj 2834 ± 42 1507 ± 33 322 ± 17 Expected Yield 2872 ± 42 1545 ± 33 348 ± 17 Data 2964 1522 318
Table 2. Data and expected yields for the Higgs boson signal, resonant Zγjj and non-resonant b¯bγjj background processes, in the three categories defined by the BDT output discriminant. The event yields are calculated from simulated samples in the mass range 100 GeV < mbb< 140 GeV. The yields are shown with statistical uncertainties only because experimental and theoretical sys-tematic uncertainties, which depend on fits to data, are an order of magnitude smaller.
40 60 80 100 120 140 160 180 200 [GeV] bb m 0 0.005 0.01 0.015 0.02 0.025 0.03 0.035 0.04 0.045
Normalized to unit area
HighBDT MediumBDT LowBDT ATLAS Simulation = 13 TeV s γ )+ b b → VBF H( jj sample γ H 2.8 GeV ± Mean = 123.8 2.1 GeV ± Sigma = 11.2 3.0 GeV ± Mean = 122.7 2.3 GeV ± Sigma = 13.9 4.6 GeV ± Mean = 121.9 3.5 GeV ± Sigma = 16.8 40 60 80 100 120 140 [GeV] bb m 0 0.005 0.01 0.015 0.02 0.025 0.03 0.035 0.04 0.045
Normalized to unit area
HighBDT MediumBDT LowBDT ATLAS Simulation = 13 TeV s γ )+ b b → VBF H( jj sample γ Z 2.8 GeV ± Mean = 92.7 2.1 GeV ± Sigma = 9.9 2.3 GeV ± Mean = 92.1 1.8 GeV ± Sigma = 10.8 0.7 GeV ± Mean = 92.0 0.5 GeV ± Sigma = 12.1
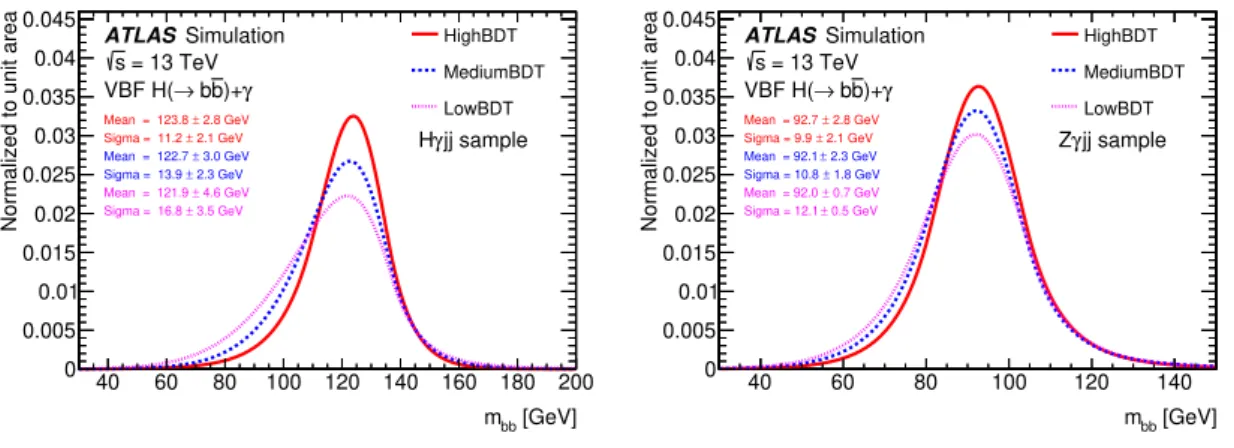
Figure 4. Comparison of the Bukin function parameterizations, normalized to unit area, of the mbbdistributions for Hγjj events (left) and Zγjj events (right) in the three BDT categories, along with the mean and sigma values for the three fitted functions.
The Higgs boson signal mbbdistribution is modelled with a Bukin function [43],
param-eterized using the simulated samples independently in each of the three event categories defined by the BDT output, as shown in figure4. Among the possible functions, the Bukin function showed the best fit quality, as gauged by fit residuals across the mass range. With this function, the residuals follow a normal distribution about zero. The resonant Zγjj background is also described with the same Bukin function using independent parameters in each of the three BDT categories.
The model for the non-resonant background is tested and largely determined using the data sidebands outside the mass window 100 GeV < mbb< 140 GeV. Several different
JHEP03(2021)268
power-law functions. The potential bias arising from the fitting procedure, termed ‘spurious signal’, is estimated by performing signal-plus-background fits over the full mass range in the large simulated sample of non-resonant b¯bγjj background events. The polynomial function, with two terms (first-order) for the HighBDT region or three terms (second-order) for the MediumBDT and LowBDT regions, has the smallest bias among the tested functions and is therefore chosen for the background template in the fit. The standard F -test is used as a confirmation check, assessing the significance of decreases in the reduced χ2 value as the order of the background-only polynomial fit to the data sidebands is increased. The spurious-signal uncertainty, evaluated separately in each BDT region as the maximum of the fitted spurious signal and the MC statistical uncertainty of the non-resonant b¯bγjj background, is included as a systematic uncertainty in the signal yield. The spurious signal is treated in the same way when Zγjj is treated as signal.
8 Systematic uncertainties
Systematic uncertainties in the Higgs boson production rate arise from choices of modelling and fitting methods — such as the spurious-signal uncertainties — and from uncertain-ties in the event reconstruction or cross-section calculations. They are summarized in table 3 together with the statistical uncertainties calculated using the methods described in section9. The systematic uncertainties for the background and signal contributions are divided into experimental and theoretical uncertainties. They affect only the signal and background predictions that are based on simulation; they do not affect the non-resonant background estimate, which is derived from the data only. The uncertainties are propa-gated through the event selection and the BDT classification to the template distributions. They modify the shape and nominal normalization of the Higgs boson signal process. How-ever, they modify only the shape of the resonant Zγ background, as its normalization is derived from the mbb fits in each category separately. In general, the impact of the signal
shape uncertainties on the final Higgs boson measurement is smaller than the impact of the experimental systematic uncertainties.
Other uncertainties are related to factors in the full mbb fit, such as the uncertainty
in the Zγ normalizations (‘Z boson normalizations’ in table 3). The uncertainties in the b¯bγjj background relate to the fitted shapes (‘Bkg. fit shapes’) and normalizations (‘Bkg. fit normalizations’).
8.1 Experimental uncertainties
The uncertainty in the combined 2015–2018 integrated luminosity is 1.7% [44], obtained us-ing the LUCID-2 detector [45] for the primary luminosity measurements. This uncertainty is applied to all contributions estimated from simulated samples alone.
The dominant jet-related uncertainties for the mbb reconstruction are the jet energy
scale (JES) and jet energy resolution (JER) uncertainties. These are determined by pT
-balancing methods in data [34], and the effect on the mass spectrum is determined by shifting or smearing the jet energies before calculating mbb. A total of 8 JER and 30 JES
JHEP03(2021)268
uncertainty parameters are considered in calculating the effects. The systematic uncer-tainty in the JVT is estimated by varying the tagger efficiency within its uncertainties. All of these jet uncertainties are summarized in the ‘Jet’ line of table 3.
The uncertainties related to b-tagging jets, covering the trigger-level b-tagging efficien-cies and the offline b-tagging efficiency data-to-simulation scale factors, are implemented as variations of the event-weight scale factors. They are determined from data using t¯t events, W boson decays into hadrons, and multijet data [35–37]. The event weight is calculated from the product of the b-tagging scale factors for the two b-jets in the event.
Additional uncertainties are related to the photon energy measurement and recon-struction efficiency [38]. The measurement is only weakly sensitive to the photon energy; therefore a simplified two-parameter model is used to capture the effect of variations in the energy scale and resolution. The efficiency variations considered are due to electromagnetic shower shape variations and isolation calculations. Systematic uncertainties from electron and muon selections are negligible and are therefore ignored.
8.2 Theoretical uncertainties
The theoretical uncertainties on the SM calculations of the total Higgs boson production rates are relevant in the determination of the relative rate of Hγjj events compared to the SM expectation. The H → b¯b branching ratio uncertainty follows the recommendation of the LHC Higgs Cross Section Working Group, including the uncertainty in the b-quark mass [46]. Cross-section uncertainties due to the choice of renormalization and factorization scales are estimated by varying the choice of both scales up and down by factors of two independently. The largest variation in each BDT classification category is used to define the uncertainty. Similar uncertainties are calculated for the set of PDF variations defined by the eigenvectors of the PDF4LHC15 nlo mc pdfas set. The impact on signal normalization is evaluated at the reconstruction level after the event selection, and an overall uncertainty
is derived following the PDF4LHC recommendation [16]. Uncertainties in the Herwig 7
parton shower are estimated by varying the ‘HardScaleFactor’ parameter by factors of two and comparing the resulting acceptances [18].
9 Fit results for Higgs boson production
The Higgs boson signal strength µH is defined relative to the total SM prediction for Hγjj
production, and the VBF signal strength µVBF is defined relative to the VBF contribution
only. They are extracted from an unbinned extended maximum-likelihood fit to the di-b-jet invariant mass distribution in all three BDT classification categories. The likelihood is defined as a product of global Poisson distributions with event-by-event probabilities determined from the signal-plus-background model and the constraints for systematic un-certainties, implemented as nuisance parameters. The nuisance parameters control the effects of the systematic uncertainties and are parameterized by Gaussian or log-normal priors. Each prior’s definition constrains its nuisance parameter to the nominal value within its associated uncertainty.
JHEP03(2021)268
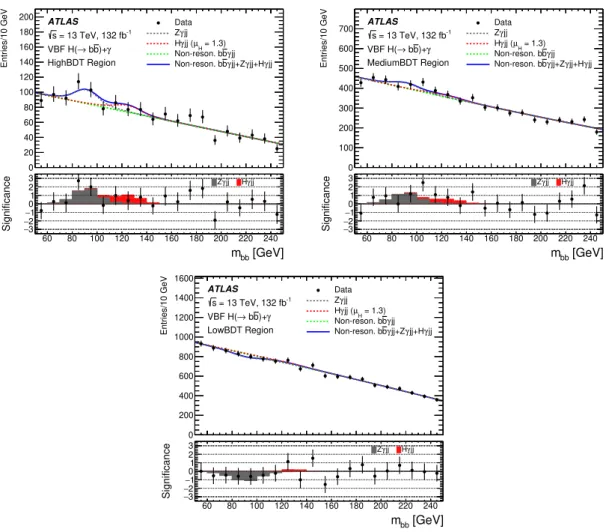
0 20 40 60 80 100 120 140 160 180 200 Entries/10 GeV Data jj γ Z = 1.3) H µ jj ( γ H jj γ b Non-reson. b jj γ jj+H γ jj+Z γ b Non-reson. b ATLAS -1 = 13 TeV, 132 fb s γ )+ b b → VBF H( HighBDT Region 60 80 100 120 140 160 180 200 220 240 [GeV] bb m 3 − 2 − 1 − 0 1 2 3 Significance jj γ Z Hγjj 0 100 200 300 400 500 600 700 Entries/10 GeV Data jj γ Z = 1.3) H µ jj ( γ H jj γ b Non-reson. b jj γ jj+H γ jj+Z γ b Non-reson. b ATLAS -1 = 13 TeV, 132 fb s γ )+ b b → VBF H( MediumBDT Region 60 80 100 120 140 160 180 200 220 240 [GeV] bb m 3 − 2 − 1 − 0 1 2 3 Significance jj γ Z Hγjj 0 200 400 600 800 1000 1200 1400 1600 Entries/10 GeV Data jj γ Z = 1.3) H µ jj ( γ H jj γ b Non-reson. b jj γ jj+H γ jj+Z γ b Non-reson. b ATLAS -1 = 13 TeV, 132 fb s γ )+ b b → VBF H( LowBDT Region 60 80 100 120 140 160 180 200 220 240 [GeV] bb m 3 − 2 − 1 − 01 2 3 Significance jj γ Z HγjjFigure 5. The mbbdistributions in the three event categories, overlaid with contributions from the Hγjj signal as well as the resonant Zγjj and non-resonant b¯bγjj background fits. The combined χ2 per degree of freedom is 45.2/45. The bottom panel in each plot presents the significance of the Higgs boson signal relative to the non-resonant b¯bγjj background in each bin, calculated using a Poisson model [47].
The Higgs boson signal strength is the single parameter of interest, common to all three categories, while the Zγjj contribution strength is fit as three separate parameters, uncorrelated across the categories. Using three Zγjj parameters allows for different rela-tive contributions of QCD and EWK processes in the three categories. The uncorrelated parameters describing the non-resonant b¯bγjj background are allowed to float during the fit to obtain the best independent description of the background in each category. The experimental and theoretical uncertainties are correlated across categories during the fit, reflecting their common derivation and calibration. Signal-injection tests, performed by adding simulated signal to the expected background, confirmed the linearity of the fit with no bias in µH.
The results of the fits to the mbb distributions in data are shown in figure 5, with
JHEP03(2021)268
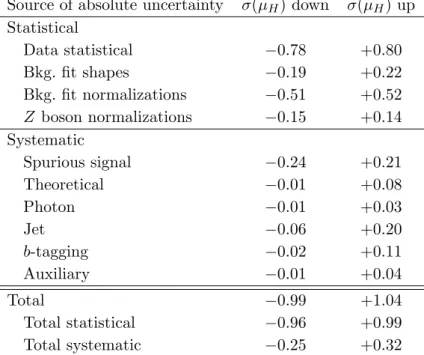
Source of absolute uncertainty σ(µH) down σ(µH) up
Statistical Data statistical −0.78 +0.80 Bkg. fit shapes −0.19 +0.22 Bkg. fit normalizations −0.51 +0.52 Z boson normalizations −0.15 +0.14 Systematic Spurious signal −0.24 +0.21 Theoretical −0.01 +0.08 Photon −0.01 +0.03 Jet −0.06 +0.20 b-tagging −0.02 +0.11 Auxiliary −0.01 +0.04 Total −0.99 +1.04 Total statistical −0.96 +0.99 Total systematic −0.25 +0.32
Table 3. The effect of the uncertainties on the signal strength. The dominant contributions are from the statistical uncertainty of the dataset, background fit uncertainties, and the spurious-signal uncertainty. The statistical uncertainty is calculated by fixing the background fit parameters to their nominal values. Individual uncertainties are then combined to give the total within each group. The small uncertainties from pile-up effects, luminosity measurements, and trigger scale factors are grouped under ‘Auxiliary’ uncertainty.
The inclusive signal strength µH and the VBF signal strength µVBFare both 1.3 ± 1.0. The
similarity of the results is due to the nearly negligible contribution from other Higgs boson production modes in the VBF-enhanced phase space, defined by the high mjj requirement.
If the inclusive signal strength is fit as three separate parameters of interest, the results are µH = 0.7 ± 1.1, 3.8+2.5−2.4, and 3.8+7.0−8.3 in the HighBDT, MediumBDT, and LowBDT
categories, respectively.
The Z normalization factors obtained from the fit are µZ = 1.9 ± 1.2, 1.5 ± 1.1 and
−1.3+1.2
−1.6in the HighBDT, MediumBDT, and LowBDT categories, respectively. The Z
nor-malization and the µH signal strength have a correlation of 15% in the HighBDT category
but are uncorrelated in the other categories. If the Z normalization factors are constrained to be non-negative, the change to the combined Higgs boson signal strength µH is within
rounding errors.
This measurement is consistent with previous results [6]. The dominant uncertainty in the result is the statistical uncertainty of the limited data sample, followed by the back-ground fit uncertainties and the spurious-signal uncertainty. The relative contributions from those and other uncertainties are shown in table 3. Impacts from individual contri-butions are estimated as the difference in quadrature between the Higgs signal strength uncertainties with each nuisance parameter floating and fixed. The asymmetry observed in some of the systematic uncertainties is due to the limited measurement sensitivity: during the profile likelihood calculation, µH can assume values close to 0.
JHEP03(2021)268
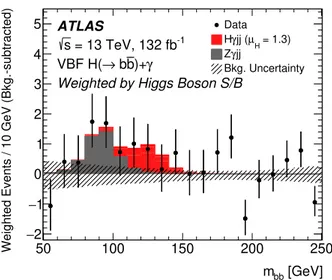
50 100 150 200 250 [GeV] bb m 2 − 1 − 0 1 2 3 4 5Weighted Events / 10 GeV (Bkg.-subtracted)
Data = 1.3) H µ jj ( γ H jj γ Z Bkg. Uncertainty ATLAS -1 = 13 TeV, 132 fb s γ )+ b b → VBF H(
Weighted by Higgs Boson S/B
Figure 6. The combined mbb distribution, after subtracting the fitted non-resonant b¯bγjj back-ground, summed over the three BDT categories weighted by S/B in each category, where S and B are the fitted Higgs boson signal yield and Zγjj + b¯bγjj background yield, respectively, calculated in the mass window containing 68% of the Higgs boson signal. The expected contributions of Hγjj and Zγjj are also shown, scaled by the fitted Higgs boson signal strength and the Zγjj normaliza-tion factors in the three BDT categories. The statistical uncertainty of the fitted non-resonant b¯bγjj background is represented by the hatched band. The statistical uncertainty on data is represented by the error bars on the data points.
The combined mass distribution for the three BDT categories, after the non-resonant b¯bγjj background contribution has been subtracted, is shown in figure6. The events in each BDT category have been weighted by the signal-to-background ratio S/B, as calculated from the fitted signal and background contributions in the 68% confidence-interval mass window around the Higgs boson signal peak.
10 Conclusion
A search has been conducted for the SM Higgs boson produced in association with a high-energy photon in the H(→ b¯b)γjj signature, with a focus on the phase space typical of vector-boson fusion. The search used the full LHC Run 2 dataset of proton-proton collisions at√s = 13 TeV, corresponding to an integrated luminosity of 132 fb−1 collected with the ATLAS detector. A BDT is used to separate events into categories, and the mbb
distribution is fit to extract the Higgs boson signal production rate. The measured Higgs boson signal strength relative to the SM prediction is µH = 1.3 ± 1.0. This corresponds
to an observed signal significance of 1.3 standard deviations, compared to an expected significance of 1.0 standard deviations. The improvement over the previous measurement
of µH = 2.3 ± 1.8 comes from the larger dataset, the updated BDT, and more precise
JHEP03(2021)268
Acknowledgments
We thank CERN for the very successful operation of the LHC, as well as the support staff from our institutions without whom ATLAS could not be operated efficiently.
We acknowledge the support of ANPCyT, Argentina; YerPhI, Armenia; ARC, Aus-tralia; BMWFW and FWF, Austria; ANAS, Azerbaijan; SSTC, Belarus; CNPq and FAPESP, Brazil; NSERC, NRC and CFI, Canada; CERN; ANID, Chile; CAS, MOST and NSFC, China; COLCIENCIAS, Colombia; MSMT CR, MPO CR and VSC CR, Czech Republic; DNRF and DNSRC, Denmark; IN2P3-CNRS and CEA-DRF/IRFU, France; SRNSFG, Georgia; BMBF, HGF and MPG, Germany; GSRT, Greece; RGC and Hong Kong SAR, China; ISF and Benoziyo Center, Israel; INFN, Italy; MEXT and JSPS, Japan; CNRST, Morocco; NWO, Netherlands; RCN, Norway; MNiSW and NCN, Poland; FCT, Portugal; MNE/IFA, Romania; JINR; MES of Russia and NRC KI, Russian Federation;
MESTD, Serbia; MSSR, Slovakia; ARRS and MIZˇS, Slovenia; DST/NRF, South Africa;
MICINN, Spain; SRC and Wallenberg Foundation, Sweden; SERI, SNSF and Cantons of Bern and Geneva, Switzerland; MOST, Taiwan; TAEK, Turkey; STFC, United Kingdom; DOE and NSF, United States of America. In addition, individual groups and members have received support from BCKDF, CANARIE, Compute Canada, CRC and IVADO, Canada; Beijing Municipal Science & Technology Commission, China; COST, ERC, ERDF, Hori-zon 2020 and Marie Sk lodowska-Curie Actions, European Union; Investissements d’Avenir Labex, Investissements d’Avenir Idex and ANR, France; DFG and AvH Foundation, Ger-many; Herakleitos, Thales and Aristeia programmes co-financed by EU-ESF and the Greek NSRF, Greece; BSF-NSF and GIF, Israel; La Caixa Banking Foundation, CERCA Pro-gramme Generalitat de Catalunya and PROMETEO and GenT ProPro-grammes Generalitat Valenciana, Spain; G¨oran Gustafssons Stiftelse, Sweden; The Royal Society and Lever-hulme Trust, United Kingdom.
The crucial computing support from all WLCG partners is acknowledged gratefully, in particular from CERN, the ATLAS Tier-1 facilities at TRIUMF (Canada), NDGF (Denmark, Norway, Sweden), CC-IN2P3 (France), KIT/GridKA (Germany), INFN-CNAF (Italy), NL-T1 (Netherlands), PIC (Spain), ASGC (Taiwan), RAL (UK) and BNL (USA), the Tier-2 facilities worldwide and large non-WLCG resource providers. Major contributors of computing resources are listed in ref. [48].
Open Access. This article is distributed under the terms of the Creative Commons
Attribution License (CC-BY 4.0), which permits any use, distribution and reproduction in any medium, provided the original author(s) and source are credited.
References
[1] ATLAS collaboration, Observation of a new particle in the search for the Standard Model Higgs boson with the ATLAS detector at the LHC,Phys. Lett. B 716 (2012) 1
[arXiv:1207.7214] [INSPIRE].
[2] CMS collaboration, Observation of a New Boson at a Mass of 125 GeV with the CMS Experiment at the LHC,Phys. Lett. B 716 (2012) 30[arXiv:1207.7235] [INSPIRE].
JHEP03(2021)268
[3] E. Gabrielli, F. Maltoni, B. Mele, M. Moretti, F. Piccinini and R. Pittau, Higgs BosonProduction in Association with a Photon in Vector Boson Fusion at the LHC,Nucl. Phys. B 781 (2007) 64[hep-ph/0702119] [INSPIRE].
[4] E. Gabrielli, B. Mele, F. Piccinini and R. Pittau, Asking for an extra photon in Higgs production at the LHC and beyond,JHEP 07 (2016) 003[arXiv:1601.03635] [INSPIRE].
[5] W.H. Furry, A Symmetry Theorem in the Positron Theory,Phys. Rev. 51 (1937) 125
[INSPIRE].
[6] ATLAS collaboration, Search for Higgs bosons produced via vector-boson fusion and decaying into bottom quark pairs in√s = 13 TeV pp collisions with the ATLAS detector,Phys. Rev. D 98 (2018) 052003[arXiv:1807.08639] [INSPIRE].
[7] ATLAS collaboration, Combined measurements of Higgs boson production and decay using up to 80 fb−1 of proton-proton collision data at √s = 13 TeV collected with the ATLAS experiment,Phys. Rev. D 101 (2020) 012002[arXiv:1909.02845] [INSPIRE].
[8] CMS collaboration, Combined measurements of Higgs boson couplings in proton–proton collisions at √s = 13 TeV,Eur. Phys. J. C 79 (2019) 421[arXiv:1809.10733] [INSPIRE].
[9] ATLAS collaboration, Measurements of W H and ZH production in the H → b¯b decay channel in pp collisions at 13 TeV with the ATLAS detector,Eur. Phys. J. C 81 (2021) 178
[arXiv:2007.02873] [INSPIRE].
[10] CMS collaboration, Observation of Higgs boson decay to bottom quarks,Phys. Rev. Lett. 121 (2018) 121801[arXiv:1808.08242] [INSPIRE].
[11] ATLAS collaboration, The ATLAS Experiment at the CERN Large Hadron Collider,2008 JINST 3 S08003[INSPIRE].
[12] ATLAS collaboration, ATLAS Insertable B-Layer Technical Design Report,
CERN-LHCC-2010-013, ATLAS-TDR-19(2010).
[13] ATLAS IBL collaboration, Production and Integration of the ATLAS Insertable B-Layer,
2018 JINST 13 T05008[arXiv:1803.00844] [INSPIRE].
[14] ATLAS collaboration, Performance of the ATLAS Trigger System in 2015, Eur. Phys. J. C 77 (2017) 317[arXiv:1611.09661] [INSPIRE].
[15] J. Alwall et al., The automated computation of tree-level and next-to-leading order
differential cross sections, and their matching to parton shower simulations,JHEP 07 (2014) 079[arXiv:1405.0301] [INSPIRE].
[16] J. Butterworth et al., PDF4LHC recommendations for LHC Run II, J. Phys. G 43 (2016) 023001[arXiv:1510.03865] [INSPIRE].
[17] M. Bahr et al., HERWIG++ Physics and Manual,Eur. Phys. J. C 58 (2008) 639
[arXiv:0803.0883] [INSPIRE].
[18] J. Bellm et al., HERWIG 7.0/HERWIG++ 3.0 release note,Eur. Phys. J. C 76 (2016) 196
[arXiv:1512.01178] [INSPIRE].
[19] P. Nason, A New method for combining NLO QCD with shower Monte Carlo algorithms,
JHEP 11 (2004) 040[hep-ph/0409146] [INSPIRE].
[20] S. Frixione, P. Nason and C. Oleari, Matching NLO QCD computations with Parton Shower simulations: the POWHEG method,JHEP 11 (2007) 070[arXiv:0709.2092] [INSPIRE].
JHEP03(2021)268
[21] S. Alioli, P. Nason, C. Oleari and E. Re, A general framework for implementing NLOcalculations in shower Monte Carlo programs: the POWHEG BOX,JHEP 06 (2010) 043
[arXiv:1002.2581] [INSPIRE].
[22] H.-L. Lai et al., New parton distributions for collider physics,Phys. Rev. D 82 (2010) 074024
[arXiv:1007.2241] [INSPIRE].
[23] T. Sj¨ostrand et al., An introduction to PYTHIA 8.2,Comput. Phys. Commun. 191 (2015) 159[arXiv:1410.3012] [INSPIRE].
[24] ATLAS collaboration, Measurement of the Z/γ∗ boson transverse momentum distribution in pp collisions at√s = 7 TeV with the ATLAS detector,JHEP 09 (2014) 145
[arXiv:1406.3660] [INSPIRE].
[25] R.D. Ball et al., Parton distributions with LHC data, Nucl. Phys. B 867 (2013) 244
[arXiv:1207.1303] [INSPIRE].
[26] D.J. Lange, The EvtGen particle decay simulation package, Nucl. Instrum. Meth. A 462 (2001) 152[INSPIRE].
[27] ATLAS collaboration, The PYTHIA 8 A3 tune description of ATLAS minimum bias and inelastic measurements incorporating the Donnachie-Landshoff diffractive model,
ATL-PHYS-PUB-2016-017(2016).
[28] ATLAS collaboration, The ATLAS Simulation Infrastructure,Eur. Phys. J. C 70 (2010) 823[arXiv:1005.4568] [INSPIRE].
[29] GEANT4 collaboration, GEANT4 — a simulation toolkit,Nucl. Instrum. Meth. A 506 (2003) 250[INSPIRE].
[30] ATLAS collaboration, Topological cell clustering in the ATLAS calorimeters and its performance in LHC Run 1,Eur. Phys. J. C 77 (2017) 490[arXiv:1603.02934] [INSPIRE].
[31] M. Cacciari, G.P. Salam and G. Soyez, The anti-kt jet clustering algorithm,JHEP 04 (2008) 063[arXiv:0802.1189] [INSPIRE].
[32] M. Cacciari, G.P. Salam and G. Soyez, FastJet User Manual,Eur. Phys. J. C 72 (2012) 1896[arXiv:1111.6097] [INSPIRE].
[33] Tagging and suppression of pileup jets with the ATLAS detector,ATLAS-CONF-2014-018
(2014).
[34] ATLAS collaboration, Jet energy scale and resolution measured in proton-proton collisions at√s = 13 TeV with the ATLAS detector,arXiv:2007.02645[INSPIRE].
[35] ATLAS collaboration, ATLAS b-jet identification performance and efficiency measurement with t¯t events in pp collisions at√s = 13 TeV,Eur. Phys. J. C 79 (2019) 970
[arXiv:1907.05120] [INSPIRE].
[36] ATLAS collaboration, Measurement of b-tagging Efficiency of c-jets in t¯t Events Using a Likelihood Approach with the ATLAS Detector,ATLAS-CONF-2018-001(2018).
[37] ATLAS collaboration, Calibration of light-flavour b-jet mistagging rates using ATLAS proton-proton collision data at√s = 13 TeV,ATLAS-CONF-2018-006 (2018).
[38] ATLAS collaboration, Electron and photon performance measurements with the ATLAS detector using the 2015–2017 LHC proton-proton collision data,2019 JINST 14 P12006
JHEP03(2021)268
[39] ATLAS collaboration, Muon reconstruction performance of the ATLAS detector inproton–proton collision data at√s = 13 TeV,Eur. Phys. J. C 76 (2016) 292
[arXiv:1603.05598] [INSPIRE].
[40] ATLAS collaboration, Expected performance of the ATLAS b-tagging algorithms in Run-2,
ATL-PHYS-PUB-2015-022(2015).
[41] A. Hocker et al., TMVA — Toolkit for Multivariate Data Analysis, physics/0703039
[INSPIRE].
[42] CMS collaboration, Search for the standard model Higgs boson produced through vector boson fusion and decaying to bb,Phys. Rev. D 92 (2015) 032008[arXiv:1506.01010] [INSPIRE].
[43] A.D. Bukin, Fitting function for asymmetric peaks,arXiv:0711.4449[INSPIRE].
[44] ATLAS collaboration, Luminosity determination in pp collisions at √s = 13 TeV using the ATLAS detector at the LHC,ATLAS-CONF-2019-021 (2019).
[45] G. Avoni et al., The new LUCID-2 detector for luminosity measurement and monitoring in ATLAS,2018 JINST 13 P07017 [INSPIRE].
[46] LHC Higgs Cross Section Working Group collaboration, Handbook of LHC Higgs Cross Sections: 4. Deciphering the Nature of the Higgs Sector,arXiv:1610.07922[INSPIRE].
[47] G. Choudalakis and D. Casadei, Plotting the Differences Between Data and Expectation,Eur. Phys. J. Plus 127 (2012) 25[arXiv:1111.2062] [INSPIRE].
[48] ATLAS collaboration, ATLAS Computing Acknowledgements,ATL-SOFT-PUB-2020-001
JHEP03(2021)268
The ATLAS collaboration
G. Aad101, B. Abbott127,D.C. Abbott102,A. Abed Abud36,K. Abeling53,D.K. Abhayasinghe93,
S.H. Abidi29,O.S. AbouZeid40, N.L. Abraham155,H. Abramowicz160,H. Abreu159,Y. Abulaiti6, B.S. Acharya66a,66b,o,B. Achkar53,L. Adam99,C. Adam Bourdarios5,L. Adamczyk83a,
L. Adamek165,J. Adelman120,A. Adiguzel12c,ad, S. Adorni54,T. Adye142,A.A. Affolder144, Y. Afik159,C. Agapopoulou64,M.N. Agaras38,A. Aggarwal118,C. Agheorghiesei27c,
J.A. Aguilar-Saavedra138f,138a,ac,A. Ahmad36, F. Ahmadov79,W.S. Ahmed103,X. Ai18, G. Aielli73a,73b,S. Akatsuka85,M. Akbiyik99, T.P.A. ˚Akesson96, E. Akilli54,A.V. Akimov110, K. Al Khoury64,G.L. Alberghi23b,23a,J. Albert174,M.J. Alconada Verzini160,S. Alderweireldt36,
M. Aleksa36,I.N. Aleksandrov79,C. Alexa27b,T. Alexopoulos10,A. Alfonsi119,F. Alfonsi23b,23a, M. Alhroob127,B. Ali140,S. Ali157,M. Aliev164,G. Alimonti68a,C. Allaire36,
B.M.M. Allbrooke155,P.P. Allport21, A. Aloisio69a,69b,F. Alonso88,C. Alpigiani147,
E. Alunno Camelia73a,73b,M. Alvarez Estevez98,M.G. Alviggi69a,69b, Y. Amaral Coutinho80b,
A. Ambler103,L. Ambroz133, C. Amelung36,D. Amidei105,S.P. Amor Dos Santos138a,
S. Amoroso46, C.S. Amrouche54,C. Anastopoulos148, N. Andari143,T. Andeen11,J.K. Anders20, S.Y. Andrean45a,45b, A. Andreazza68a,68b, V. Andrei61a, C.R. Anelli174,S. Angelidakis9,
A. Angerami39,A.V. Anisenkov121b,121a,A. Annovi71a,C. Antel54,M.T. Anthony148,
E. Antipov128,M. Antonelli51,D.J.A. Antrim18,F. Anulli72a, M. Aoki81,J.A. Aparisi Pozo172, M.A. Aparo155,L. Aperio Bella46, N. Aranzabal36, V. Araujo Ferraz80a, R. Araujo Pereira80b, C. Arcangeletti51,A.T.H. Arce49,J-F. Arguin109,S. Argyropoulos52,J.-H. Arling46,
A.J. Armbruster36,A. Armstrong169,O. Arnaez165,H. Arnold119, Z.P. Arrubarrena Tame113, G. Artoni133,H. Asada116, K. Asai125,S. Asai162, T. Asawatavonvanich163,N. Asbah59, E.M. Asimakopoulou170,L. Asquith155,J. Assahsah35e, K. Assamagan29,R. Astalos28a,
R.J. Atkin33a, M. Atkinson171,N.B. Atlay19, H. Atmani64, P.A. Atmasiddha105,K. Augsten140,
V.A. Austrup180,G. Avolio36,M.K. Ayoub15c,G. Azuelos109,ak,D. Babal28a,H. Bachacou143, K. Bachas161,F. Backman45a,45b,P. Bagnaia72a,72b,M. Bahmani84, H. Bahrasemani151, A.J. Bailey172,V.R. Bailey171,J.T. Baines142,C. Bakalis10,O.K. Baker181,P.J. Bakker119,
E. Bakos16,D. Bakshi Gupta8,S. Balaji156,R. Balasubramanian119,E.M. Baldin121b,121a,
P. Balek178, F. Balli143,W.K. Balunas133,J. Balz99,E. Banas84,M. Bandieramonte137, A. Bandyopadhyay19,L. Barak160, W.M. Barbe38,E.L. Barberio104,D. Barberis55b,55a, M. Barbero101, G. Barbour94,T. Barillari114, M-S. Barisits36,J. Barkeloo130,T. Barklow152,
B.M. Barnett142,R.M. Barnett18,Z. Barnovska-Blenessy60a, A. Baroncelli60a,G. Barone29, A.J. Barr133,L. Barranco Navarro45a,45b,F. Barreiro98,J. Barreiro Guimar˜aes da Costa15a, U. Barron160,S. Barsov136, F. Bartels61a, R. Bartoldus152,G. Bartolini101,A.E. Barton89, P. Bartos28a,A. Basalaev46, A. Basan99,A. Bassalat64,ah,M.J. Basso165,C.R. Basson100,
R.L. Bates57, S. Batlamous35f,J.R. Batley32,B. Batool150, M. Battaglia144, M. Bauce72a,72b, F. Bauer143,*,P. Bauer24, H.S. Bawa31, A. Bayirli12c,J.B. Beacham49,T. Beau134,
P.H. Beauchemin168,F. Becherer52,P. Bechtle24,H.P. Beck20,q,K. Becker176, C. Becot46,
A. Beddall12d,A.J. Beddall12a,V.A. Bednyakov79,C.P. Bee154,T.A. Beermann180,M. Begalli80b,
M. Begel29,A. Behera154,J.K. Behr46,F. Beisiegel24,M. Belfkir5,G. Bella160, L. Bellagamba23b, A. Bellerive34,P. Bellos21, K. Beloborodov121b,121a, K. Belotskiy111, N.L. Belyaev111,
D. Benchekroun35a,N. Benekos10,Y. Benhammou160,D.P. Benjamin6,M. Benoit29,
J.R. Bensinger26, S. Bentvelsen119,L. Beresford133,M. Beretta51,D. Berge19,
E. Bergeaas Kuutmann170,N. Berger5,B. Bergmann140,L.J. Bergsten26,J. Beringer18, S. Berlendis7,G. Bernardi134, C. Bernius152,F.U. Bernlochner24,T. Berry93,P. Berta99,
A. Berthold48,I.A. Bertram89, O. Bessidskaia Bylund180,S. Bethke114,A. Betti42,A.J. Bevan92,
JHEP03(2021)268
O. Biebel113,D. Biedermann19,R. Bielski36,K. Bierwagen99,N.V. Biesuz71a,71b,M. Biglietti74a, T.R.V. Billoud140,M. Bindi53,A. Bingul12d,C. Bini72a,72b,S. Biondi23b,23a,C.J. Birch-sykes100, M. Birman178, T. Bisanz36,J.P. Biswal3,D. Biswas179,j,A. Bitadze100,C. Bittrich48,K. Bjørke132,
T. Blazek28a,I. Bloch46, C. Blocker26,A. Blue57,U. Blumenschein92,G.J. Bobbink119,
V.S. Bobrovnikov121b,121a,D. Bogavac14,A.G. Bogdanchikov121b,121a, C. Bohm45a,V. Boisvert93, P. Bokan170,53,T. Bold83a,M. Bomben134, M. Bona92,J.S. Bonilla130,M. Boonekamp143, C.D. Booth93,A.G. Borb´ely57,H.M. Borecka-Bielska90, L.S. Borgna94, A. Borisov122,
G. Borissov89,D. Bortoletto133,D. Boscherini23b,M. Bosman14,J.D. Bossio Sola103,
K. Bouaouda35a,J. Boudreau137,E.V. Bouhova-Thacker89,D. Boumediene38, R. Bouquet134, A. Boveia126,J. Boyd36,D. Boye33c,I.R. Boyko79,A.J. Bozson93,J. Bracinik21,N. Brahimi60d,60c, G. Brandt180,O. Brandt32,F. Braren46,B. Brau102,J.E. Brau130, W.D. Breaden Madden57,
K. Brendlinger46,R. Brener159, L. Brenner36,R. Brenner170,S. Bressler178,B. Brickwedde99, D.L. Briglin21, D. Britton57,D. Britzger114,I. Brock24,R. Brock106,G. Brooijmans39, W.K. Brooks145d,E. Brost29,P.A. Bruckman de Renstrom84, B. Br¨uers46,D. Bruncko28b,
A. Bruni23b,G. Bruni23b,M. Bruschi23b,N. Bruscino72a,72b,L. Bryngemark152,T. Buanes17,
Q. Buat154,P. Buchholz150,A.G. Buckley57,I.A. Budagov79,M.K. Bugge132,O. Bulekov111, B.A. Bullard59,T.J. Burch120,S. Burdin90,C.D. Burgard46,A.M. Burger128,B. Burghgrave8, J.T.P. Burr46,C.D. Burton11,J.C. Burzynski102,V. B¨uscher99, E. Buschmann53,P.J. Bussey57,
J.M. Butler25,C.M. Buttar57,J.M. Butterworth94,W. Buttinger142, C.J. Buxo Vazquez106, A.R. Buzykaev121b,121a, G. Cabras23b,23a,S. Cabrera Urb´an172, D. Caforio56,H. Cai137, V.M.M. Cairo152, O. Cakir4a,N. Calace36, P. Calafiura18,G. Calderini134,P. Calfayan65, G. Callea57, L.P. Caloba80b, A. Caltabiano73a,73b,S. Calvente Lopez98,D. Calvet38,S. Calvet38,
T.P. Calvet101,M. Calvetti71a,71b,R. Camacho Toro134,S. Camarda36,D. Camarero Munoz98, P. Camarri73a,73b,M.T. Camerlingo74a,74b,D. Cameron132,C. Camincher36, S. Campana36, M. Campanelli94, A. Camplani40,V. Canale69a,69b, A. Canesse103,M. Cano Bret77,J. Cantero128,
Y. Cao171,M. Capua41b,41a,R. Cardarelli73a,F. Cardillo172,G. Carducci41b,41a,T. Carli36,
G. Carlino69a,B.T. Carlson137,E.M. Carlson174,166a,L. Carminati68a,68b,R.M.D. Carney152, S. Caron118,E. Carquin145d,S. Carr´a46,G. Carratta23b,23a,J.W.S. Carter165,T.M. Carter50, M.P. Casado14,g, A.F. Casha165,E.G. Castiglia181,F.L. Castillo172,L. Castillo Garcia14,
V. Castillo Gimenez172, N.F. Castro138a,138e,A. Catinaccio36,J.R. Catmore132, A. Cattai36, V. Cavaliere29,V. Cavasinni71a,71b,E. Celebi12b,F. Celli133,K. Cerny129, A.S. Cerqueira80a, A. Cerri155,L. Cerrito73a,73b,F. Cerutti18,A. Cervelli23b,23a,S.A. Cetin12b, Z. Chadi35a, D. Chakraborty120,J. Chan179,W.S. Chan119,W.Y. Chan90,J.D. Chapman32,
B. Chargeishvili158b,D.G. Charlton21,T.P. Charman92,M. Chatterjee20,C.C. Chau34, S. Chekanov6,S.V. Chekulaev166a,G.A. Chelkov79,af,B. Chen78, C. Chen60a,C.H. Chen78, H. Chen15c,H. Chen29,J. Chen60a,J. Chen39,J. Chen26, S. Chen135,S.J. Chen15c,X. Chen15b,
Y. Chen60a,Y-H. Chen46,H.C. Cheng62a,H.J. Cheng15a,A. Cheplakov79,E. Cheremushkina122,
R. Cherkaoui El Moursli35f,E. Cheu7,K. Cheung63,T.J.A. Cheval´erias143,L. Chevalier143, V. Chiarella51,G. Chiarelli71a,G. Chiodini67a,A.S. Chisholm21,A. Chitan27b,I. Chiu162, Y.H. Chiu174,M.V. Chizhov79,K. Choi11,A.R. Chomont72a,72b,Y. Chou102, Y.S. Chow119,
L.D. Christopher33e, M.C. Chu62a,X. Chu15a,15d,J. Chudoba139,J.J. Chwastowski84, D. Cieri114, K.M. Ciesla84, V. Cindro91, I.A. Cioar˘a27b,A. Ciocio18,F. Cirotto69a,69b,Z.H. Citron178,k, M. Citterio68a, D.A. Ciubotaru27b,B.M. Ciungu165,A. Clark54,P.J. Clark50,S.E. Clawson100, C. Clement45a,45b,L. Clissa23b,23a,Y. Coadou101,M. Cobal66a,66c,A. Coccaro55b, J. Cochran78,
R. Coelho Lopes De Sa102, H. Cohen160, A.E.C. Coimbra36,B. Cole39, A.P. Colijn119,J. Collot58, P. Conde Mui˜no138a,138h,S.H. Connell33c,I.A. Connelly57,F. Conventi69a,al,
A.M. Cooper-Sarkar133,F. Cormier173,L.D. Corpe94,M. Corradi72a,72b,E.E. Corrigan96,