JHEP10(2017)132
Published for SISSA by SpringerReceived: August 10, 2017 Revised: September 18, 2017 Accepted: September 29, 2017 Published: October 19, 2017
Measurement of inclusive and differential cross
sections in the H → ZZ
∗
→ 4` decay channel in pp
collisions at
√
s = 13 TeV with the ATLAS detector
The ATLAS collaboration
E-mail:
atlas.publications@cern.ch
Abstract: Inclusive and differential fiducial cross sections of Higgs boson production in
proton-proton collisions are measured in the H → ZZ
∗→ 4` decay channel. The
proton-proton collision data were produced at the Large Hadron Collider at a centre-of-mass energy
of 13 TeV and recorded by the ATLAS detector in 2015 and 2016, corresponding to an
in-tegrated luminosity of 36.1 fb
−1. The inclusive fiducial cross section in the H → ZZ
∗→ 4`
decay channel is measured to be 3.62 ± 0.50 (stat)
+0.25−0.20(sys) fb, in agreement with the
Standard Model prediction of 2.91 ± 0.13 fb. The cross section is also extrapolated to the
total phase space including all Standard Model Higgs boson decays. Several differential
fiducial cross sections are measured for observables sensitive to the Higgs boson production
and decay, including kinematic distributions of jets produced in association with the Higgs
boson. Good agreement is found between data and Standard Model predictions. The
re-sults are used to put constraints on anomalous Higgs boson interactions with Standard
Model particles, using the pseudo-observable extension to the kappa-framework.
Keywords: Hadron-Hadron scattering (experiments), Higgs physics
JHEP10(2017)132
Contents
1
Introduction
1
2
ATLAS detector
2
3
Theoretical predictions and event simulation
3
4
Event selection
5
5
Fiducial phase space
7
6
Background estimates
9
7
Measured data yields
10
8
Signal extraction and correction for detector effects
10
9
Systematic uncertainties
15
10 Results
16
11 Conclusion
24
The ATLAS collaboration
32
1
Introduction
The ATLAS and CMS Collaborations at the Large Hadron Collider (LHC) have performed
extensive studies of the Higgs boson properties in the past few years. The Higgs boson
mass has been measured to be m
H= 125.09 ± 0.24 GeV [
1
] and no significant deviations
from Standard Model (SM) predictions have been found in the cross sections measured
per production mode, the branching ratios [
2
], or spin and parity quantum numbers [
3
–
6
].
Furthermore, inclusive and differential fiducial cross sections of Higgs boson production,
defined as background-subtracted event yields corrected for the detector response, have
been measured in proton-proton (pp) collisions at a centre-of-mass energy of
√
s = 8 TeV,
using the 4` (` = e, µ), γγ, and eνµν final states [
7
–
12
]. The measured differential cross
sections are also in good agreement with the SM predictions.
This paper presents a measurement of inclusive and differential fiducial cross sections
in the H → ZZ
∗→ 4` decay channel using pp collisions at
√
s = 13 TeV recorded with the
ATLAS detector. The combined effect of a higher centre-of-mass energy and an integrated
JHEP10(2017)132
of almost four compared to the previous analysis at
√
s = 8 TeV. Significantly larger gains
are expected in the regions of the differential distributions that probe higher momentum
scales due to increased parton-parton luminosities. The differential cross sections presented
in this paper are measured in a fiducial phase space to avoid model-dependent
extrapola-tions. The observed distributions are corrected for detector inefficiency and resolution.
Fiducial cross sections are presented both inclusively and separately for each of the final
states of the H → ZZ
∗→ 4` decay (4µ, 2e2µ, 2µ2e, 4e). Differential fiducial cross sections
are presented for various observables that describe Higgs boson production and decay in
pp collisions. They are inclusive in the different final states and Higgs boson production
mechanisms, such as gluon-gluon fusion (ggF) or vector-boson fusion (VBF). The Higgs
boson transverse momentum
1p
T,4`can be used to test perturbative QCD calculations,
especially when separated into exclusive jet multiplicities. This variable is also sensitive to
the Lagrangian structure of the Higgs boson interactions [
13
]. The Higgs boson rapidity
distribution |y
4`| is sensitive to the parton distribution functions (PDFs) of the colliding
protons. The decay variables |cos θ
∗| and m
34test the spin and parity of the Higgs boson.
The variable |cos θ
∗| is defined as the magnitude of the cosine of the decay angle of the
leading lepton pair in the four-lepton rest frame with respect to the beam axis.
The
variables m
12and m
34refer to the invariant masses of the leading and subleading lepton
pairs and correspond to the invariant masses of the on-shell and off-shell Z bosons produced
in the Higgs boson decay. The number of jets N
jetsproduced in association with the Higgs
boson and the transverse momentum p
lead.jetTof the leading jet both provide sensitivity to
the theoretical modelling of high-p
Tquark and gluon emission. The invariant mass m
jjof
the two leading jets in the event is sensitive to different production mechanisms. The signed
angle between the two leading jets in the transverse plane
2∆φ
jjis another observable that
tests the spin and parity of the Higgs boson [
14
].
Providing fiducial cross sections simplifies the testing of theoretical models with
H → ZZ
∗→ 4` final states since the response of the detector has been corrected for. As
an example, the cross section in the m
12vs m
34observable plane is interpreted in the
framework of pseudo-observables [
15
], which are derived from on-shell decay amplitudes
and provide a generalization of the kappa-framework [
16
]. Limits are set on parameters
describing anomalous Higgs boson interactions with leptons and Z bosons.
2
ATLAS detector
The ATLAS detector [
17
] is a multi-purpose detector with a forward-backward symmetric
cylindrical geometry. At small radii, the inner detector (ID), immersed in a 2 T magnetic
field produced by a thin superconducting solenoid located in front of the calorimeter,
1
ATLAS uses a right-handed coordinate system with its origin at the nominal interaction point (IP) in the centre of the detector and the z-axis along the beam pipe. The x-axis points from the IP to the centre of the LHC ring, and the y-axis points upward. Cylindrical coordinates (r, φ) are used in the transverse plane, φ being the azimuthal angle around the z-axis. The pseudorapidity is defined in terms of the polar angle θ as η = − ln tan(θ/2).
2∆φjjis defined as ∆φjj= φj1− φj2, if ηj1> ηj2, otherwise ∆φjj= φj2− φj1, where j1 is the leading and j2 the subleading jet.
JHEP10(2017)132
is made up of a fine-granularity pixel detector, including the newly installed insertable
B-layer [
18
,
19
], a microstrip detector, as well as a straw-tube tracking detector. The
silicon-based detectors cover the pseudorapidity range |η| < 2.5. The gas-filled
straw-tube transition radiation tracker complements the silicon tracker at larger radii up to
|η| < 2 and also provides electron identification capabilities based on transition radiation.
The electromagnetic (EM) calorimeter is a lead/liquid-argon sampling calorimeter with
accordion geometry. The calorimeter is divided into a barrel section covering |η| < 1.475
and two end-cap sections covering 1.375 < |η| < 3.2. For |η| < 2.5 it is divided into
three layers in depth, which are finely segmented in η and φ. A thin presampler layer,
covering |η| < 1.8, is used to correct for fluctuations in upstream energy losses. A hadronic
calorimeter in the region |η| < 1.7 uses steel absorbers and scintillator tiles as the active
medium. A liquid-argon calorimeter with copper absorbers is used in the hadronic
end-cap calorimeters, which covers the region 1.5 < |η| < 3.2. A forward calorimeter using
copper or tungsten absorbers with liquid argon completes the calorimeter coverage up to
|η| = 4.9. The muon spectrometer (MS) measures the deflection of muon trajectories within
|η| < 2.7, using three layers of precision drift tube chambers, with cathode strip chambers
in the innermost layer for |η| > 2.0. The deflection is provided by a toroidal magnetic field
from air-core superconducting magnets. The field integral of the toroids ranges between
2.0 and 6.0 T·m across most of the detector. The muon spectrometer is instrumented
with trigger chambers covering |η| < 2.4. Events are selected using a first-level trigger
implemented in custom electronics, which reduces the event rate to a maximum of 100 kHz
using a subset of detector information. Software algorithms with access to the full detector
information are then used in the high-level trigger to yield a recorded event rate of about
1 kHz [
20
].
3
Theoretical predictions and event simulation
The Higgs boson production cross sections and decay branching ratios, as well as their
uncertainties, are taken from refs. [
16
,
21
–
23
], and are referred to as LHCXSWG. The cross
section for Higgs boson production via ggF is available at next-to-next-to-next-to-leading
order (N3LO) in QCD and has next-to-leading-order (NLO) electroweak (EW) corrections
applied [
24
–
37
]. The cross section for the VBF process is calculated with full NLO QCD
and EW corrections [
38
–
40
], and approximate next-to-next-to-leading-order (NNLO) QCD
corrections are applied [
41
]. The cross sections for the production of an electroweak boson
in association with a Higgs boson, V H (V = W, Z), are calculated at NNLO accuracy in
QCD [
42
,
43
] and NLO EW radiative corrections [
44
] are applied. The cross section for the
associated production of a Higgs boson with a t¯
t pair, t¯
tH, is calculated at NLO accuracy
in QCD [
45
–
48
]. The cross section for the b¯
bH process is calculated by the Santander
matching of the five-flavour scheme (NNLO in QCD) and four-flavour scheme (NLO in
QCD) [
49
]. The composition of the different production modes in the SM is 87.3% (ggF),
6.8% (VBF), 4.1% (V H), 0.9% (t¯
tH), 0.9% (b¯
bH).
The Higgs boson decay branching ratio to the four-lepton final state (` = e, µ) for
JHEP10(2017)132
which includes the complete NLO QCD and EW corrections, and the interference effects
between identical final-state fermions. Due to the latter, the expected branching ratios of
the 4e and 4µ final states are about 10% higher than the branching ratios to 2e2µ and
2µ2e final states.
The Powheg-Box v2 Monte Carlo (MC) event generator [
53
–
55
] is used to simulate
ggF [
56
], VBF [
57
] and V H [
58
] processes, using the PDF4LHC NLO PDF set [
59
]. The
ggF Higgs boson production is accurate to NNLO in QCD, using the Powheg method
for merging the NLO Higgs boson plus jet cross section with the parton shower, and the
MiNLO method [
60
,
61
] to simultaneously achieve NLO accuracy for inclusive Higgs boson
production. Furthermore, a reweighting procedure is performed using the HNNLO
pro-gram [
62
–
64
] to achieve full NNLO accuracy [
65
]. This sample is referred to as NNLOPS.
The VBF and V H samples are produced at NLO accuracy in QCD. For V H, the MiNLO
method is used to merge zero- and one-jet events. For Higgs boson production in association
with a heavy quark pair, events are simulated at NLO with MadGraph5 aMC@NLO
(v.2.2.3 for t¯
tH and v.2.3.3 for b¯
bH [
66
]) [
67
], using the CT10nlo PDF set [
68
] for t¯
tH
and the NNPDF23 PDF set [
69
] for b¯
bH. For the ggF, VBF, V H, and b¯
bH production
mechanisms, Pythia 8 [
70
,
71
] is used for the H → ZZ
∗→ 4` decay as well as for parton
showering, hadronization, and multiple partonic interactions using the AZNLO parameter
set [
72
]. For the t¯
tH production mechanism, Herwig++ [
73
,
74
] is used with the UEEE5
parameter set [
75
].
The measured event yields and the differential fiducial cross-section measurements are
compared to a SM prediction constructed from the MC predictions presented above, after
normalizing each sample using the corresponding LHCXSWG prediction. All samples are
generated with m
H= 125 GeV.
An alternative prediction for ggF SM Higgs boson production is generated using
Mad-Graph5 aMC@NLO v.2.3.3 at NLO accuracy in QCD for zero, one, two additional jets,
merged with the FxFx scheme [
67
,
76
], using the NNPDF30 nlo as 0118 PDF set [
77
].
This MG5 aMC@NLO FxFx sample is interfaced to Pythia 8 for Higgs boson decay,
parton showering, hadronization and multiple partonic interactions using the A14
param-eter set [
78
].
The data are also compared to ggF SM Higgs boson production in the
4` decay channel simulated with HRes v2.3 [
64
,
79
], using the MSTW2008 NNLO PDF
set [
80
]. The HRes program computes fixed-order cross sections for ggF SM Higgs boson
production up to NNLO in QCD and describes the p
T,4`distribution at NLO. All-order
resummation of soft-gluon effects at small transverse momenta is consistently included up
to next-to-next-to-leading logarithmic order (NNLL) in QCD, using dynamic factorization
and resummation scales (the central scales are chosen to be m
H/2). The program
imple-ments top quark and bottom quark mass dependence up to next-to-leading logarithmic
order (NNL) + NLO in QCD. At NNLL + NNLO accuracy only the top quark
contribu-tion is considered. HRes does not perform parton showering and QED final-state radiacontribu-tion
effects are not included. Both the MG5 aMC@NLO FxFx and the HRes predictions are
normalized using the LHCXSWG cross section.
A ggF sample used to study deviations from the SM predictions within the
JHEP10(2017)132
and the NN23PDF PDF set. The sample is interfaced to Pythia 8 using the A14 parameter
set. It is normalized using the LHCXSWG cross section.
The ZZ
(∗)continuum background from quark-antiquark annihilation is simulated with
Sherpa 2.2 [
83
–
85
], using the NNPDF3.0 NNLO PDF set. NLO accuracy is achieved in
the matrix element calculation for zero- and one-jet final states and LO accuracy for
two-and three-jet final states. The merging is performed with the Sherpa parton shower [
86
]
using the MePs@NLO prescription [
87
]. NLO EW corrections are applied as a function of
the invariant mass of the ZZ
∗system m
ZZ∗[
88
,
89
]. The gluon-induced ZZ
∗production is
modelled with gg2VV [
90
] at leading order in QCD. The K-factor accounting for missing
higher-order QCD effects in the calculation of the gg → ZZ
∗continuum is taken to be
1.7 ± 1.0 [
91
–
96
].
Sherpa 2.2 is also used to generate samples of the Z+jets background at NLO accuracy
for zero-, one- and two-jet final states and LO accuracy for three- and four-jet final states.
In this measurement, the Z+jets background is normalized using control samples from data.
For comparisons with simulation, the QCD NNLO Fewz [
97
,
98
] and Mcfm cross-section
calculations are used for inclusive Z boson and Z + b¯
b production, respectively. Samples
for the t¯
t background are produced with Powheg-Box interfaced to Pythia 6 [
70
] for
parton showering and hadronization, to Photos [
99
] for QED radiative corrections, to
Tauola [
100
,
101
] for the simulation of τ lepton decays and to EvtGen v.1.2.0 [
102
] for
the simulation of b-hadron decays. For this sample, the Perugia 2012 parameter set [
103
] is
used. The W Z background is modelled using Powheg-Box+Pythia 8 and the AZNLO
parameter set. The triboson backgrounds ZZZ, W ZZ, and W W Z with four or more
leptons originating from the hard scatter are produced with Sherpa 2.1. MadGraph,
interfaced to Pythia 8 with the A14 parameter set is used to simulate the all-leptonic
t¯
t + Z as well as the t¯
t + W processes.
The particle-level events produced by each event generator are passed through the
Geant4 [
104
] simulation of the ATLAS detector [
105
] and reconstructed in the same
way as the data.
Additional pp interactions in the same and nearby bunch crossings
(pile-up) are simulated using inelastic pp collisions generated using Pythia 8 (with the
A2 MSTW2008LO parameter set) and overlaid on the simulated events discussed above.
The MC events are weighted to reproduce the distribution of the average number of
inter-actions per bunch crossing observed in the data.
4
Event selection
Events with at least four leptons are selected with single-lepton, dilepton and trilepton
trig-gers. The trigger selection requirements, e.g. the minimum transverse energy E
T/transverse
momentum p
T, the identification and the isolation requirements, were tightened
periodi-cally during the data-taking to maintain a maximum overall trigger rate as the
instanta-neous luminosity increased. For example, the E
Tthreshold changed from 24 to 26 GeV for
the single-electron trigger. The multilepton triggers have lower E
Tor p
Trequirements and
more relaxed identification requirements. The combined trigger efficiency in this analysis
is about 98%. The data are subjected to quality requirements to reject events in which
JHEP10(2017)132
detector components were not operating correctly. Events are required to have at least one
vertex with two associated tracks with p
T> 400 MeV, and the primary vertex is chosen to
be the reconstructed vertex with the largest
P p
2T
of reconstructed tracks.
Electrons are reconstructed using tracks in the ID and energy clusters in the EM
calorimeter [
106
]. They are required to satisfy loose identification criteria based on
track-ing and calorimeter information. Muons are reconstructed as tracks in the ID and the
MS [
107
] if they lie in the region 0.1 < |η| < 2.5. In the region |η| < 0.1, the MS has
reduced coverage, and muons are reconstructed from ID tracks and identified by either a
minimal energy deposit in the calorimeter or hits in the MS. For 2.5 < |η| < 2.7, only
the MS can be used. For events with four muons, at least three muons are required to be
reconstructed by combining ID and MS tracks. Each muon (electron) must have transverse
momentum p
T> 5 GeV (E
T> 7 GeV), within the pseudorapidity range |η| < 2.7 (2.47)
and with a longitudinal impact parameter |z
0sin(θ)| < 0.5 mm. Muons originating from
cosmic rays are removed with the transverse impact parameter requirement |d
0| < 1 mm.
Jets are reconstructed from topological clusters of calorimeter cells using the anti-k
talgo-rithm [
108
,
109
] with the radius parameter R = 0.4. Jets are corrected for detector response
and pile-up contamination [
110
,
111
] and required to have p
T> 30 GeV, and |η| < 4.5. In
order to avoid double counting of electrons also reconstructed as jets, jets are removed if
∆R(jet, e) =
p∆φ(jet, e)
2+ ∆η(jet, e)
2< 0.2. This overlap removal is also applied to jets
close to muons if the jet has fewer than three tracks and the energy and momentum
differ-ences between the muon and the jet are small (p
T,µ> 0.5 p
T,jetand p
T,µ> 0.7 p
T,jet,tracks),
or if ∆R(jet, µ) < 0.1.
Higgs boson candidates are formed by selecting two same-flavour opposite-sign (SFOS)
lepton pairs, called a lepton quadruplet. The analysis selection proceeds in parallel for the
four final states (4µ, 2e2µ, 2µ2e, 4e, where the first two leptons refer to the leading lepton
pair). The leading pair is defined as the SFOS pair with the mass m
12closest to the Z
boson mass and the subleading pair is defined as the SFOS pair with the mass m
34second
closest to the Z boson mass. Mispairing within a quadruplet occurs for about 1% of the
selected events for the 4µ or 4e final states. Furthermore, a quadruplet can be formed with
an extra lepton originating from the W/Z for V H or t¯
tH production, moving m
4`away
from m
H. The expected rate for V H or t¯
tH with leptonic decays is about 0.3% of all Higgs
events in the full m
4`range after the event selection. For each final state, a quadruplet
is chosen in which the three leading leptons pass p
T(E
T) > 20, 15, 10 GeV. In addition
to the dilepton mass, lepton separation and J/ψ veto requirements (given in table
1
),
loose calorimeter- and track-based isolation as well as impact parameter requirements are
imposed on the leptons. For the track-based isolation, the sum of the p
Tof the tracks lying
within a cone of size ∆R = min[0.3, 10 GeV/p
T] (min[0.2, 10 GeV/E
T]) around the muon
(electron) is required to be smaller than 15% of the lepton p
T(E
T). Similarly, the sum
of the calorimeter E
Tdeposits in a cone of size ∆R = 0.2 around the muon (electron) is
required to be smaller than 30% (20%) of the lepton p
T(E
T). As the four leptons should
originate from a common vertex, a requirement on the χ
2value of a common vertex fit
is applied, corresponding to a signal efficiency of 99.5% for all decay channels. If more
JHEP10(2017)132
[GeV]
FSR-corrected 4lm
80 90 100 110 120 130 140 150 160 170
Events / 2.5 GeV
0
10
20
30
40
50
60
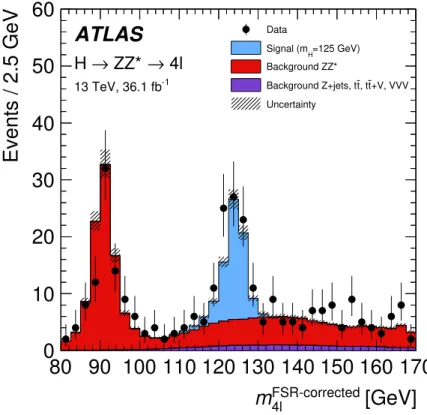
Data =125 GeV) H Signal (m Background ZZ* +V, VVV t , t t Background Z+jets, t UncertaintyATLAS
4l
→
ZZ*
→
H
-1 13 TeV, 36.1 fbFigure 1. Four-lepton invariant mass distribution of the selected events before the m4`requirement,
corrected for final-state radiation (FSR). The error bars on the data points indicate the statistical uncertainty. The SM Higgs boson signal prediction is obtained from the samples discussed in section3. The backgrounds are determined following the description in section 6. The uncertainty in the prediction is shown by the hatched band, calculated as described in section 9.
highest expected signal rate after reconstruction and event selection is selected, in the
order: 4µ, 2e2µ, 2µ2e and 4e. In order to improve the four-lepton mass reconstruction,
the reconstructed final-state radiation (FSR) photons in Z boson decays are accounted for
using the same strategy as in the Run-1 data analysis [
112
]. The invariant mass distribution
of the four leptons of the selected events is shown in figure
1
. Only events with a four-lepton
invariant mass in the range 115–130 GeV are used in the extraction of the signal.
The selected events are divided into bins of the variables of interest. The bin boundaries
are chosen such that each bin has an expected signal significance greater than 2σ (where the
significance is calculated from the number of signal events S and the number of background
events B as S/
√
S + B) and that there are minimal migrations between bins, which reduces
the model dependence of the correction for the detector response.
5
Fiducial phase space
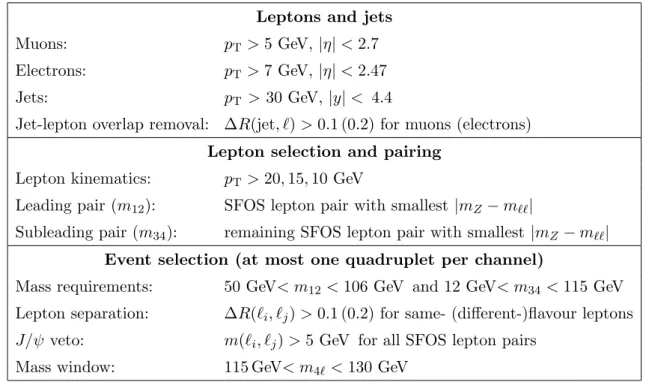
The fiducial cross sections are defined at particle level using the selection requirements
outlined in table
1
, which are chosen to closely match those in the detector-level analysis
JHEP10(2017)132
Leptons and jets
Muons:
p
T> 5 GeV, |η| < 2.7
Electrons:
p
T> 7 GeV, |η| < 2.47
Jets:
p
T> 30 GeV, |y| < 4.4
Jet-lepton overlap removal:
∆R(jet, `) > 0.1 (0.2) for muons (electrons)
Lepton selection and pairing
Lepton kinematics:
p
T> 20, 15, 10 GeV
Leading pair (m
12):
SFOS lepton pair with smallest |m
Z− m
``|
Subleading pair (m
34):
remaining SFOS lepton pair with smallest |m
Z− m
``|
Event selection (at most one quadruplet per channel)
Mass requirements:
50 GeV< m
12< 106 GeV and 12 GeV< m
34< 115 GeV
Lepton separation:
∆R(`
i, `
j) > 0.1 (0.2) for same- (different-)flavour leptons
J/ψ veto:
m(`
i, `
j) > 5 GeV for all SFOS lepton pairs
Mass window:
115 GeV< m
4`< 130 GeV
Table 1. List of event selection requirements which define the fiducial phase space of the cross-section measurement. SFOS lepton pairs are same-flavour opposite-sign lepton pairs.
The fiducial selection is applied to final-state
3electrons and muons that do not
orig-inate from hadrons or τ decays.
The leptons are “dressed”, i.e. the four-momenta of
photons within a cone of size ∆R = 0.1 are added to the lepton four-momentum, requiring
the photons to not originate from hadron decays. Particle-level jets are reconstructed from
final-state particles using the anti-k
talgorithm with radius parameter R = 0.4. Electrons,
muons, neutrinos (if they are not from hadron decays) and photons used to dress leptons,
are excluded from the jet clustering. Jets are removed if they are within a cone of size
∆R = 0.1 (0.2) around a selected muon (electron).
Quadruplets are formed with the selected dressed leptons. Using the same procedure as
for reconstructed events reproduces the mispairing of the leptons from Higgs boson decays
when assigning them to the leading and subleading Z bosons and the inclusion of leptons
originating from vector bosons produced in association with the Higgs boson. The variables
used in the differential cross-section measurement are calculated using the dressed leptons
in the quadruplets.
The acceptance of the fiducial selection (with respect to the full phase space of
H → ZZ
∗→ 2`2`
0, where `, `
0= e or µ) is 42% for a SM Higgs boson with m
H
= 125 GeV.
The ratio of the number of events passing the detector-level event selection to those passing
the particle-level selection is 53%. Due to resolution effects, about 2% of the events which
pass the detector-level selection fail the particle-level selection.
3Final-state particles are defined as particles with a lifetime cτ > 10 mm. For electrons and muons, this corresponds to leptons after final state radiation.
JHEP10(2017)132
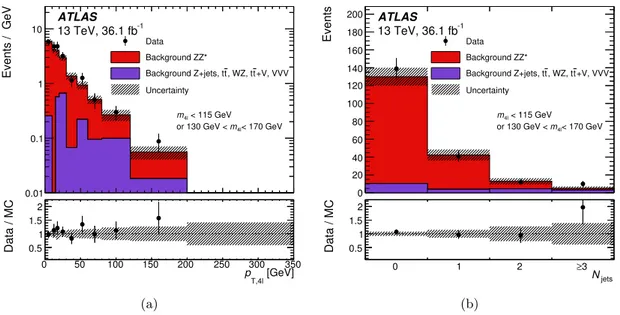
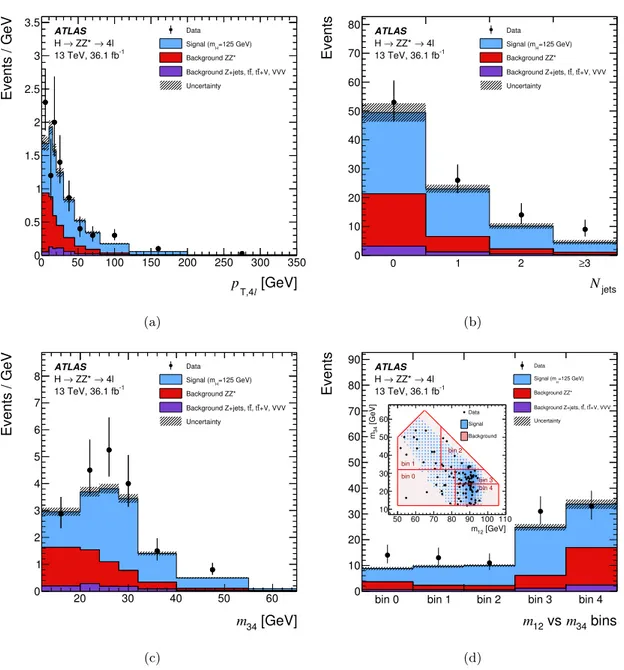
Events / GeV 0.01 0.1 1 10 Data Background ZZ* +V, VVV t , WZ, t t Background Z+jets, t Uncertainty ATLAS -1 13 TeV, 36.1 fb < 115 GeV 4l m < 170 GeV 4l m or 130 GeV < [GeV] T,4l p 0 50 100 150 200 250 300 350 Data / MC 0.5 1 1.5 2 (a) Events 0 20 40 60 80 100 120 140 160 180 200 Data Background ZZ* +V, VVV t , WZ, t t Background Z+jets, t Uncertainty ATLAS -1 13 TeV, 36.1 fb < 115 GeV 4l m < 170 GeV 4l m or 130 GeV < jets N 0 1 2 ≥3 Data / MC 0.5 1 1.5 2 (b)Figure 2. Reconstructed event yields in bins of (a) the transverse momentum of the four lep-tons pT,4` and (b) the number of jets Njets, in a non-resonant ZZ∗-enriched control region,
ob-tained by applying the full event selection except for the m4` window, i.e. m4` < 115 GeV or
130 GeV< m4`< 170 GeV. The error bars on the data points indicate the statistical uncertainty.
The uncertainty in the prediction is shown by the dashed band. The bottom part of the figures shows the ratio of data to the MC expectation.
6
Background estimates
Non-resonant SM ZZ
∗production via q ¯
q annihilation and gluon-gluon fusion can result in
four prompt leptons in the final state and constitutes the largest background for this
analy-sis. It is estimated using the Sherpa and gg2VV simulated samples presented in section
3
.
To cross-check the theoretical modelling of this background, a ZZ
∗-enriched control region
is formed using almost the full event selection, but requiring that the four-lepton
invari-ant mass not lie within the region 115 GeV < m
4`<130 GeV. In this control region,
good agreement is observed between the simulation and the data for all distributions, as
demonstrated for p
T,4`and N
jetsin figure
2
.
Other processes that contribute to the background, such as Z + jets, t¯
t, and W Z,
contain at least one jet, photon or lepton candidate that is misidentified as a prompt lepton.
These backgrounds are significantly smaller than the non-resonant ZZ
∗background and
are estimated using data where possible, following slightly different approaches for the ``µµ
and ``ee final states [
112
].
In the ``µµ final states, the normalizations for the Z + jets and t¯
t backgrounds are
determined using fits to the invariant mass of the leading lepton pair in dedicated data
control regions. The control regions are formed by relaxing the χ
2requirement on the
vertex fit, and by inverting or relaxing isolation and/or impact-parameter requirements on
the subleading muon pair. An additional control region (eµµµ) is used to improve the t¯
t
JHEP10(2017)132
region are obtained separately for t¯
t and Z + jets using simulation. The shapes of the
Z + jets and t¯
t backgrounds for the differential observables are taken from simulation and
normalized using the inclusive data-driven estimate. Comparisons in the control regions
show good agreement between data and the simulation for the different observables.
The ``ee control-region selection requires the electrons in the subleading lepton pair
to have the same charge, and relaxes the identification and isolation requirements on the
electron candidate with the lowest transverse energy. This electron candidate, denoted
as X, can be a light-flavour jet, a photon conversion or an electron from heavy-flavour
hadron decay. The heavy-flavour background is completely determined from simulation,
whereas the light-flavour and photon conversion background is obtained with the sPlot [
113
]
method, based on a fit to the number of hits in the innermost ID layer in the data control
region. Transfer factors for the light-flavour jets and converted photons, obtained from
simulated samples, are corrected using Z + X control regions and then used to extrapolate
the extracted yields to the signal region. Both the extraction of the yield in the control
region and the extrapolation are performed in bins of the transverse momentum of the
electron candidate and the jet multiplicity. In order to extract the shape of the backgrounds
from light-flavour jets and photon conversions in bins of the differential distributions, a
similar method is used, except that the extraction and extrapolation is now performed as a
function of the transverse momentum of the electron candidate in each bin of the variable
of interest.
The m
4`shapes are extracted from simulation for most background components except
for the light-flavour jet + conversion contribution in the ``ee final state, which is not well
described by the simulation and therefore taken from the control region and extrapolated
using the data-corrected efficiencies. It was observed that the m
4`shape of the Z + jets
and t¯
t backgrounds does not change significantly across the differential distributions, and
so the same shape, obtained using all available events, is used for all bins.
The background from W Z production is included in the data-driven estimates for
the ``ee final states, while it is added from simulation for the ``µµ final states. The
contributions from t¯
t + Z and triboson processes are very small and taken from simulated
samples.
7
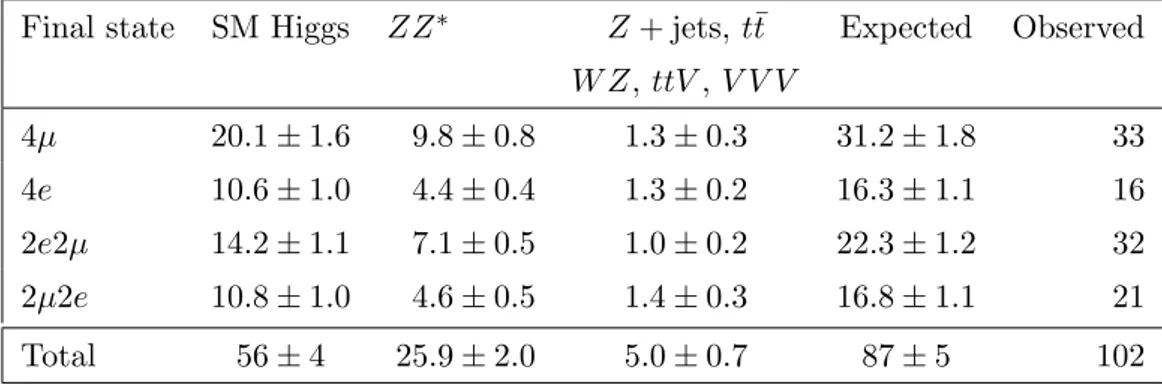
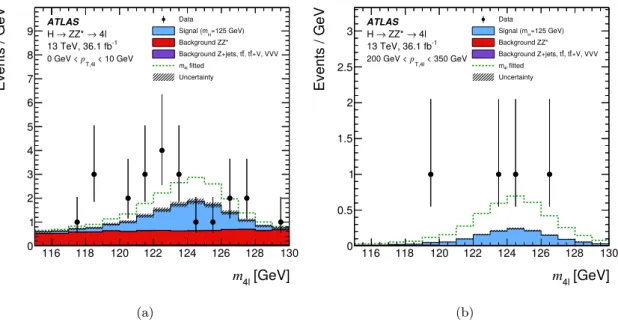
Measured data yields
The observed number of events in the four decay channels after the event selection, as well
as the expected signal and background yields, is presented in table
2
. Figure
3
shows the
expected and observed event yields for four of the measured differential spectra. The total
observed and predicted event counts agree within 1.3 standard deviations.
8
Signal extraction and correction for detector effects
To extract the number of signal events in each bin of a differential distribution (or for each
decay channel for the inclusive fiducial cross section), invariant mass templates for the
JHEP10(2017)132
Final state
SM Higgs
ZZ
∗Z + jets, t¯
t
Expected
Observed
W Z, ttV , V V V
4µ
20.1 ± 1.6
9.8 ± 0.8
1.3 ± 0.3
31.2 ± 1.8
33
4e
10.6 ± 1.0
4.4 ± 0.4
1.3 ± 0.2
16.3 ± 1.1
16
2e2µ
14.2 ± 1.1
7.1 ± 0.5
1.0 ± 0.2
22.3 ± 1.2
32
2µ2e
10.8 ± 1.0
4.6 ± 0.5
1.4 ± 0.3
16.8 ± 1.1
21
Total
56 ± 4
25.9 ± 2.0
5.0 ± 0.7
87 ± 5
102
Table 2. Number of expected and observed events in the four decay channels after the event selection, in the mass range 115 GeV< m4`< 130 GeV. The sum of the expected number of SM
Higgs boson events and the estimated background yields is compared to the data. Combined statistical and systematic uncertainties are included for the predictions (see section9).
The signal shape is obtained from the simulated samples described in section
3
assuming a
Higgs boson mass of 125 GeV. Most of the background shapes are also obtained from the
simulated samples described in section
3
, while some of the backgrounds in the ``ee channel
are derived from control regions in data, as discussed in section
6
. The normalization of
the backgrounds is fixed in this fit. Figures
4
and
5
show the data, templates and best
fits for the m
4`distributions in the four decay channels for the extraction of the inclusive
fiducial cross section, and two bins of the transverse momentum of the four leptons. For the
differential distributions, no split into decay channels is performed, and the SM ZZ
∗→ 4`
decay fractions are assumed.
The fiducial cross section σ
i,fidfor a given final state or bin of the differential
distribu-tion is defined as:
σ
i,fid= σ
i× A
i× B =
N
i,fitL × C
i,
C
i=
N
i,recoN
i,part,
(8.1)
where A
iis the acceptance in the fiducial phase space, B is the branching ratio and σ
iis
the total cross section in bin i. The term N
i,fitis the number of extracted signal events in
data, L is the integrated luminosity and C
iis the bin-by-bin correction factor for detector
inefficiency and resolution. The term N
i,recois the number of reconstructed signal events
and N
i,partis the number of events at the particle level in the fiducial phase-space. The
cor-rection factor is calculated from simulated Higgs boson samples, assuming SM production
mode fractions and ZZ
∗→ 4` decay fractions as discussed in section
3
. The systematic
uncertainties in this assumption are described in section
9
. The correction factors for the
different Higgs boson production modes agree within 15%, except for the t¯
tH mode, which
differs by up to 40%, due to the fact that t¯
tH events have more hadronic jets and that
no isolation requirements are applied to the leptons at the particle level. The correction
factors for the four final states are 0.64 ± 0.04 (4µ), 0.55 ± 0.03 (2e2µ), 0.48 ± 0.05 (2µ2e),
and 0.43 ± 0.06 (4e). Figure
6
shows the bin-by-bin correction factors for all decay
chan-nels combined including systematic uncertainties for the p
T,4`and N
jetsdistributions. The
large uncertainty for N
jets≥ 3 is due to the experimental jet reconstruction uncertainties
and the variations of the fractions of Higgs boson production modes (see section
9
). The
JHEP10(2017)132
[GeV] l T,4 p 0 50 100 150 200 250 300 350 Events / GeV 0 0.5 1 1.5 2 2.5 3 3.5 -1 13 TeV, 36.1 fb ATLAS 4l → ZZ* → H Data =125 GeV) H Signal (m Background ZZ* +V, VVV t , t t Background Z+jets, t Uncertainty (a) jets N 0 1 2 ≥3 Events 0 10 20 30 40 50 60 70 80 -1 13 TeV, 36.1 fb ATLAS 4l → ZZ* → H Data =125 GeV) H Signal (m Background ZZ* +V, VVV t , t t Background Z+jets, t Uncertainty (b) [GeV] 34 m 20 30 40 50 60 Events / GeV 0 1 2 3 4 5 6 7 8 -1 13 TeV, 36.1 fb ATLAS 4l → ZZ* → H Data =125 GeV) H Signal (m Background ZZ* +V, VVV t , t t Background Z+jets, t Uncertainty (c) bins 34 m vs 12 mbin 0 bin 1 bin 2 bin 3 bin 4
Events 0 10 20 30 40 50 60 70 80 90 -1 13 TeV, 36.1 fb ATLAS 4l → ZZ* → H Data =125 GeV) H Signal (m Background ZZ* +V, VVV t , t t Background Z+jets, t Uncertainty [GeV] 12 m 50 60 70 80 90 100 110 [GeV] 34 m 10 20 30 40 50 60 bin 0 bin 1 bin 2 bin 3 bin 4 Data Signal Background (d)
Figure 3. Measured data yields compared to SM Higgs boson signal and background processes for (a) the transverse momentum of the four leptons pT,4`, (b) the number of jets Njets, (c) the
invariant mass of the subleading lepton pair m34, and (d) the invariant mass of the leading vs the
subleading pair m12 vs m34. Figure (d) also includes an illustration of the chosen bins, as well as
the two-dimensional distributions of data and prediction. The error bars on the data points indicate the statistical uncertainty. The uncertainty in the prediction is shown by the dashed band.
reconstructed distribution that are found in the same bin at particle level. The bin purity
is greater than 0.75 for the Higgs boson kinematic and decay observables, and typically
greater than 0.6 for the jet variables. It can be seen that the narrower bins at low p
T,4`have
a slightly reduced bin purity, as detector resolution effects result in larger bin migration
effects, which is enhanced by the presence of a steep slope.
JHEP10(2017)132
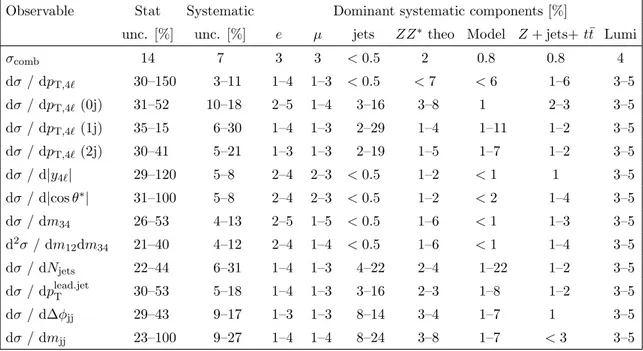
[GeV] µ 4 m 116 118 120 122 124 126 128 130 Events / GeV 0 2 4 6 8 10 -1 13 TeV, 36.1 fb ATLAS µ 4 → ZZ* → H Data =125 GeV) H Signal (m Background ZZ* +V, VVV t , t t Background Z+jets, t fitted 4l m Uncertainty (a) [GeV] 4e m 116 118 120 122 124 126 128 130 Events / GeV 0 1 2 3 4 5 6 7 8 -1 13 TeV, 36.1 fb ATLAS 4e → ZZ* → H Data =125 GeV) H Signal (m Background ZZ* +V, VVV t , t t Background Z+jets, t fitted 4l m Uncertainty (b) [GeV] 2e µ 2 m 116 118 120 122 124 126 128 130 Events / GeV 0 2 4 6 8 10 -1 13 TeV, 36.1 fb ATLAS 2e µ 2 → ZZ* → H Data =125 GeV) H Signal (m Background ZZ* +V, VVV t , t t Background Z+jets, t fitted 4l m Uncertainty (c) [GeV] µ 2e2 m 116 118 120 122 124 126 128 130 Events / GeV 0 2 4 6 8 10 12 14 -1 13 TeV, 36.1 fb ATLAS µ 2e2 → ZZ* → H Data =125 GeV) H Signal (m Background ZZ* +V, VVV t , t t Background Z+jets, t fitted 4l m Uncertainty (d)Figure 4. Template fit of SM Higgs boson signal and background to the data for the inclusive distributions for the different decay channels (a) 4µ, (b) 4e, (c) 2µ2e, (d) 2e2µ. The error bars on the data points indicate the statistical uncertainty. The SM Higgs boson predictions are normalized to the cross sections discussed in section3, while the backgrounds are normalized to the estimates described in section6. The uncertainty in the prediction is shown by the dashed band. The dotted green line illustrates the best fit.
The signal, background, and data m
4`distributions, as well as the correction
fac-tors, are used as input to a profile-likelihood-ratio fit [
114
], taking into account all bins of
a given distribution and all final states for the inclusive measurement. The likelihood
in-cludes the shape and normalization uncertainties of the backgrounds and correction factors
as nuisance parameters. This allows for correlation of systematic uncertainties between the
JHEP10(2017)132
[GeV] 4l m 116 118 120 122 124 126 128 130 Events / GeV 0 1 2 3 4 5 6 7 8 9 < 10 GeV T,4l p 0 GeV < -1 13 TeV, 36.1 fb ATLAS 4l → ZZ* → H Data =125 GeV) H Signal (m Background ZZ* +V, VVV t , t t Background Z+jets, t fitted 4l m Uncertainty (a) [GeV] 4l m 116 118 120 122 124 126 128 130 Events / GeV 0 0.5 1 1.5 2 2.5 3 < 350 GeV T,4l p 200 GeV < -1 13 TeV, 36.1 fb ATLAS 4l → ZZ* → H Data =125 GeV) H Signal (m Background ZZ* +V, VVV t , t t Background Z+jets, t fitted 4l m Uncertainty (b)Figure 5. Template fit of SM Higgs boson signal and background to the data for the (a) first and (b) last bins of the distribution of the transverse momentum of the four leptons pT,4`. The error
bars on the data points indicate the statistical uncertainty. The SM Higgs boson predictions are normalized to the cross sections discussed in section3, while the backgrounds are normalized to the estimates described in section 6. The uncertainty in the prediction is shown by the dashed band. The dotted green line illustrates the best fit.
[GeV] T,4l p 0 50 100 150 200 250 300 350 0 0.2 0.4 0.6 0.8 1 1.2 1.4 Simulation ATLAS 4l → ZZ* → H -1 13 TeV, 36.1 fb Correction factor Bin purity (a) jets N 0 1 2 ≥ 3 0 0.2 0.4 0.6 0.8 1 1.2 1.4 Simulation ATLAS 4l → ZZ* → H -1 13 TeV, 36.1 fb Correction factor Bin purity (b)
Figure 6. Bin-by-bin correction factors and bin purities for (a) the transverse momentum of the four leptons pT,4`and (b) the number of jets Njets. The bands show the systematic uncertainties in
the correction factors, which are discussed in section 9. The uncertainties in the bin purity include the detector response and pile-up uncertainties.
JHEP10(2017)132
background estimates and the correction factors, as well as between bins or decay
chan-nels. The cross sections are extracted for each bin, or final state, by minimizing twice the
negative logarithm of the profile likelihood ratio, −2 ln Λ. In the asymptotic assumption,
i.e. the large sample limit, −2 ln Λ behaves as a χ
2distribution with one degree of freedom.
The compatibility of a measured cross section and a theoretical prediction is evaluated by
computing a p-value based on the difference between the value of −2 ln Λ at the best-fit
value and the value obtained by fixing the cross sections in all bins to the ones predicted
by the theory. These p-values do not include the uncertainties in the theoretical
predic-tions, which are significantly smaller than the total data uncertainties. Therefore, they are
slightly smaller than they would be with all uncertainties included. For all measured
ob-servables the asymptotic assumption is verified with pseudo-experiments, and if necessary,
the uncertainties are corrected to the values obtained with the pseudo-experiments. In the
case of zero observed events, 95% confidence level (CL) limits on the fiducial cross sections
are set using the CL
smodified frequentist formalism [
114
,
115
].
The inclusive fiducial cross section for each channel is calculated from the fit results
following eq. (
8.1
). The fiducial cross sections of the four final states can either be summed
together to obtain an inclusive fiducial cross section, or they can be combined assuming
the SM ZZ
∗→ 4` branching ratios. The latter combination is more model dependent, but
benefits from a smaller statistical uncertainty.
9
Systematic uncertainties
Experimental systematic uncertainties affecting both the simulated background and
cor-rection factors arise from uncertainties in the efficiencies, resolutions and energy scales of
leptons and jets [
106
,
107
,
110
,
116
], as well as pile-up modelling. These uncertainties
can affect both the shape and the normalization of the distributions. For the background
estimate and the conversion of the corrected signal yields to cross sections, the luminosity
uncertainty needs to be taken into account. The uncertainty in the combined 2015+2016
integrated luminosity is 3.2%, which affects the signal and simulated background estimates.
It is derived, following a methodology similar to that detailed in ref. [
117
], from a
prelim-inary calibration of the luminosity scale using x-y beam-separation scans performed in
August 2015 and May 2016.
Uncertainties in the estimation of Z + jets, t¯
t, and W Z backgrounds are also
consid-ered. The dominant systematic uncertainties here arise from difficulties in modelling the
extrapolation from the control regions to the signal region, which can affect not only the
overall normalization but also the background composition estimates and hence the yields
in the bins of the differential distributions.
For the simulated backgrounds and the extrapolation of the inclusive fiducial cross
section to the total cross section, theoretical modelling uncertainties associated with PDF,
missing higher-order QCD corrections (via variations of the factorization and
renormaliza-tion scales), as well as underlying event and parton showering uncertainties are considered.
For the extrapolation to the total cross section, uncertainties in the H → ZZ
∗→ 4`
JHEP10(2017)132
The effect on the fitted event yields of shifting the m
4`template according to the
uncertainties in the measured Higgs boson mass, 0.24 GeV [
1
], is smaller than 0.5% and
therefore neglected.
The dependence of the correction for detector effects on the theoretical modelling is
assessed in a number of ways. For ggF, VBF and V H, the PDF4LHC NLO PDF set
is varied according to its eigenvectors, and the envelope of the variations is used as the
systematic uncertainty. The renormalization and factorization scales are varied by factors
of 2.0 and 0.5. Furthermore, m
His varied within the uncertainties in the measured Higgs
mass. The relative contribution of each Higgs boson production mechanism is varied by an
amount consistent with the uncertainties obtained from the combined ATLAS and CMS
measurement of the Higgs boson production cross sections [
2
], except for t¯
tH where the
allowed variation is inflated to cover the measured value, which is more than two standard
deviations away from the SM prediction. The correction factors are cross-checked using the
alternative Madgraph5 ggF samples (for SM and modified couplings) and the differences
with respect to nominal values are found to be well within the statistical uncertainties of
the samples. Bias studies and cross-checks with other unfolding methods, such as matrix
inversion and Bayesian iterative unfolding [
118
] show results that agree very well with the
bin-by-bin correction factor results. Observed differences are generally much smaller than
the statistical uncertainties.
The uncertainties in this analysis are dominated by the limited number of data events.
The statistical uncertainty in the fiducial inclusive cross section obtained by combining all
decay channels is 14%, while the systematic uncertainty is 7%, dominated by the lepton
uncertainties and the uncertainty in the luminosity. For the differential cross sections,
the size of the statistical and systematic uncertainties depends on the variable and is
shown in table
3
. The breakdown of the dominant systematic uncertainties is obtained
by performing the fits while fixing groups of nuisance parameters to their best-fit value.
The statistical uncertainties are mostly in the range 20–50%, and can be as high as 150%.
For the Higgs boson kinematic properties, the most important systematic uncertainties are
the experimental lepton uncertainties, 1–5%. The signal composition uncertainty grows
with the increase of the fraction of t¯
tH in some regions of phase space. Therefore, for
observables defined by the jet activity produced in association with the Higgs boson, not
only the jet energy scale but also the signal composition uncertainties become increasingly
important, especially at high N
jetsand p
lead.jetT(∼20% each for N
jets≥ 3).
10
Results
The inclusive fiducial cross sections of H → ZZ
∗→ 4` are presented in table
4
and
figure
7
. The left panel in figure
7
shows the fiducial cross sections for the four
individ-ual decay channels (4µ, 4e, 2µ2e, 2e2µ). The middle panel shows the cross sections for
opposite- and same-flavour decays, which can provide a handle on same-flavour
interfer-ence effects, as well as the fiducial cross sections obtained by either summing all 4` decay
channels or combining them assuming SM branching ratios. The data are compared to
the LHCXSWG prediction after accounting for the fiducial acceptance as determined from
JHEP10(2017)132
Observable Stat Systematic Dominant systematic components [%]unc. [%] unc. [%] e µ jets ZZ∗theo Model Z + jets+ t¯t Lumi
σcomb 14 7 3 3 < 0.5 2 0.8 0.8 4 dσ / dpT,4` 30–150 3–11 1–4 1–3 < 0.5 < 7 < 6 1–6 3–5 dσ / dpT,4`(0j) 31–52 10–18 2–5 1–4 3–16 3–8 1 2–3 3–5 dσ / dpT,4`(1j) 35–15 6–30 1–4 1–3 2–29 1–4 1–11 1–2 3–5 dσ / dpT,4`(2j) 30–41 5–21 1–3 1–3 2–19 1–5 1–7 1–2 3–5 dσ / d|y4`| 29–120 5–8 2–4 2–3 < 0.5 1–2 < 1 1 3–5 dσ / d|cos θ∗| 31–100 5–8 2–4 2–3 < 0.5 1–2 < 2 1–4 3–5 dσ / dm34 26–53 4–13 2–5 1–5 < 0.5 1–6 < 1 1–3 3–5 d2σ / dm12dm34 21–40 4–12 2–4 1–4 < 0.5 1–6 < 1 1–4 3–5 dσ / dNjets 22–44 6–31 1–4 1–3 4–22 2–4 1–22 1–2 3–5 dσ / dplead.jetT 30–53 5–18 1–4 1–3 3–16 2–3 1–8 1–2 3–5 dσ / d∆φjj 29–43 9–17 1–3 1–3 8–14 3–4 1–7 1 3–5 dσ / dmjj 23–100 9–27 1–4 1–4 8–24 3–8 1–7 < 3 3–5
Table 3. Fractional uncertainties for the inclusive fiducial cross section σcomb, obtained by
com-bining all decay channels, and ranges of systematic uncertainties for the differential observables. The columns e, µ, jets represent the experimental uncertainties in lepton and jet reconstruction and identification. The ZZ∗theory uncertainties include the PDF and scale variations. The model uncertainties are dominated by the production mode composition variations in the extraction of the correction factors.
the SM Higgs boson simulated samples (see section
3
). The fiducial cross section is
ex-trapolated to the total phase space, as shown in the right panel, using the same fiducial
acceptance as well as the branching ratios, with the additional uncertainties described
in section
9
. The total cross section is also compared to the cross sections predicted by
NNLOPS, HRes, and MG5 aMC@NLO FxFx (see section
3
). It can be seen that the
MG5 aMC@NLO FxFx cross section is lower than the other predictions, as it is only
accurate to NLO in QCD for inclusive ggF production. All generators predict cross sections
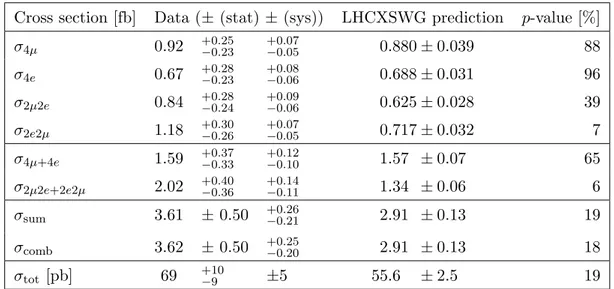
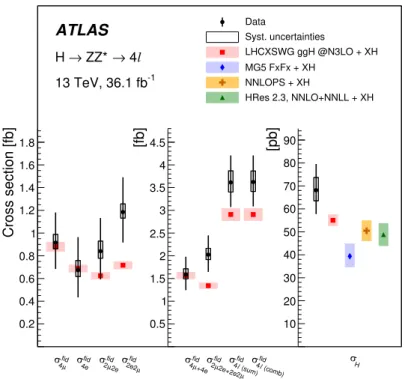
that are lower than the LHCXSWG calculation. The observed fiducial cross sections in
the 2e2µ and 2µ2e final states are higher than the prediction, which leads to an overall
larger observed cross section. The combined fiducial cross section and the LHCXSWG
prediction agree well, only differing by 1.3 standard deviations. The p-values, calculated
as described in section
8
, are also shown in table
4
. They indicate good compatibility with
the LHCXSWG predictions.
The measured differential cross sections and their comparisons to SM predictions are
presented in figures
8
–
10
. The data are compared to SM predictions constructed from the
ggF predictions provided by NNLOPS, MG5 aMC@NLO FxFx, and, for p
T,4`and |y
4`|,
by HRes. All ggF samples are normalized using the LHCXSWG cross section. Predictions
for all other Higgs boson production modes are normalized as discussed in section
3
. The
JHEP10(2017)132
Cross section [fb]
Data (± (stat) ± (sys))
LHCXSWG prediction
p-value [%]
σ
4µ0.92
+0.25−0.23 +0.07−0.050.880 ± 0.039
88
σ
4e0.67
+0.28−0.23 +0.08−0.060.688 ± 0.031
96
σ
2µ2e0.84
+0.28−0.24 +0.09−0.060.625 ± 0.028
39
σ
2e2µ1.18
+0.30−0.26 +0.07−0.050.717 ± 0.032
7
σ
4µ+4e1.59
+0.37−0.33 +0.12−0.101.57 ± 0.07
65
σ
2µ2e+2e2µ2.02
+0.40−0.36 +0.14−0.111.34 ± 0.06
6
σ
sum3.61
± 0.50
+0.26−0.212.91 ± 0.13
19
σ
comb3.62
± 0.50
+0.25−0.202.91 ± 0.13
18
σ
tot[pb]
69
+10−9±5
55.6
± 2.5
19
Table 4. The fiducial and total cross sections of Higgs boson production measured in the 4` final state. The fiducial cross sections are given separately for each decay channel, and for same- and opposite-flavour decays. The inclusive fiducial cross section is measured as the sum of all channels, as well as by combining the per-channel measurements assuming SM ZZ∗→ 4` branching ratios. The LHCXSWG prediction is accurate to N3LO in QCD for the ggF process. For the fiducial cross-section predictions, the LHCXSWG cross cross-sections are multiplied by the acceptances determined using the NNLOPS sample for ggF and the samples discussed in section3for the other production modes. The p-values indicating the compatibility of the measurement and the SM prediction are shown as well. They do not include the systematic uncertainty in the theoretical predictions.
PDF inputs used for each prediction are varied according to the eigenvectors of each PDF
set. The renormalization and factorization scales are varied by factors of 2.0 and 0.5. The
figures include the p-values quantifying the compatibility of the measurement and the SM
predictions.
The observed small excess in the measured inclusive cross section cannot be traced to
a particular phase space region. Figure
8
shows differential fiducial cross sections as a
func-tion of p
T,4`, |y
4`|, m
34, and |cos θ
∗|. The measured cross sections at high p
T,4`are slightly
higher than the predictions, but the distribution is consistent with the SM predictions
within the uncertainties. The observation of good agreement between data and SM
predic-tion of the cross secpredic-tions as a funcpredic-tion of m
34and |cos θ
∗| is consistent with dedicated
mea-surements that have shown the Higgs boson to be a scalar particle with even parity [
3
,
4
].
In figure
9
, the differential fiducial cross sections as a function of N
jets, p
lead.jetT, m
jj,
and ∆φ
jjare shown. Agreement between data and theory is still good, but becomes a
bit worse for higher jet multiplicities and higher p
lead.jetT, similarly to what was observed
in the ATLAS analyses at
√
s = 8 TeV [
7
–
9
]. MG5 aMC@NLO FxFx describes the jet
multiplicities slightly better than NNLOPS. For large values of m
jjand the left bin of
the ∆φ
jjdistribution, the measured cross section is more than twice the predicted value
(∼2 and ∼1.5 standard deviations respectively).
Figure
10
presents the differential fiducial cross sections as a function of p
T,4`for
JHEP10(2017)132
fid µ 4 σ fid 4e σ fid 2e µ 2 σ fid µ 2e2 σ fid +4e µ 4 σ fid µ 2e+2e2 µ 2 σ fid (sum) l 4 σ fid (comb) l 4 σ H σ Cross section [fb] 0.2 0.4 0.6 0.8 1 1.2 1.4 1.6 1.8 [fb] 0.5 1 1.5 2 2.5 3 3.5 4 4.5 [pb] 10 20 30 40 50 60 70 80 90 ATLAS -1 13 TeV, 36.1 fb l 4 → ZZ* → H Data Syst. uncertainties LHCXSWG ggH @N3LO + XH MG5 FxFx + XH NNLOPS + XH HRes 2.3, NNLO+NNLL + XHFigure 7. The fiducial cross sections (left two panels) and total cross section (right panel) of Higgs boson production measured in the 4` final state. The fiducial cross sections are shown separately for each decay channel, and for same- and opposite-flavour decays. The inclusive fiducial cross section is measured as the sum of all channels, as well as by combining the per-channel measurements assuming SM ZZ∗ → 4` branching ratios. The LHCXSWG prediction is accurate to N3LO in QCD for the ggF process. For the fiducial cross-section predictions, the LHCXSWG cross sections are multiplied by the acceptances determined using the NNLOPS sample for ggF and the samples discussed in section3for the other production modes. For the total cross section, the cross-section predictions by the generators NNLOPS, HRes, and MG5 aMC@NLO FxFx are also shown. The cross sections for all other Higgs boson production modes XH are added. The error bars on the data points show the total uncertainties, while the systematic uncertainties are indicated by the boxes. The shaded bands around the theoretical predictions indicate the PDF and scale uncertainties.
distribution. For the latter, the m
12vs m
34kinematic plane is divided into five regions
and projected onto a one-dimensional distribution, as shown in figure
3(d)
. The split into
different jet multiplicities allows one to probe perturbative QCD calculations for different
production modes. The 0-jet bin is dominated by Higgs boson events produced through
ggF, while the ≥ 2-jet bin is enriched with VBF events. No significant deviation from the
predictions is seen, as indicated by the p-values which reflect the level of agreement for the
three jet bins together, treating them as a two-dimensional distribution. The higher values
of the measured cross sections in the ≥ 2-jet bin reflect the observations in figure
9(a)
. The
data and the predictions also agree well for the m
12vs m
34distribution.
The differential fiducial cross sections can be interpreted in the context of searches
for physics beyond the SM. In the absence of significant deviations from the SM
predic-tions, limits are set on modified Higgs boson interactions within the framework of
pseudo-JHEP10(2017)132
[fb/GeV] l T,4 p /d σ d 0 0.02 0.04 0.06 0.08 0.1 0.12 0.14 ATLAS -1 13 TeV, 36.1 fb l 4 → ZZ* → H Data Syst. uncertainties = 1.47, +XH K MG5 FxFx = 1.1, +XH K NNLOPS = 1.1, +XH K HRes 2.3 XH = VBF+WH+ZH+ttH+bbH -value NNLOPS = 25% p -value MG5 FxFx = 42% p -value HRes = 21% p [GeV] l T,4 p 0 10 15 20 30 45 60 80 120 200 350 Data/Theory 0.5 1 1.5 2 2.5 (a) [fb] l 4 y /d σ d 0 1 2 3 4 5 ATLAS -1 13 TeV, 36.1 fb l 4 → ZZ* → H Data Syst. uncertainties = 1.47, +XH K MG5 FxFx = 1.1, +XH K NNLOPS = 1.1, +XH K HRes 2.3 XH = VBF+WH+ZH+ttH+bbH -value NNLOPS = 65% p -value MG5 FxFx = 66% p -value HRes = 64% p l 4 y 0 0.5 1 1.5 2 2.5 Data/Theory 0.5 1 1.5 2 2.5 (b) [fb/GeV] 34 m /d σ d 0 0.05 0.1 0.15 0.2 0.25 0.3 0.35 ATLAS -1 13 TeV, 36.1 fb l 4 → ZZ* → H Data Syst. uncertainties = 1.47, +XH K MG5 FxFx = 1.1, +XH K NNLOPS XH = VBF+WH+ZH+ttH+bbH -value NNLOPS = 42% p -value MG5 FxFx = 44% p upper limit s @95% CL [GeV] 34 m 20 30 40 50 60 Data/Theory 0.5 1 1.5 2 2.5 (c) *|) [fb] θ /d(|cos σ d 0 2 4 6 8 10 ATLAS -1 13 TeV, 36.1 fb l 4 → ZZ* → H Data Syst. uncertainties = 1.47, +XH K MG5 FxFx = 1.1, +XH K NNLOPS XH = VBF+WH+ZH+ttH+bbH -value NNLOPS = 55% p -value MG5 FxFx = 60% p *| θ |cos 0 0.1 0.2 0.3 0.4 0.5 0.6 0.7 0.8 0.9 1 Data/Theory 0.5 1 1.5 2 2.5 (d)Figure 8. Differential fiducial cross sections, for (a) the transverse momentum pT,4` of the Higgs
boson, (b) the absolute value of the rapidity |y4`| of the Higgs boson, (c) the invariant mass of
the subleading lepton pair m34, (d) the magnitude of the cosine of the decay angle of the leading
lepton pair in the four-lepton rest frame with respect to the beam axis |cos θ∗|. The measured cross sections are compared to ggF predictions by NNLOPS, MG5 aMC@NLO FxFx, and, for pT,4`
and |y4`|, by HRes, all normalized to the N3LO cross section with the listed K-factors. Predictions
for all other Higgs boson production modes XH are added. The error bars on the data points show the total uncertainties, while the systematic uncertainties are indicated by the boxes. The shaded bands on the expected cross sections indicate the PDF and scale uncertainties. The p-values indicating the compatibility of the measurement and the SM prediction are shown as well. They do not include the systematic uncertainty in the theoretical predictions.
JHEP10(2017)132
[fb] σ 0 0.5 1 1.5 2 2.5 3 ATLAS -1 13 TeV, 36.1 fb l 4 → ZZ* → H Data Syst. uncertainties = 1.47, +XH K MG5 FxFx = 1.1, +XH K NNLOPS XH = VBF+WH+ZH+ttH+bbH jets N 0 1 2 ≥1 ≥2 ≥3 Data/Theory 0.5 1 1.5 2 2.5 (a) [fb/GeV] lead. jet T p /d σ d 0 0.01 0.02 0.03 0.04 0.05 0.06 0.07 ATLAS -1 13 TeV, 36.1 fb l 4 → ZZ* → H Data Syst. uncertainties = 1.47, +XH K MG5 FxFx = 1.1, +XH K NNLOPS XH = VBF+WH+ZH+ttH+bbH -value NNLOPS = 18% p -value MG5 FxFx = 37% p [GeV] lead. jet T p 30 40 55 75 120 350 Data/Theory 0.5 1 1.5 2 2.5 (b) [fb/GeV]jj m /d σ d 0 0.0005 0.001 0.0015 0.002 0.0025 ATLAS -1 13 TeV, 36.1 fb l 4 → ZZ* → H Data Syst. uncertainties = 1.47, +XH K MG5 FxFx = 1.1, +XH K NNLOPS XH = VBF+WH+ZH+ttH+bbH -value NNLOPS = 1.9% p -value MG5 FxFx = 3.6% p [GeV] jj m 0 120 3000 Data/Theory 0.5 1 1.5 2 2.5 (c) ) [fb/rad] jj φ ∆ /d( σd 0 0.05 0.1 0.15 0.2 0.25 0.3 0.35 ATLAS -1 13 TeV, 36.1 fb l 4 → ZZ* → H Data Syst. uncertainties = 1.47, +XH K MG5 FxFx = 1.1, +XH K NNLOPS XH = VBF+WH+ZH+ttH+bbH -value NNLOPS = 11% p -value MG5 FxFx = 20% p [rad] jj φ ∆ 0 1 2 3 4 5 6 Data/Theory 0.5 1 1.5 2 2.5 (d)Figure 9. Differential fiducial cross sections, for (a) the number of jets Njets, (b) the transverse
momentum plead.jetT of the leading jet, (c) the invariant mass of the two leading jets mjj, (d) the
angle between the two leading jets in the transverse plane ∆φjj. The measured cross sections are
compared to ggF predictions by NNLOPS and MG5 aMC@NLO FxFx, all normalized to the N3LO cross section with the listed K-factors. Predictions for all other Higgs boson production modes XH are added. The error bars on the data points show the total uncertainties, while the systematic uncertainties are indicated by the boxes. The shaded bands on the expected cross sections indicate the PDF and scale uncertainties. The p-values indicating the compatibility of the measurement and the SM prediction are shown as well. They do not include the systematic uncertainty in the theoretical predictions.
JHEP10(2017)132
[fb/GeV] =0 jets N l T,4 p /d σ d 0 0.01 0.02 0.03 0.04 0.05 0.06 0.07 0.08 ATLAS -1 13 TeV, 36.1 fb l 4 → ZZ* → H Data Syst. uncertainties = 1.47, +XH K MG5 FxFx = 1.1, +XH K NNLOPS XH = VBF+WH+ZH+ttH+bbH -value NNLOPS = 17% p -value MG5 FxFx = 23% p upper limit s @95% CL [GeV] =0 jets N l T,4 p 0 15 30 120 350 Data/Theory 0.5 1 1.5 2 2.5 (a) [fb/GeV] =1 jets N l T,4 p /d σ d 0 0.005 0.01 0.015 0.02 0.025 ATLAS -1 13 TeV, 36.1 fb l 4 → ZZ* → H Data Syst. uncertainties = 1.47, +XH K MG5 FxFx = 1.1, +XH K NNLOPS XH = VBF+WH+ZH+ttH+bbH -value NNLOPS = 17% p -value MG5 FxFx = 23% p [GeV] =1 jets N l T,4 p 0 30 60 80 120 350 Data/Theory 0.5 1 1.5 2 2.5 (b) [fb/GeV] 2 ≥ jets N l T,4 p /d σ d 0 0.001 0.002 0.003 0.004 0.005 0.006 0.007 0.008 ATLAS -1 13 TeV, 36.1 fb l 4 → ZZ* → H Data Syst. uncertainties = 1.47, +XH K MG5 FxFx = 1.1, +XH K NNLOPS XH = VBF+WH+ZH+ttH+bbH -value NNLOPS = 17% p -value MG5 FxFx = 23% p [GeV] 2 ≥ jets N l T,4 p 0 120 350 Data/Theory 0.5 1 1.5 2 2.5 (c) [fb] σ 0 0.5 1 1.5 2 2.5 ATLAS -1 13 TeV, 36.1 fb l 4 → ZZ* → H Data Syst. uncertainties = 1.47, +XH K MG5 FxFx = 1.1, +XH K NNLOPS XH = VBF+WH+ZH+ttH+bbH -value NNLOPS = 41% p -value MG5 FxFx = 54% p 34 m vs 12 mbin 0 bin 1 bin 2 bin 3 bin 4
Data/Theory 0.5 1 1.5 2 2.5 (d)
Figure 10. Figures (a)–(c) show differential fiducial cross sections of the transverse momentum pT,4` of the Higgs boson for different jet multiplicities Njets, and (d) shows the invariant mass of
the leading lepton pair vs that of the subleading pair, m12 vs m34. The binning of m12 vs m34 is
the same as presented in figure3(d). The measured cross sections are compared to ggF predictions by NNLOPS and MG5 aMC@NLO FxFx, all normalized to the N3LO cross section with the listed K-factors. Predictions for all other Higgs boson production modes XH are added. The error bars on the data points show the total uncertainties, while the systematic uncertainties are indicated by the boxes. The shaded bands on the expected cross sections indicate the PDF and scale uncertainties. For the cross sections as a function of pT,4`, the p-values reflect the level of